
生物多样性 ›› 2019, Vol. 27 ›› Issue (1): 13-23. DOI: 10.17520/biods.2018193 cstr: 32101.14.biods.2018193
所属专题: 钱江源国家公园生物多样性保护与管理
任鹏1,余建平2,陈小南2,申小莉3,宋虓1,张田田1,余永泉2,丁平1,*( )
)
收稿日期:2018-07-15
接受日期:2018-10-12
出版日期:2019-01-20
发布日期:2019-03-15
通讯作者:
丁平
基金资助:
Ren Peng1,Yu Jianping2,Chen Xiaonan2,Shen Xiaoli3,Song Xiao1,Zhang Tiantian1,Yu Yongquan2,Ding Ping1,*()
Received:2018-07-15
Accepted:2018-10-12
Online:2019-01-20
Published:2019-03-15
Contact:
Ding Ping
摘要:
为了解浙江省古田山国家级自然保护区内白颈长尾雉(Syrmaticus ellioti)的分布格局和季节变化, 2014年5月至2016年4月, 我们对其进行了为期2年的网格化监测。共有44个公里网格拍摄到白颈长尾雉, 独立探测数量为211次, 雌雄性比为1 : 1.64。白颈长尾雉主要分布在实验区和缓冲区, 其探测率在常绿落叶阔叶混交林、杉木(Cunninghamia lanceolata)林、针阔叶混交林、人工油茶(Camellia oleifera)林和常绿阔叶林中依次递减, 主要分布在海拔600-800 m。冬、春两季, 白颈长尾雉活动强度和区域相对较小, 而夏、秋两季活动强度和区域相对增加, 其分布在海拔段(F4,12 = 3.76, P < 0.05)和季节间(F3,12 = 3.34, P < 0.05)都存在显著差异。对海拔和气候因子进行回归分析发现, 日平均气温和海拔对白颈长尾雉是否出现均有极显著影响(P < 0.01); 白颈长尾雉月探测率和探测到白颈长尾雉位点的海拔均与月平均气温呈极显著正相关(P < 0.001), 而与月平均降水量无显著线性关系(P > 0.05)。这表明白颈长尾雉的活动在很大程度上受海拔和气温影响, 随月平均气温的升高有向高海拔迁移的趋势。模型选择和多模型推断显示, 最优模型仅保留“100 m内水源”这一个变量, 次优模型是“100 m内水源 × 海拔”, 最优和次优模型的权重分别为0.18和0.14, “100 m内水源”和“海拔”是影响白颈长尾雉在保护区内分布的重要因子, 重要值分别为0.82和0.51。因此, 白颈长尾雉的分布并非仅由某一个或几个环境变量决定, 而是由多个环境变量共同决定。气温的变化和对不同海拔段的选择是导致白颈长尾雉形成不同季节分布格局的原因。
任鹏, 余建平, 陈小南, 申小莉, 宋虓, 张田田, 余永泉, 丁平 (2019) 古田山国家级自然保护区白颈长尾雉的分布格局及其季节变化. 生物多样性, 27, 13-23. DOI: 10.17520/biods.2018193.
Ren Peng, Yu Jianping, Chen Xiaonan, Shen Xiaoli, Song Xiao, Zhang Tiantian, Yu Yongquan, Ding Ping (2019) Seasonal variation in the distribution of Elliot’s pheasant (Syrmaticus ellioti) in Gutianshan National Nature Reserve. Biodiversity Science, 27, 13-23. DOI: 10.17520/biods.2018193.
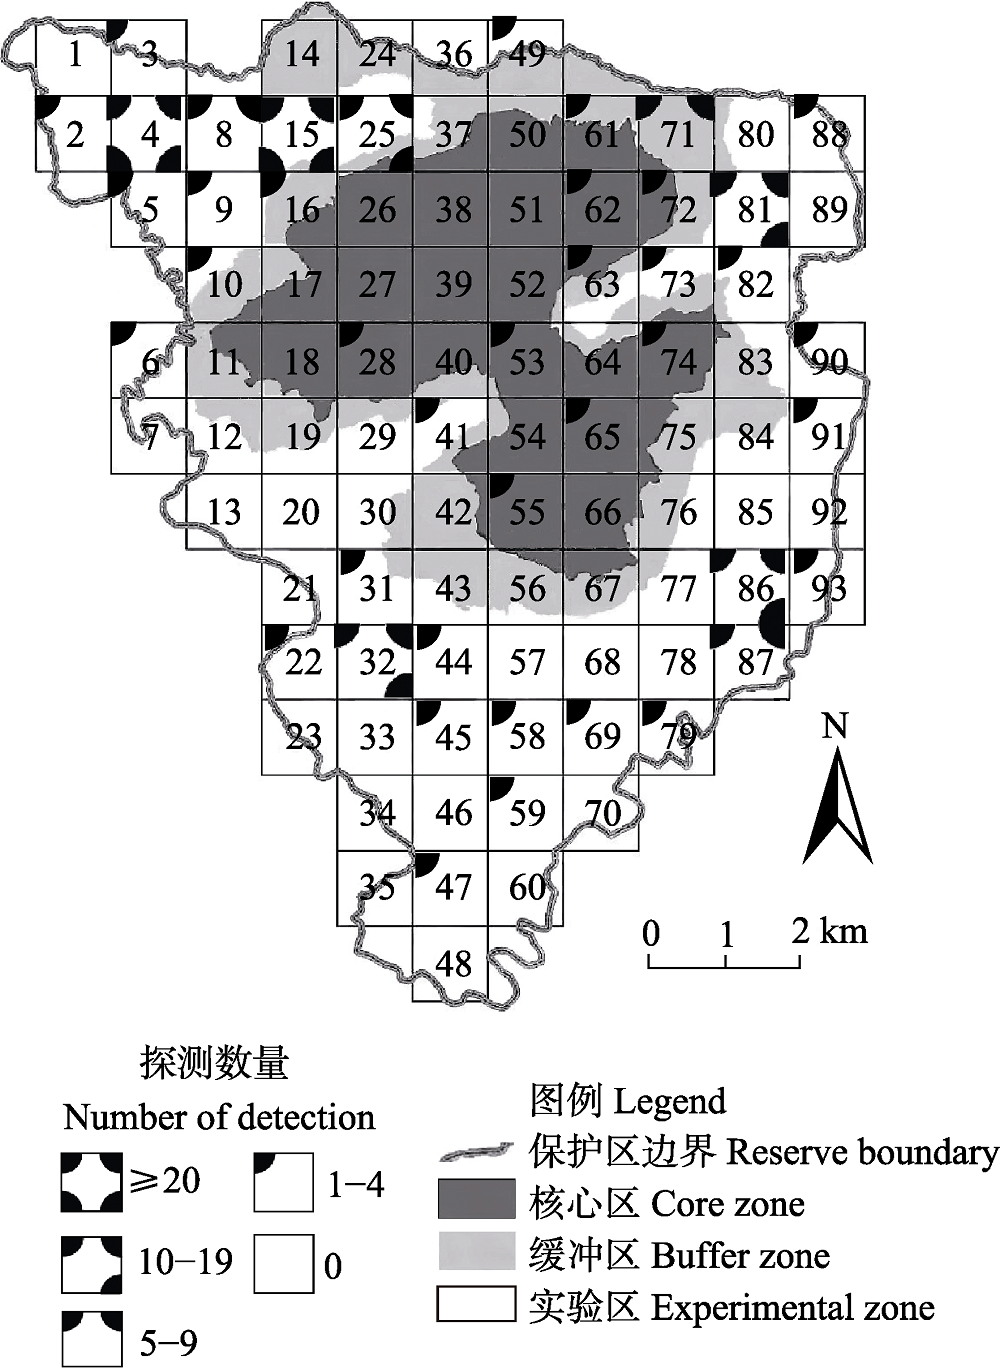
图1 古田山国家级自然保护区内白颈长尾雉分布图
Fig. 1 Distribution of Elliot’s pheasant in Gutianshan National Nature Reserve
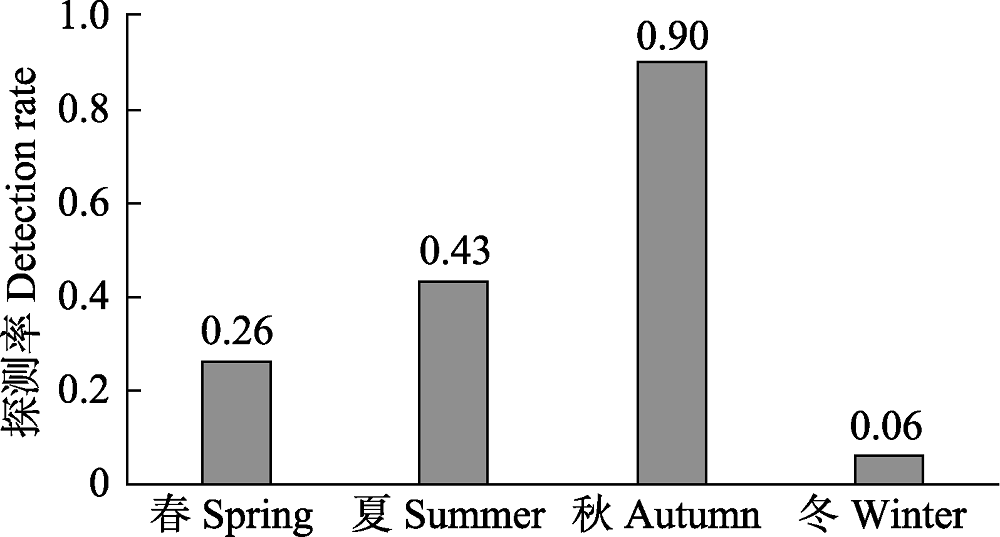
图2 白颈长尾雉不同季节的探测率
Fig. 2 Seasonal differences of the detection rate of Elliot’s pheasant
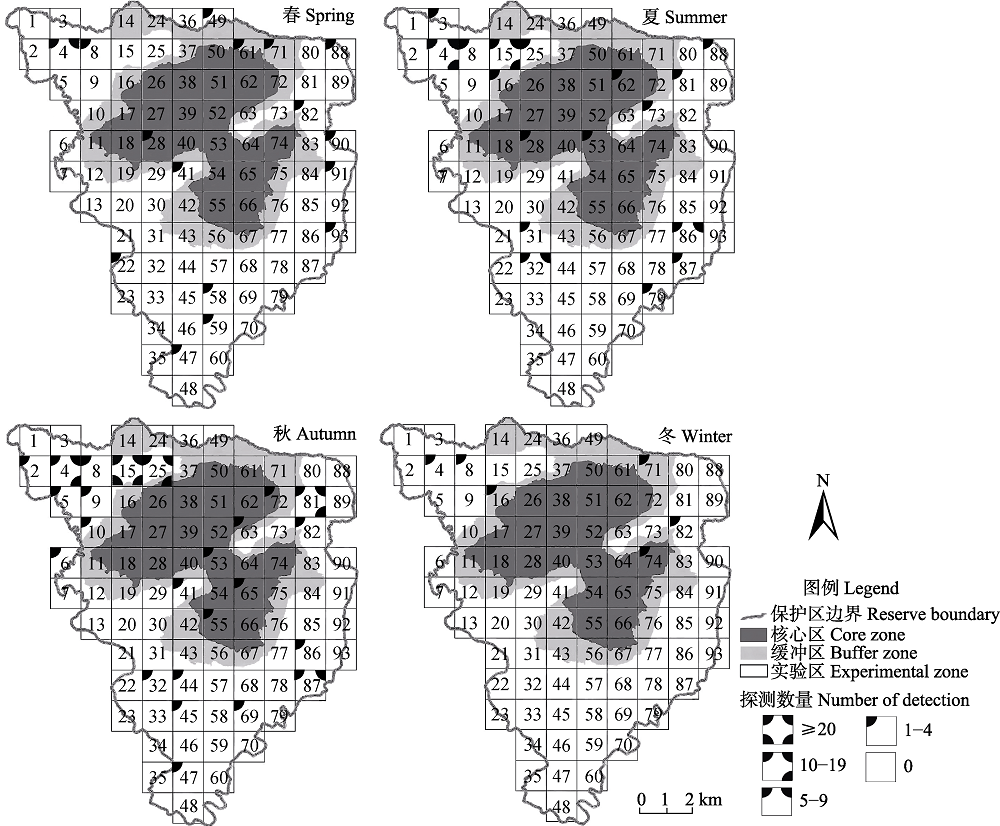
图3 古田山国家级自然保护区内不同季节白颈长尾雉分布图
Fig. 3 Seasonal patterns of Elliot’s pheasant distribution in Gutianshan National Nature Reserve
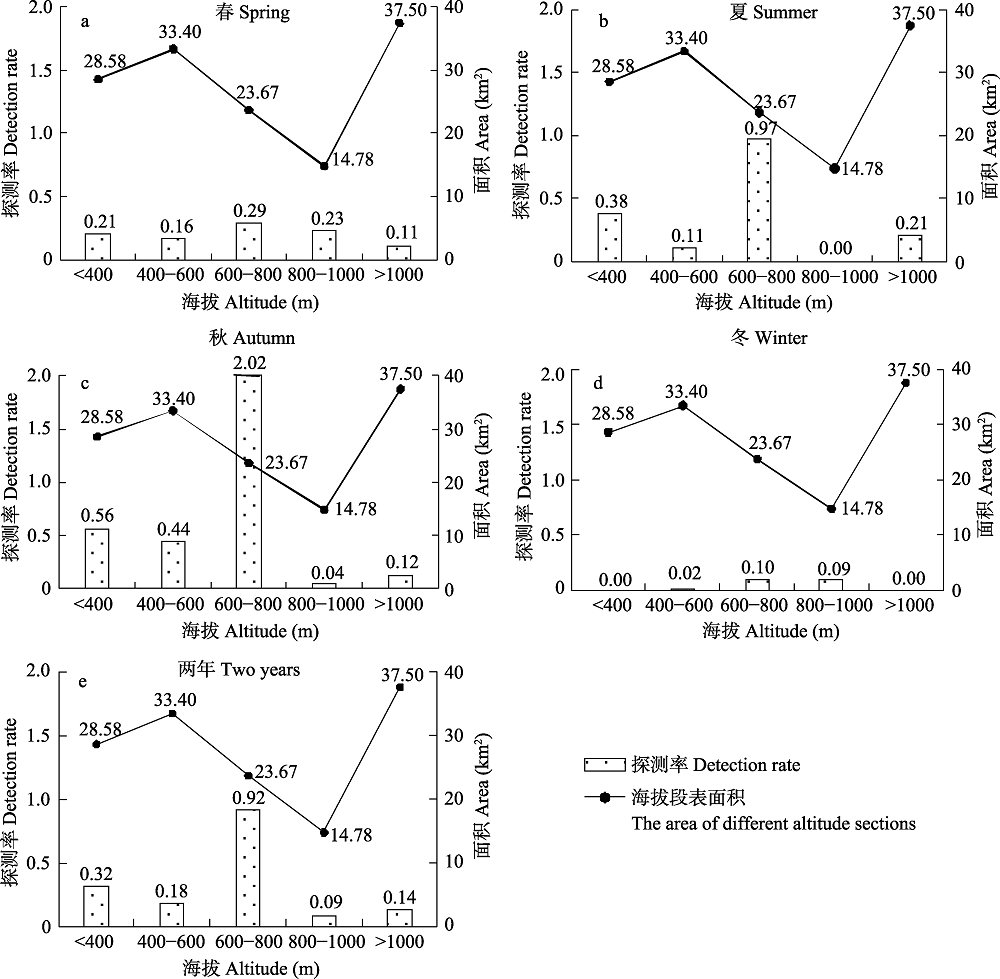
图4 白颈长尾雉在不同海拔段的探测率
Fig. 4 The detection rate of Elliot’s pheasant in different altitude sections
| 自变量 Independent variable | 回归系数 Coefficients | 标准误差 Standard error | z | P | |
|---|---|---|---|---|---|
| 逻辑斯谛回归 Logistic regression, P < 0.0001 | |||||
| 雌 + 雄 Female + male | 海拔 Altitude | -0.259 | 0.100 | -2.592 | 0.0095** |
| 日平均气温 Daily average temperature | 0.643 | 0.108 | 5.937 | 0.0000*** | |
| 雌 Female | 海拔 Altitude | -0.307 | 0.145 | -2.119 | 0.0341* |
| 日平均气温 Daily average temperature | 0.563 | 0.156 | 3.6 | 0.0003*** | |
| 雄 Male | 海拔 Altitude | -0.216 | 0.115 | -1.874 | 0.061 |
| 日平均气温 Daily average temperature | 0.685 | 0.129 | 5.314 | 0.0000*** | |
| 线性回归 Linear regression, P < 0.0001 | |||||
| 雌 + 雄 Female + male | 月平均气温 Month average temperature | 6.231 | 0.980 | 6.361 | 0.0000*** |
| 月平均降水量 Month average precipitation | -1.104 | 0.980 | -1.127 | 0.273 | |
| 线性回归 Linear regression, P < 0.0001 | |||||
| 海拔 Altitude | 月平均气温 Month average temperature | 6.107 | 0.413 | 14.803 | 0.0000*** |
| 月平均降水量 Month average precipitation | 0.000 | 0.002 | 0.182 | 0.856 | |
表1 逻辑斯谛回归和线性回归分析结果
Table 1 The results of logistic regression and linear regression analysis
| 自变量 Independent variable | 回归系数 Coefficients | 标准误差 Standard error | z | P | |
|---|---|---|---|---|---|
| 逻辑斯谛回归 Logistic regression, P < 0.0001 | |||||
| 雌 + 雄 Female + male | 海拔 Altitude | -0.259 | 0.100 | -2.592 | 0.0095** |
| 日平均气温 Daily average temperature | 0.643 | 0.108 | 5.937 | 0.0000*** | |
| 雌 Female | 海拔 Altitude | -0.307 | 0.145 | -2.119 | 0.0341* |
| 日平均气温 Daily average temperature | 0.563 | 0.156 | 3.6 | 0.0003*** | |
| 雄 Male | 海拔 Altitude | -0.216 | 0.115 | -1.874 | 0.061 |
| 日平均气温 Daily average temperature | 0.685 | 0.129 | 5.314 | 0.0000*** | |
| 线性回归 Linear regression, P < 0.0001 | |||||
| 雌 + 雄 Female + male | 月平均气温 Month average temperature | 6.231 | 0.980 | 6.361 | 0.0000*** |
| 月平均降水量 Month average precipitation | -1.104 | 0.980 | -1.127 | 0.273 | |
| 线性回归 Linear regression, P < 0.0001 | |||||
| 海拔 Altitude | 月平均气温 Month average temperature | 6.107 | 0.413 | 14.803 | 0.0000*** |
| 月平均降水量 Month average precipitation | 0.000 | 0.002 | 0.182 | 0.856 | |
| 生境因子 Habitat factor | 植被类型 Vegetation type | 森林起源 Forest origin | 乔木郁闭度 Tree canopy closure | 灌木盖度 Shrub coverage | 草本盖度 Herbaceous coverage | 100 m内水源 Source of water in 100 meters | 海拔 Altitude (m) | 坡位 Position |
|---|---|---|---|---|---|---|---|---|
| 森林起源 Forest origin | -0.415*** | |||||||
| 乔木郁闭度 Tree canopy closure | 0.135* | -0.142* | ||||||
| 灌木盖度 Shrub coverage | 0.146** | 0.018 | 0.111* | |||||
| 草本盖度 Herbaceous coverage | -0.059 | 0.142* | -0.08 | 0.069 | ||||
| 100 m内水源 Source of water in 100 meters | -0.125* | 0.032 | 0.127* | 0.082 | -0.145** | |||
| 海拔 Altitude (m) | 0.244*** | -0.452*** | 0.087 | 0.041 | -0.188*** | 0.287*** | ||
| 坡位 Position | 0.118* | -0.092 | 0.043 | -0.195*** | -0.056 | -0.421*** | 0.185*** | |
| 坡度 Gradient | 0.041 | 0.003 | 0.181** | 0.281*** | -0.186*** | 0.06 | 0.154** | -0.095 |
表2 栖息地特征参数间的相关系数
Table 2 Correlation coefficients among the characteristic parameters of habitat
| 生境因子 Habitat factor | 植被类型 Vegetation type | 森林起源 Forest origin | 乔木郁闭度 Tree canopy closure | 灌木盖度 Shrub coverage | 草本盖度 Herbaceous coverage | 100 m内水源 Source of water in 100 meters | 海拔 Altitude (m) | 坡位 Position |
|---|---|---|---|---|---|---|---|---|
| 森林起源 Forest origin | -0.415*** | |||||||
| 乔木郁闭度 Tree canopy closure | 0.135* | -0.142* | ||||||
| 灌木盖度 Shrub coverage | 0.146** | 0.018 | 0.111* | |||||
| 草本盖度 Herbaceous coverage | -0.059 | 0.142* | -0.08 | 0.069 | ||||
| 100 m内水源 Source of water in 100 meters | -0.125* | 0.032 | 0.127* | 0.082 | -0.145** | |||
| 海拔 Altitude (m) | 0.244*** | -0.452*** | 0.087 | 0.041 | -0.188*** | 0.287*** | ||
| 坡位 Position | 0.118* | -0.092 | 0.043 | -0.195*** | -0.056 | -0.421*** | 0.185*** | |
| 坡度 Gradient | 0.041 | 0.003 | 0.181** | 0.281*** | -0.186*** | 0.06 | 0.154** | -0.095 |
| 模型组合 Model combination | 自由度 df | 似然对数 Log-Likelihood | AICc | Delta | 权重 Weight |
|---|---|---|---|---|---|
| e | 2 | -59.12 | 122.39 | 0.00 | 0.18 |
| a × e | 3 | -58.26 | 122.80 | 0.42 | 0.14 |
| b × e | 3 | -59.01 | 124.30 | 1.91 | 0.07 |
| d × e | 3 | -59.01 | 124.30 | 1.91 | 0.07 |
| a × d × e | 4 | -57.99 | 124.46 | 2.07 | 0.06 |
| c × e | 3 | -59.12 | 124.53 | 2.14 | 0.06 |
| a | 2 | -60.33 | 124.79 | 2.40 | 0.05 |
| a × b × e | 4 | -58.24 | 124.96 | 2.57 | 0.05 |
| a × c × e | 4 | -58.26 | 124.99 | 2.60 | 0.05 |
| b × d × e | 4 | -58.85 | 126.16 | 3.77 | 0.03 |
| a × d | 3 | -60.01 | 126.30 | 3.91 | 0.02 |
| c × d × e | 4 | -59.00 | 126.47 | 4.09 | 0.02 |
| b × c × e | 4 | -59.01 | 126.49 | 4.10 | 0.02 |
| a × b × d × e | 5 | -57.94 | 126.60 | 4.22 | 0.02 |
| a × c × d × e | 5 | -57.99 | 126.69 | 4.30 | 0.02 |
| a × b | 3 | -60.26 | 126.80 | 4.41 | 0.02 |
| a × c | 3 | -60.26 | 126.80 | 4.41 | 0.02 |
| a × b × c × e | 5 | -58.24 | 127.20 | 4.81 | 0.02 |
| d | 2 | -62.09 | 128.32 | 5.94 | 0.01 |
| b × c × d × e | 5 | -58.82 | 128.36 | 5.97 | 0.01 |
| c | 2 | -62.14 | 128.42 | 6.04 | 0.01 |
| a × b × d | 4 | -59.98 | 128.43 | 6.04 | 0.01 |
| a × c × d | 4 | -60.00 | 128.46 | 6.07 | 0.01 |
| b | 2 | -62.18 | 128.50 | 6.11 | 0.01 |
| a × b × c | 4 | -60.18 | 128.84 | 6.45 | 0.01 |
| a × b × c × d × e | 6 | -57.93 | 128.88 | 6.49 | 0.01 |
| c × d | 3 | -62.08 | 130.43 | 8.04 | 0.00 |
| b × d | 3 | -62.09 | 130.46 | 8.08 | 0.00 |
| b × c | 3 | -62.14 | 130.56 | 8.17 | 0.00 |
| a × b × c × d | 5 | -59.96 | 130.63 | 8.24 | 0.00 |
| b × c × d | 4 | -62.08 | 132.62 | 10.24 | 0.00 |
表3 模型平均各参数的组合结果
Table 3 The result of combined the parameters of the model average
| 模型组合 Model combination | 自由度 df | 似然对数 Log-Likelihood | AICc | Delta | 权重 Weight |
|---|---|---|---|---|---|
| e | 2 | -59.12 | 122.39 | 0.00 | 0.18 |
| a × e | 3 | -58.26 | 122.80 | 0.42 | 0.14 |
| b × e | 3 | -59.01 | 124.30 | 1.91 | 0.07 |
| d × e | 3 | -59.01 | 124.30 | 1.91 | 0.07 |
| a × d × e | 4 | -57.99 | 124.46 | 2.07 | 0.06 |
| c × e | 3 | -59.12 | 124.53 | 2.14 | 0.06 |
| a | 2 | -60.33 | 124.79 | 2.40 | 0.05 |
| a × b × e | 4 | -58.24 | 124.96 | 2.57 | 0.05 |
| a × c × e | 4 | -58.26 | 124.99 | 2.60 | 0.05 |
| b × d × e | 4 | -58.85 | 126.16 | 3.77 | 0.03 |
| a × d | 3 | -60.01 | 126.30 | 3.91 | 0.02 |
| c × d × e | 4 | -59.00 | 126.47 | 4.09 | 0.02 |
| b × c × e | 4 | -59.01 | 126.49 | 4.10 | 0.02 |
| a × b × d × e | 5 | -57.94 | 126.60 | 4.22 | 0.02 |
| a × c × d × e | 5 | -57.99 | 126.69 | 4.30 | 0.02 |
| a × b | 3 | -60.26 | 126.80 | 4.41 | 0.02 |
| a × c | 3 | -60.26 | 126.80 | 4.41 | 0.02 |
| a × b × c × e | 5 | -58.24 | 127.20 | 4.81 | 0.02 |
| d | 2 | -62.09 | 128.32 | 5.94 | 0.01 |
| b × c × d × e | 5 | -58.82 | 128.36 | 5.97 | 0.01 |
| c | 2 | -62.14 | 128.42 | 6.04 | 0.01 |
| a × b × d | 4 | -59.98 | 128.43 | 6.04 | 0.01 |
| a × c × d | 4 | -60.00 | 128.46 | 6.07 | 0.01 |
| b | 2 | -62.18 | 128.50 | 6.11 | 0.01 |
| a × b × c | 4 | -60.18 | 128.84 | 6.45 | 0.01 |
| a × b × c × d × e | 6 | -57.93 | 128.88 | 6.49 | 0.01 |
| c × d | 3 | -62.08 | 130.43 | 8.04 | 0.00 |
| b × d | 3 | -62.09 | 130.46 | 8.08 | 0.00 |
| b × c | 3 | -62.14 | 130.56 | 8.17 | 0.00 |
| a × b × c × d | 5 | -59.96 | 130.63 | 8.24 | 0.00 |
| b × c × d | 4 | -62.08 | 132.62 | 10.24 | 0.00 |
| 模型平均 Model averaging | 100 m内水源 Source of water in 100 meters | 海拔 Altitude | 坡度 Gradient | 草本盖度 Herbaceous coverage | 灌木盖度 Shrub coverage |
|---|---|---|---|---|---|
| 重要值 Importance value | 0.82 | 0.51 | 0.30 | 0.27 | 0.26 |
| 标准化回归系数β Standardized regression coefficient β | 1.026 | -0.172 | 0.096 | 0.122 | 0.009 |
| P | 0.031* | 0.044* | 0.299 | 0.438 | 0.570 |
表4 各变量的重要值、模型回归系数及P值
Table 4 Importance values, model regression coefficient and the P-value of variables
| 模型平均 Model averaging | 100 m内水源 Source of water in 100 meters | 海拔 Altitude | 坡度 Gradient | 草本盖度 Herbaceous coverage | 灌木盖度 Shrub coverage |
|---|---|---|---|---|---|
| 重要值 Importance value | 0.82 | 0.51 | 0.30 | 0.27 | 0.26 |
| 标准化回归系数β Standardized regression coefficient β | 1.026 | -0.172 | 0.096 | 0.122 | 0.009 |
| P | 0.031* | 0.044* | 0.299 | 0.438 | 0.570 |
| [1] | BirdLife International ( 2016) Syrmaticus ellioti. The IUCN Red List of Threatened Species 2016: e.T22679325A92810598. . (accessed on 2018-10-10) |
| [2] |
Cabeza M, Moilanen A ( 2001) Design of reserve networks and the persistence of biodiversity. Trends in Ecology & Evolution, 16, 242-248.
DOI URL PMID |
| [3] | Cai LY, Xu YP, Jiang PP, Ding P, Yao XH, Xu XR, Wang GB ( 2007) Home range and daily moving distance of Elliot’s pheasant. Journal of Zhejiang University (Science Edition), 34, 679-683. (in Chinese with English abstract) |
| [ 蔡路昀, 徐言朋, 蒋萍萍, 丁平, 姚小华, 徐向荣, 王国兵 ( 2007) 白颈长尾雉的活动区和日活动距离. 浙江大学学报(理学版), 34, 679-683.] | |
| [4] | Chen JH, Huang XF, Lu CH, Yao XH, Yu ZP ( 2009) Spatial niches of Syrmaticus ellioti and Lophura nycthemera in autumn and winter. Chinese Journal of Ecology, 28, 2546-2552. (in Chinese with English abstract) |
| [ 陈俊豪, 黄晓凤, 鲁长虎, 姚小华, 余泽平 ( 2009) 白颈长尾雉与白鹇秋冬季空间生态位比较. 生态学杂志, 28, 2546-2552.] | |
| [5] |
Chen SW, Yu JP, Chen XN, Shen XL, Li S, Ma KP ( 2016) Camera-trapping survey on the diversity of mammal and pheasant species in Gutianshan National Nature Reserve, Zhejiang Province. Acta Theriologica Sinica, 36, 292-301. (in Chinese with English abstract)
DOI URL |
|
[ 陈声文, 余建平, 陈小南, 申小莉, 李晟, 马克平 ( 2016) 利用红外相机网络调查古田山自然保护区的兽类及雉类多样性. 兽类学报, 36, 292-301.]
DOI URL |
|
| [6] | Ding P ( 2015) Syrmaticus ellioti. In: Chinese Pheasants (ed. Zheng GM), pp. 261-296. Higher Education Press, Beijing. (in Chinese) |
| [ 丁平 ( 2015) 白颈长尾雉. 见: 中国雉类(郑光美主编), 261-296页. 高等教育出版社, 北京.] | |
| [7] |
Ding P, Li Z, Jiang SR, Zhuge Y ( 2002 a) Studies on the factors affecting patch use degree by Elliot’s pheasant. Journal of Zhejiang University (Science Edition), 29, 103-108. (in Chinese with English abstract)
DOI URL |
|
[ 丁平, 李智, 姜仕仁, 诸葛阳 ( 2002 a) 白颈长尾雉栖息地小区利用度影响因子研究. 浙江大学学报(理学版), 29, 103-108.]
DOI URL |
|
| [8] |
Ding P, Yang YW, Li Z, Jiang SR, Zhuge Y ( 2001) Vegetation characteristics of habitats used by Elliot’s pheasant. Journal of Zhejiang University (Science Edition), 28, 557-562. (in Chinese with English abstract)
DOI URL |
|
[ 丁平, 杨月伟, 李智, 姜仕仁, 诸葛阳 ( 2001) 白颈长尾雉栖息地的植被特征研究. 浙江大学学报(理学版), 28, 557-562.]
DOI URL |
|
| [9] |
Ding P, Yang YW, Li Z, Jiang SR, Zhuge Y ( 2002 b) Studies on the selection of roosting sites of Elliot’s pheasant. Journal of Zhejiang University (Science Edition), 29, 564-568. (in Chinese with English abstract)
DOI URL |
|
[ 丁平, 杨月伟, 李智, 姜仕仁, 诸葛阳 ( 2002 b) 白颈长尾雉夜宿地选择研究. 浙江大学学报(理学版), 29, 564-568.]
DOI URL |
|
| [10] | Ding P, Zhuge Y ( 1988) The study on breeding ecology of Syrmaticus ellioti Swinhoe. Acta Ecologica Sinica, 8, 44-50. (in Chinese with English abstract) |
| [ 丁平, 诸葛阳 ( 1988) 白颈长尾雉(Syrmaticus ellioti Swinhoe)的生态研究. 生态学报, 8, 44-50.] | |
| [11] | Ding P, Zhuge Y ( 1989 a) Syrmaticus ellioti. Chinese Journal of Zoology, 24(2), 39-42. (in Chinese) |
| [ 丁平, 诸葛阳 ( 1989 a) 白颈长尾雉. 动物学杂志, 24(2), 39-42.] | |
| [12] | Ding P, Zhuge Y ( 1989 b) The ecology of rare pheasants in the western areas of Zhejiang Province. Journal of Zhejiang University (Science Edition), 16, 302-309. (in Chinese with English abstract) |
| [ 丁平, 诸葛阳 ( 1989 b) 浙江西部山区珍稀雉类生态学研究. 浙江大学学报(理学版), 16, 302-309.] | |
| [13] |
Hu ZH, Yu MJ, Xu XH, Fu HL ( 2004) Castanopsis eyrei community characteristics in Gutianshan Natural Reserve, Zhejiang Province. Chinese Journal of Ecology, 23, 15-18. (in Chinese with English abstract)
DOI URL |
|
[ 胡正华, 于明坚, 徐学红, 付海龙 ( 2004) 浙江古田山自然保护区甜槠群落特征研究. 生态学杂志, 23, 15-18.]
DOI URL |
|
| [14] |
Jiang ZG, Jiang JP, Wang YZ, Zhang E, Zhang YY, Li LL, Xie F, Cai B, Cao L, Zheng GM, Dong L, Zhang ZW, Ding P, Luo ZH, Ding CQ, Ma ZJ, Tang SH, Cao WX, Li CW, Hu HJ, Ma Y, Wu Y, Wang YX, Zhou KY, Liu SY, Chen YY, Li JT, Feng ZJ, Wang Y, Wang B, Li C, Song XL, Cai L, Zang CX, Zeng Y, Meng ZB, Fang HX, Ping XG ( 2016) Red List of China’s Vertebrates. Biodiversity Science, 24, 500-551. (in Chinese and in English)
DOI URL |
|
[ 蒋志刚, 江建平, 王跃招, 张鹗, 张雁云, 李立立, 谢锋, 蔡波, 曹亮, 郑光美, 董路, 张正旺, 丁平, 罗振华, 丁长青, 马志军, 汤宋华, 曹文宣, 李春旺, 胡慧建, 马勇, 吴毅, 王应祥, 周开亚, 刘少英, 陈跃英, 李家堂, 冯祚建, 王燕, 王斌, 李成, 宋雪琳, 蔡蕾, 臧春鑫, 曾岩, 孟智斌, 方红霞, 平晓鸽 ( 2016) 中国脊椎动物红色名录. 生物多样性, 24, 500-551.]
DOI URL |
|
| [15] |
La Sorte FA, Jetz W ( 2010) Projected range contractions of montane biodiversity under global warming. Proceedings of the Royal Society of London B: Biological Sciences, 277, 3401-3410.
DOI URL PMID |
| [16] |
Laurance WF, Useche DC, Shoo LP, Herzog SK, Kessler M, Escobar F ( 2011) Global warming and the vulnerability of tropical biota: Where do the thermal specialists live? Biological Conservation, 144, 548-557.
DOI URL |
| [17] |
Li S, Mcshea WJ, Wang DJ, Shao LK, Shi XG ( 2010) The use of infrared-triggered cameras for surveying phasianids in Sichuan Province, China. Ibis, 152, 299-309.
DOI URL |
| [18] |
Liu F, Li DQ, Wu JG ( 2012) Using infra-red cameras to survey wildlife in Beijing Songshan National Nature Reserve. Acta Ecologica Sinica, 32, 730-739. (in Chinese with English abstract)
DOI URL |
|
[ 刘芳, 李迪强, 吴记贵 ( 2012) 利用红外相机调查北京松山国家级自然保护区的野生动物物种. 生态学报, 32, 730-739.]
DOI URL |
|
| [19] |
Liu P, Zhang WW ( 2017) Seasonal changes in habitat selection of Syrmaticus ellioti in Guanshan National Nature Reserve. Acta Ecologica Sinica, 37, 6005-6013. (in Chinese with English abstract)
DOI URL |
|
[ 刘鹏, 张微微 ( 2017) 官山自然保护区白颈长尾雉季节性生境选择. 生态学报, 37, 6005-6013.]
DOI URL |
|
| [20] |
Lu XL, Jiang ZG, Tang JR, Wang XJ, Xiang DQ, Zhang JP ( 2005) Auto-trigger camera traps for studying giant panda and its sympatric wildlife species. Acta Zoologica Sinica, 51, 495-500.
DOI URL |
| [21] |
McCain CM, Colwell RK ( 2011) Assessing the threat to montane biodiversity from discordant shifts in temperature and precipitation in a changing climate. Ecology Letters, 14, 1236-1245.
DOI URL |
| [22] |
Michalski F, Peres CA ( 2007) Disturbance-mediated mammal persistence and abundance-area relationships in Amazonian forest fragments. Conservation Biology, 21, 1626-1640.
DOI URL PMID |
| [23] | Morrison ML, Marcot BG, Mannan RW ( 1998) Wildlife- Habitat Relationships: Concepts and Applications, 2nd edn. The University of Wisconsin Press, Madison. |
| [24] |
O’Brien T, Kinnaird M ( 2008) A picture is worth a thousand words: The application of camera trapping to the study of birds. Bird Conservation International, 18, 144-162.
DOI URL |
| [25] |
Parmesan C ( 2006) Ecological and evolutionary responses to recent climate change. Annual Review of Ecology and Systematics, 37, 637-669.
DOI URL |
| [26] |
Parmesan C, Yohe G ( 2003) A globally coherent fingerprint of climate change impacts across natural systems. Nature, 421, 37-42.
DOI URL |
| [27] |
Peng YB, Ding P ( 2005) Factors affecting movement of spring dispersal of Elliot’s pheasants. Zoological Research, 26, 373-378. (in Chinese with English abstract)
DOI URL |
|
[ 彭岩波, 丁平 ( 2005) 白颈长尾雉春季扩散活动的影响因子. 动物学研究, 26, 373-378.]
DOI URL |
|
| [28] | R Development Core Team ( 2017) R: A Language and Environment for Statistical Computing. R Foundation for Statistical Computing, Vienna, Austria. |
| [29] |
Scott JM, Davis F, Csuti B, Noss R, Butterfield B, Groves C, Anderson H, Caicco S, Derchia F, Edwards TC, Ulliman J, Wright RG ( 1993) GAP analysis: A geographic approach to protection of biological diversity. Wildlife Monographs, 57, 1-41.
DOI URL |
| [30] |
Sekercioglu CH, Primack RB, Wormworth J ( 2012) The effects of climate change on tropical birds. Biological Conservation, 148, 1-18.
DOI URL |
| [31] |
Seo C, Thorne JH, Hannah L, Thuiller W ( 2009) Scale effects in species distribution models: Implications for conservation planning under climate change. Biology Letters, 5, 39-43.
DOI URL |
| [32] |
Sexton JP, McIntyre PJ, Angert AL, Rice KJ ( 2009) Evolution and ecology of species range limits. Annual Review of Ecology and Systematics, 40, 415-436.
DOI URL |
| [33] | Shi JB, Zheng GM ( 1997) The seasonal changes of habitats of Elliot’s pheasant. Zoological Research, 18, 275-283. (in Chinese with English abstract) |
| [ 石建斌, 郑光美 ( 1997) 白颈长尾雉栖息地的季节变化. 动物学研究, 18, 275-283.] | |
| [34] |
Tricia LC, Don ES ( 1999) Using remote photography in wildlife ecology: A review. Wildlife Society Bulletin, 27, 571-581.
DOI URL |
| [35] |
Walther GR, Post E, Convey P, Menzel A, Parmesan C, Beebee TJ, Fromentin JM, Hoegh-Guldberg O, Bairlein F ( 2002) Ecological responses to recent climate change. Nature, 416, 389-395.
DOI URL |
| [36] |
Wang HY, Zhang XY, Zou GH ( 2009) Frequentist model averaging estimation: A review. Journal of Systems Science & Complexity, 22, 732-748.
DOI URL |
| [37] |
Wiens JJ ( 2011) The niche, biogeography and species interactions. Philosophical Transactions of the Royal Society B: Biological Sciences, 366, 2336-2350.
DOI URL |
| [38] |
Xu YP, Zheng JW, Ding P, Jiang PP, Cai LY, Huang XF, Yao XH, Xu XR, Yu ZP ( 2007) Seasonal change in ranging of Elliot’s pheasant and its determining factors in Guanshan National Nature Reserve, Jiangxi. Biodiversity Science, 15, 337-343. (in Chinese with English abstract)
DOI URL |
|
[ 徐言朋, 郑家文, 丁平, 蒋萍萍, 蔡路昀, 黄晓风, 姚小华, 徐向荣, 余泽平 ( 2007) 官山白颈长尾雉活动区域海拔高度的季节变化及其影响因素. 生物多样性, 15, 337-343.]
DOI URL |
|
| [39] |
Yang SF, Mao YD ( 2008) Temperature change and four seasons division in Zhejiang Province in the last 50 years. Journal of Zhejiang Meteorology, 29(4), 1-6. (in Chinese)
DOI URL |
|
[ 杨诗芳, 毛裕定 ( 2008) 浙江省近50年气温变化及四季划分. 浙江气象, 29(4), 1-6.]
DOI URL |
|
| [40] |
Yang YW, Ding P, Jiang SR, Zhuge Y ( 1999) Factors affecting habitat used by Elliot’s pheasant (Syrmaticus ellioti) in mixed coniferous and broadleaf forests. Acta Zoologica Sinica, 45, 279-286. (in Chinese with English abstract)
DOI URL |
|
[ 杨月伟, 丁平, 姜仕仁, 诸葛阳 ( 1999) 针阔混交林内白颈长尾雉栖息地利用的影响因子研究. 动物学报, 45, 279-286.]
DOI URL |
|
| [41] |
Yasuda M ( 2004) Monitoring diversity and abundance of mammals with camera traps: A case study on mount Tsukuba, central Japan. Mammal Study, 29, 37-46.
DOI URL |
| [42] |
Yu MJ, Hu ZH, Yu JP, Ding BY, Fang T ( 2001) Forest vegetation types in Gutianshan Natural Reserve in Zhejiang. Journal of Zhejiang University (Agriculture and Life Sciences), 27, 375-380. (in Chinese with English abstract)
DOI URL |
|
[ 于明坚, 胡正华, 余建平, 丁炳扬, 方腾 ( 2001) 浙江古田山自然保护区森林植被类型. 浙江大学学报(农业与生命科学版), 27, 375-380.]
DOI URL |
|
| [43] |
Yu ZY, Wu LH, Gao DW, Fan GF ( 2014) Investigation of methods for season division in Zhejiang Province. Meteorological Science and Technology, 42, 474-481. (in Chinese with English abstract)
DOI URL |
|
[ 郁珍艳, 吴利红, 高大伟, 樊高峰 ( 2014) 浙江省四季划分方法探讨. 气象科技, 42, 474-481.]
DOI URL |
|
| [44] |
Zhao YZ, Wang ZC, Xu JL, Luo X, An LD ( 2013) Activity rhythm and behavioral time budgets of wild Reeves’s pheasant (Syrmaticus reevesii) using infrared camera. Acta Ecologica Sinica, 33, 6021-6027. (in Chinese with English abstract)
DOI URL |
|
[ 赵玉泽, 王志臣, 徐基良, 罗旭, 安丽丹 ( 2013) 利用红外照相技术分析野生白冠长尾雉活动节律及时间分配. 生态学报, 33, 6021-6027.]
DOI URL |
| [1] | 顾婧婧, 刘宜卓, 苏杨. 基层地方政府在完成《昆蒙框架》中的作用和难点: 基于《联合国气候变化框架公约》任务的比较[J]. 生物多样性, 2025, 33(3): 24585-. |
| [2] | 陈丁松, 刘子恺, 贺子洋, 陈伟东. 缓步动物多样性、分布特征和生态功能研究进展[J]. 生物多样性, 2025, 33(2): 24406-. |
| [3] | 张颂琪, 陆义, 陈炳耀, 杨光, 王彦平, 陈传武. 全球鲸豚类形态、生活史和生态学特征数据集[J]. 生物多样性, 2025, 33(2): 24442-. |
| [4] | 卢佳玉, 石小亿, 多立安, 王天明, 李治霖. 基于红外相机技术的天津城市地栖哺乳动物昼夜活动节律评价[J]. 生物多样性, 2024, 32(8): 23369-. |
| [5] | 吴琪, 张晓青, 杨雨婷, 周艺博, 马毅, 许大明, 斯幸峰, 王健. 浙江钱江源-百山祖国家公园庆元片区叶附生苔多样性及其时空变化[J]. 生物多样性, 2024, 32(4): 24010-. |
| [6] | 曹可欣, 王敬雯, 郑国, 武鹏峰, 李英滨, 崔淑艳. 降水格局改变及氮沉降对北方典型草原土壤线虫多样性的影响[J]. 生物多样性, 2024, 32(3): 23491-. |
| [7] | 杜聪聪, 冯学宇, 陈志林. 桥头堡效应中气候生态位差异的缩小促进了红火蚁的入侵[J]. 生物多样性, 2024, 32(11): 24276-. |
| [8] | 原雪姣, 张渊媛, 张衍亮, 胡璐祎, 桑卫国, 杨峥, 陈颀. 基于飞机草历史分布数据拟合的物种分布模型及其预测能力[J]. 生物多样性, 2024, 32(11): 24288-. |
| [9] | 冯莉. 国际法视野下生物多样性和气候变化的协同治理[J]. 生物多样性, 2023, 31(7): 23110-. |
| [10] | 楼晨阳, 任海保, 陈小南, 米湘成, 童冉, 朱念福, 陈磊, 吴统贵, 申小莉. 钱江源国家公园森林群落的物种多样性、结构多样性及其对黑麂出现概率的影响[J]. 生物多样性, 2023, 31(6): 22518-. |
| [11] | 赵坤明, 陈圣宾, 杨锡福. 基于红外相机技术调查四川都江堰破碎化森林鸟兽多样性及优势种活动节律[J]. 生物多样性, 2023, 31(6): 22529-. |
| [12] | 魏庐潞, 徐婷婷, 李媛媛, 艾喆, 马飞. 同质园环境和遗传分化影响锦鸡儿属植物根际土壤固氮菌多样性和群落结构[J]. 生物多样性, 2023, 31(4): 22477-. |
| [13] | 姚雪, 陈星, 戴尊, 宋坤, 邢诗晨, 曹宏彧, 邹璐, 王健. 采集策略对叶附生苔类植物发现概率及物种多样性的重要性[J]. 生物多样性, 2023, 31(4): 22685-. |
| [14] | 邵雯雯, 范国祯, 何知舟, 宋志平. 多地同质园实验揭示普通野生稻的表型可塑性与本地适应性[J]. 生物多样性, 2023, 31(3): 22311-. |
| [15] | 桑佳文, 宋创业, 贾宁霞, 贾元, 刘长成, 乔鲜果, 张琳, 袁伟影, 吴冬秀, 李凌浩, 郭柯. 青藏高原植被调查与制图评估[J]. 生物多样性, 2023, 31(3): 22430-. |
| 阅读次数 | ||||||
|
全文 |
|
|||||
|
摘要 |
|
|||||
备案号:京ICP备16067583号-7
Copyright © 2026 版权所有 《生物多样性》编辑部
地址: 北京香山南辛村20号, 邮编:100093
电话: 010-62836137, 62836665 E-mail: biodiversity@ibcas.ac.cn
![]()