
生物多样性 ›› 2026, Vol. 34 ›› Issue (4): 25276. DOI: 10.17520/biods.2025276 cstr: 32101.14.biods.2025276
李劲1,2( ), 程铭昊1,2, 张溢1,2, 刘峰3, 姜庆虎3, 叶基荣4, 陈展1, 张于光1,2,*(
 )
)
收稿日期:2025-07-16
接受日期:2025-11-27
出版日期:2026-04-20
发布日期:2026-05-28
通讯作者:
*E-mail: yugzhang@sina.com.cn
基金资助:
Jin Li1,2(), Minghao Cheng1,2, Yi Zhang1,2, Feng Liu3, Qinghu Jiang3, Jirong Ye4, Zhan Chen1, Yuguang Zhang1,2,*()
Received:2025-07-16
Accepted:2025-11-27
Online:2026-04-20
Published:2026-05-28
Contact:
*E-mail: yugzhang@sina.com.cn
Supported by:摘要:
土壤微生物是森林生态系统的重要组成部分, 在维系生态系统物质循环与能量流动等过程中发挥着关键作用。本研究以神农架国家公园候选区巴山冷杉(Abies fargesii)林为对象, 旨在揭示土壤微生物群落沿海拔梯度的变化规律及其驱动机制, 并解析植物-微生物跨界生态网络(inter-kingdom ecological networks, IDENs)特征。采用高通量测序, 并构建IDENs, 综合分析不同海拔巴山冷杉林土壤微生物多样性、群落结构及其与植物群落的关联。结果表明, 随海拔升高, 土壤全氮、土壤有机碳和年均降水量(mean annual precipitation, MAP)显著增加, 而土壤全磷、速效钾、植物物种丰富度以及植物Shannon指数显著降低(P<0.05); 细菌Shannon指数与丰富度指数随海拔升高显著下降(P<0.05), 真菌多样性无显著差异; 细菌优势菌门中, 仅酸杆菌门及其优势属(酸杆菌门亚群Gp2、Gp1和Gp3)相对丰度随海拔升高显著增加(P<0.05); 真菌优势菌门随海拔变化无显著差异, 但属水平红菇属(Russula)相对丰度显著升高、丝盖伞属(Inocybe)显著下降(P<0.05); 偏Mantel分析表明, 年均气温(mean annual temperature, MAT)与MAP是驱动土壤微生物群落变化的主要因子; 典范对应分析(canonical correspondence analysis, CCA)进一步显示, MAP与植物多样性对细菌和真菌群落结构影响最显著。IDENs子网络指标显示, 模块度、连通性和嵌套性随海拔升高显著上升(P<0.05), 高山杜鹃(Rhododendron lapponicum)和四蕊槭(Acer stachyophyllum subsp. betulifolium)等植物是模块枢纽的主要组成部分, 巴山冷杉在植物-真菌IDENs中占据网络枢纽的重要地位。本研究揭示了不同海拔巴山冷杉林土壤微生物群落结构及其主要影响因素, 识别了植物-微生物IDENs的关键特征, 可为理解森林生态系统中植物-微生物互作关系提供科学参考。
李劲, 程铭昊, 张溢, 刘峰, 姜庆虎, 叶基荣, 陈展, 张于光 (2026) 不同海拔巴山冷杉林土壤微生物多样性及植物-微生物跨界生态网络关系. 生物多样性, 34, 25276. DOI: 10.17520/biods.2025276.
Jin Li, Minghao Cheng, Yi Zhang, Feng Liu, Qinghu Jiang, Jirong Ye, Zhan Chen, Yuguang Zhang (2026) Soil microbial diversity and plant-microbe inter-kingdom ecological networks across an elevational gradient in Abies fargesii forests. Biodiversity Science, 34, 25276. DOI: 10.17520/biods.2025276.
| 环境因子 Environmental factor | 均值±标准差 Mean±SD | Slope | R² | P |
|---|---|---|---|---|
| 土壤pH Soil pH | 5.81±0.40 | 0.000 | 0.001 | 0.903 |
| 土壤全氮 Soil total nitrogen (g/kg) | 4.65±0.77 | 0.001 | 0.282 | 0.007 |
| 土壤全磷 Soil total phosphorus (g/kg) | 0.99±0.23 | -0.001 | 0.526 | < 0.001 |
| 土壤全钾 Soil total potassium (g/kg) | 17.74±2.85 | -0.006 | 0.396 | 0.001 |
| 土壤速效钾 Soil available potassium (mg/kg) | 140.63±33.58 | 0.010 | 0.009 | 0.662 |
| 土壤速效磷 Soil available phosphorus (mg/kg) | 5.07±2.60 | -0.004 | 0.168 | 0.047 |
| 土壤有机碳 Soil organic carbon (g/kg) | 45.63±13.13 | 0.031 | 0.526 | < 0.001 |
| 植物物种丰富度 Plant species richness | 10.67±7.17 | -0.022 | 0.825 | < 0.001 |
| 植物Shannon指数 Plant Shannon index | 1.47±0.75 | -0.002 | 0.663 | < 0.001 |
| 年均温度 Mean annual temperature (℃) | 5.14±1.11 | -0.004 | 0.963 | < 0.001 |
| 年均降水量 Mean annual precipitation (mm) | 1,345.71±31.75 | 0.102 | 0.947 | < 0.001 |
表1 各环境因子指标的均值及其与海拔的回归分析结果。以海拔为自变量、各环境因子为因变量进行一元线性回归分析。Slope表示回归斜率, 即海拔每升高1 m时环境因子的变化量。正斜率表示该指标随海拔升高而增加, 负斜率表示该指标随海拔升高而降低。R2表示决定系数; P表示回归显著性水平。
Table 1 Mean values of environmental factors and simple linear regression results for their relationships with elevation. Simple linear regressions were performed using elevation as the independent variable and each environmental factor as the dependent variable. Slope represents the regression coefficient, indicating the change in each environmental factor per 1 m increase in elevation. Positive and negative slope values indicate increasing and decreasing trends with elevation, respectively. R² represents the coefficient of determination; P represents the significance level of the regression.
| 环境因子 Environmental factor | 均值±标准差 Mean±SD | Slope | R² | P |
|---|---|---|---|---|
| 土壤pH Soil pH | 5.81±0.40 | 0.000 | 0.001 | 0.903 |
| 土壤全氮 Soil total nitrogen (g/kg) | 4.65±0.77 | 0.001 | 0.282 | 0.007 |
| 土壤全磷 Soil total phosphorus (g/kg) | 0.99±0.23 | -0.001 | 0.526 | < 0.001 |
| 土壤全钾 Soil total potassium (g/kg) | 17.74±2.85 | -0.006 | 0.396 | 0.001 |
| 土壤速效钾 Soil available potassium (mg/kg) | 140.63±33.58 | 0.010 | 0.009 | 0.662 |
| 土壤速效磷 Soil available phosphorus (mg/kg) | 5.07±2.60 | -0.004 | 0.168 | 0.047 |
| 土壤有机碳 Soil organic carbon (g/kg) | 45.63±13.13 | 0.031 | 0.526 | < 0.001 |
| 植物物种丰富度 Plant species richness | 10.67±7.17 | -0.022 | 0.825 | < 0.001 |
| 植物Shannon指数 Plant Shannon index | 1.47±0.75 | -0.002 | 0.663 | < 0.001 |
| 年均温度 Mean annual temperature (℃) | 5.14±1.11 | -0.004 | 0.963 | < 0.001 |
| 年均降水量 Mean annual precipitation (mm) | 1,345.71±31.75 | 0.102 | 0.947 | < 0.001 |
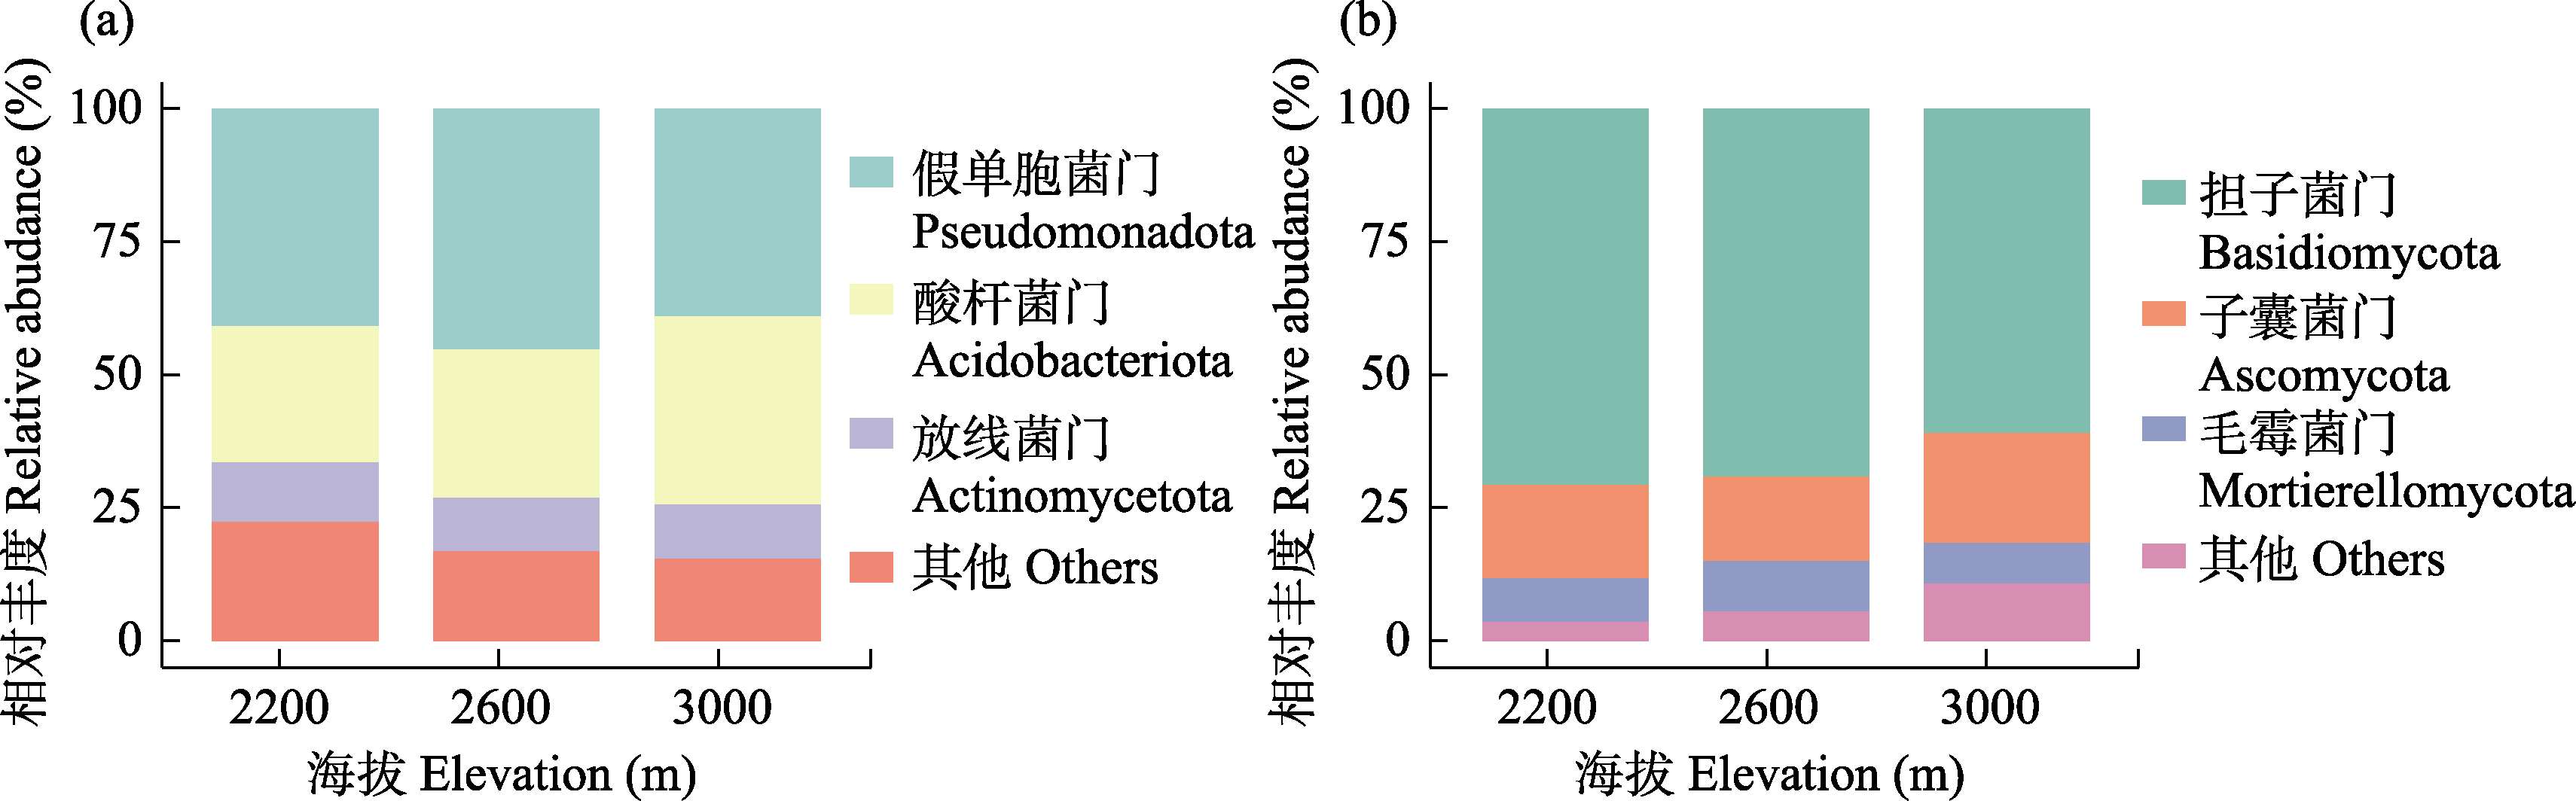
图1 不同海拔梯度下土壤细菌(a)和真菌(b)门水平相对丰度
Fig. 1 Phylum-level relative abundance of soil bacteria (a) and fungi (b) along the elevational gradient
| 界 Kingdom | 门 Phylum | 相对丰度 Relative abundance (%) | Slope | R² | P |
|---|---|---|---|---|---|
| 细菌 Bacteria | 假单胞菌门 Pseudomonadota | 41.73±5.87 | -0.278 | 0.021 | 0.501 |
| 酸杆菌门 Acidobacteriota | 29.61±7.95 | 1.574 | 0.361 | 0.001 | |
| 放线菌门 Actinomycetota | 10.49±2.60 | -0.259 | 0.092 | 0.150 | |
| 真菌 Fungi | 子囊菌门 Ascomycota | 17.98±8.91 | 0.403 | 0.019 | 0.522 |
| 担子菌门 Basidiomycota | 67.01±12.61 | -0.972 | 0.055 | 0.271 | |
| 毛霉菌门 Mortierellomycota | 8.41±3.55 | -0.253 | 0.047 | 0.309 |
表2 土壤微生物优势门相对丰度(平均值±标准差)与海拔的回归分析结果。以海拔为自变量、各优势微生物门相对丰度为因变量进行一元线性回归分析。相对丰度以百分比表示。Slope表示海拔每升高100 m时优势微生物门相对丰度百分比的变化量。正斜率表示该菌门相对丰度随海拔升高而增加, 负斜率表示其随海拔升高而降低。R2表示决定系数; P表示回归显著性水平。
Table 2 Regression analysis results for the relative abundance (mean±SD) of dominant soil microbial phyla and elevation. Simple linear regressions were performed using elevation as the independent variable and the relative abundance of each dominant microbial phylum as the dependent variable. Relative abundance is expressed as a percentage. Slope represents the change in relative abundance percentage per 100 m increase in elevation. Positive and negative slope values indicate increasing and decreasing trends with elevation, respectively. R² represents the coefficient of determination, and P represents the significance level of the regression.
| 界 Kingdom | 门 Phylum | 相对丰度 Relative abundance (%) | Slope | R² | P |
|---|---|---|---|---|---|
| 细菌 Bacteria | 假单胞菌门 Pseudomonadota | 41.73±5.87 | -0.278 | 0.021 | 0.501 |
| 酸杆菌门 Acidobacteriota | 29.61±7.95 | 1.574 | 0.361 | 0.001 | |
| 放线菌门 Actinomycetota | 10.49±2.60 | -0.259 | 0.092 | 0.150 | |
| 真菌 Fungi | 子囊菌门 Ascomycota | 17.98±8.91 | 0.403 | 0.019 | 0.522 |
| 担子菌门 Basidiomycota | 67.01±12.61 | -0.972 | 0.055 | 0.271 | |
| 毛霉菌门 Mortierellomycota | 8.41±3.55 | -0.253 | 0.047 | 0.309 |
| 界 Kingdom | 属 Genus | 相对丰度 Relative abundance (%) | Slope | R2 | P |
|---|---|---|---|---|---|
| 细菌 Bacteria | 未分类 Unclassified | 36.91±4.99 | -1.243 | 0.571 | < 0.001 |
| Gp2 | 11.90±5.17 | 0.722 | 0.18 | 0.039 | |
| Gp1 | 6.45±2.25 | 0.408 | 0.301 | 0.006 | |
| Gp3 | 5.39±1.44 | 0.347 | 0.533 | < 0.001 | |
| 缓生根瘤菌属 Bradyrhizobium | 4.41±1.12 | 0.035 | 0.009 | 0.657 | |
| 真菌 Fungi | 未分类 Unclassified | 19.85±10.92 | -0.213 | 0.000 | 0.583 |
| 红菇属 Russula | 15.36±14.44 | 1.164 | 0.239 | 0.015 | |
| 丝盖伞属 Inocybe | 9.45±9.88 | -0.773 | 0.226 | 0.019 | |
| 被孢霉属 Mortierella | 8.34±3.52 | -0.132 | 0.000 | 0.287 | |
| 蜡壳菌属 Sebacina | 7.69±5.68 | 0.059 | 0.002 | 0.770 | |
| Piloderma | 4.41±7.91 | -0.228 | 0.000 | 0.413 |
表3 土壤微生物优势属相对丰度(平均值±标准差)与海拔关系的回归分析结果。相对丰度以百分比表示。Slope表示海拔每升高100 m时优势微生物门相对丰度百分比的变化量。正斜率表示该菌门相对丰度随海拔升高而增加, 负斜率表示其随海拔升高而降低。R2表示决定系数; P表示回归显著性水平。
Table 3 Regression analysis results for the relationships between the relative abundance (mean±SD) of dominant soil microbial genera and elevation. Slope represents the change in relative abundance percentage per 100 m increase in elevation. Positive and negative slope values indicate increasing and decreasing trends with elevation, respectively. R² represents the coefficient of determination, and P represents the significance level of the regression.
| 界 Kingdom | 属 Genus | 相对丰度 Relative abundance (%) | Slope | R2 | P |
|---|---|---|---|---|---|
| 细菌 Bacteria | 未分类 Unclassified | 36.91±4.99 | -1.243 | 0.571 | < 0.001 |
| Gp2 | 11.90±5.17 | 0.722 | 0.18 | 0.039 | |
| Gp1 | 6.45±2.25 | 0.408 | 0.301 | 0.006 | |
| Gp3 | 5.39±1.44 | 0.347 | 0.533 | < 0.001 | |
| 缓生根瘤菌属 Bradyrhizobium | 4.41±1.12 | 0.035 | 0.009 | 0.657 | |
| 真菌 Fungi | 未分类 Unclassified | 19.85±10.92 | -0.213 | 0.000 | 0.583 |
| 红菇属 Russula | 15.36±14.44 | 1.164 | 0.239 | 0.015 | |
| 丝盖伞属 Inocybe | 9.45±9.88 | -0.773 | 0.226 | 0.019 | |
| 被孢霉属 Mortierella | 8.34±3.52 | -0.132 | 0.000 | 0.287 | |
| 蜡壳菌属 Sebacina | 7.69±5.68 | 0.059 | 0.002 | 0.770 | |
| Piloderma | 4.41±7.91 | -0.228 | 0.000 | 0.413 |
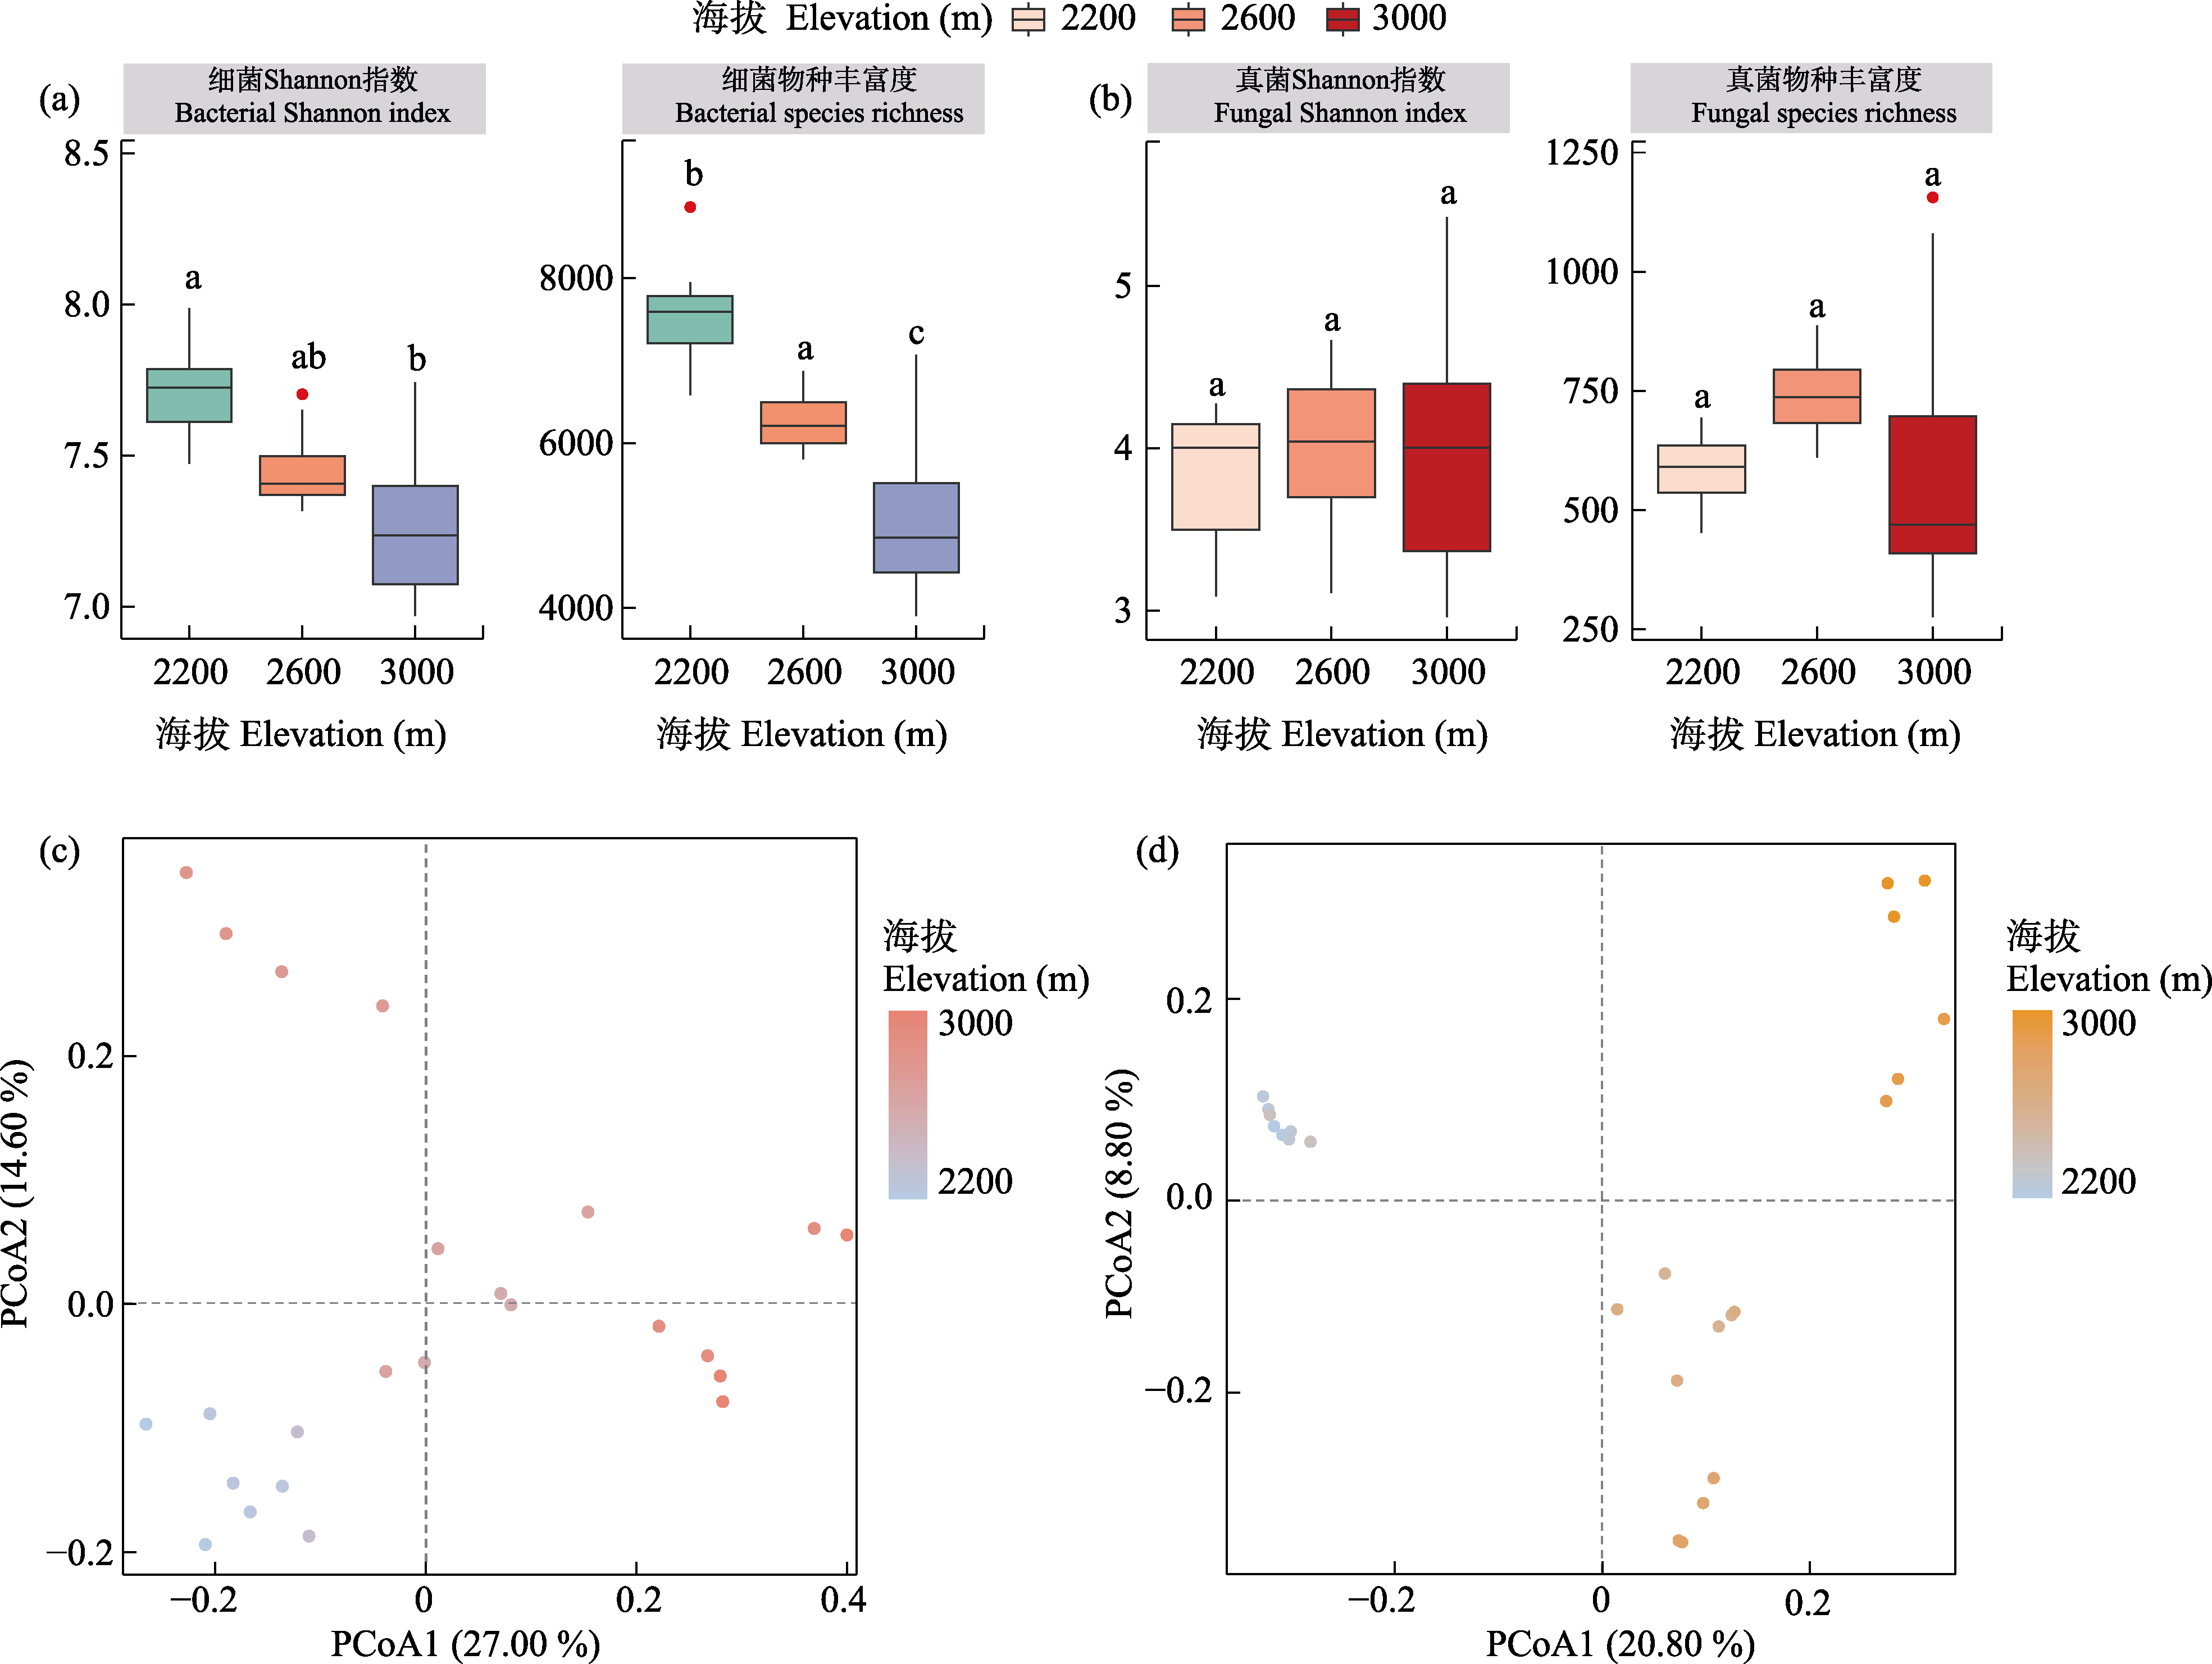
图2 海拔梯度下土壤微生物α多样性指数箱线图及主坐标分析(PCoA)。(a)细菌α多样性箱线图; (b)真菌α多样性箱线图; (c)细菌群落PCoA; (d)真菌群落PCoA。箱线图中不同小写字母表示经单因素方差分析(ANOVA)及Tukey诚实显著性差异(HSD)事后多重比较检验后, 不同海拔组间差异显著(P<0.05); 相同或含有相同字母者表示差异不显著。
Fig. 2 Box plots of α diversity indices and principal coordinate analysis (PCoA) of soil microbial communities along the elevational gradient. (a) Box plots of bacterial α diversity indices; (b) Box plots of fungal α diversity indices; (c) PCoA of bacterial communities; and (d) PCoA of fungal communities. In the box plots, different lowercase letters indicate significant differences among elevational groups based on one-way analysis of variance (ANOVA) followed by Tukey’s honestly significant difference (HSD) post hoc multiple comparison test (P<0.05), whereas identical or shared letters indicate no significant difference.
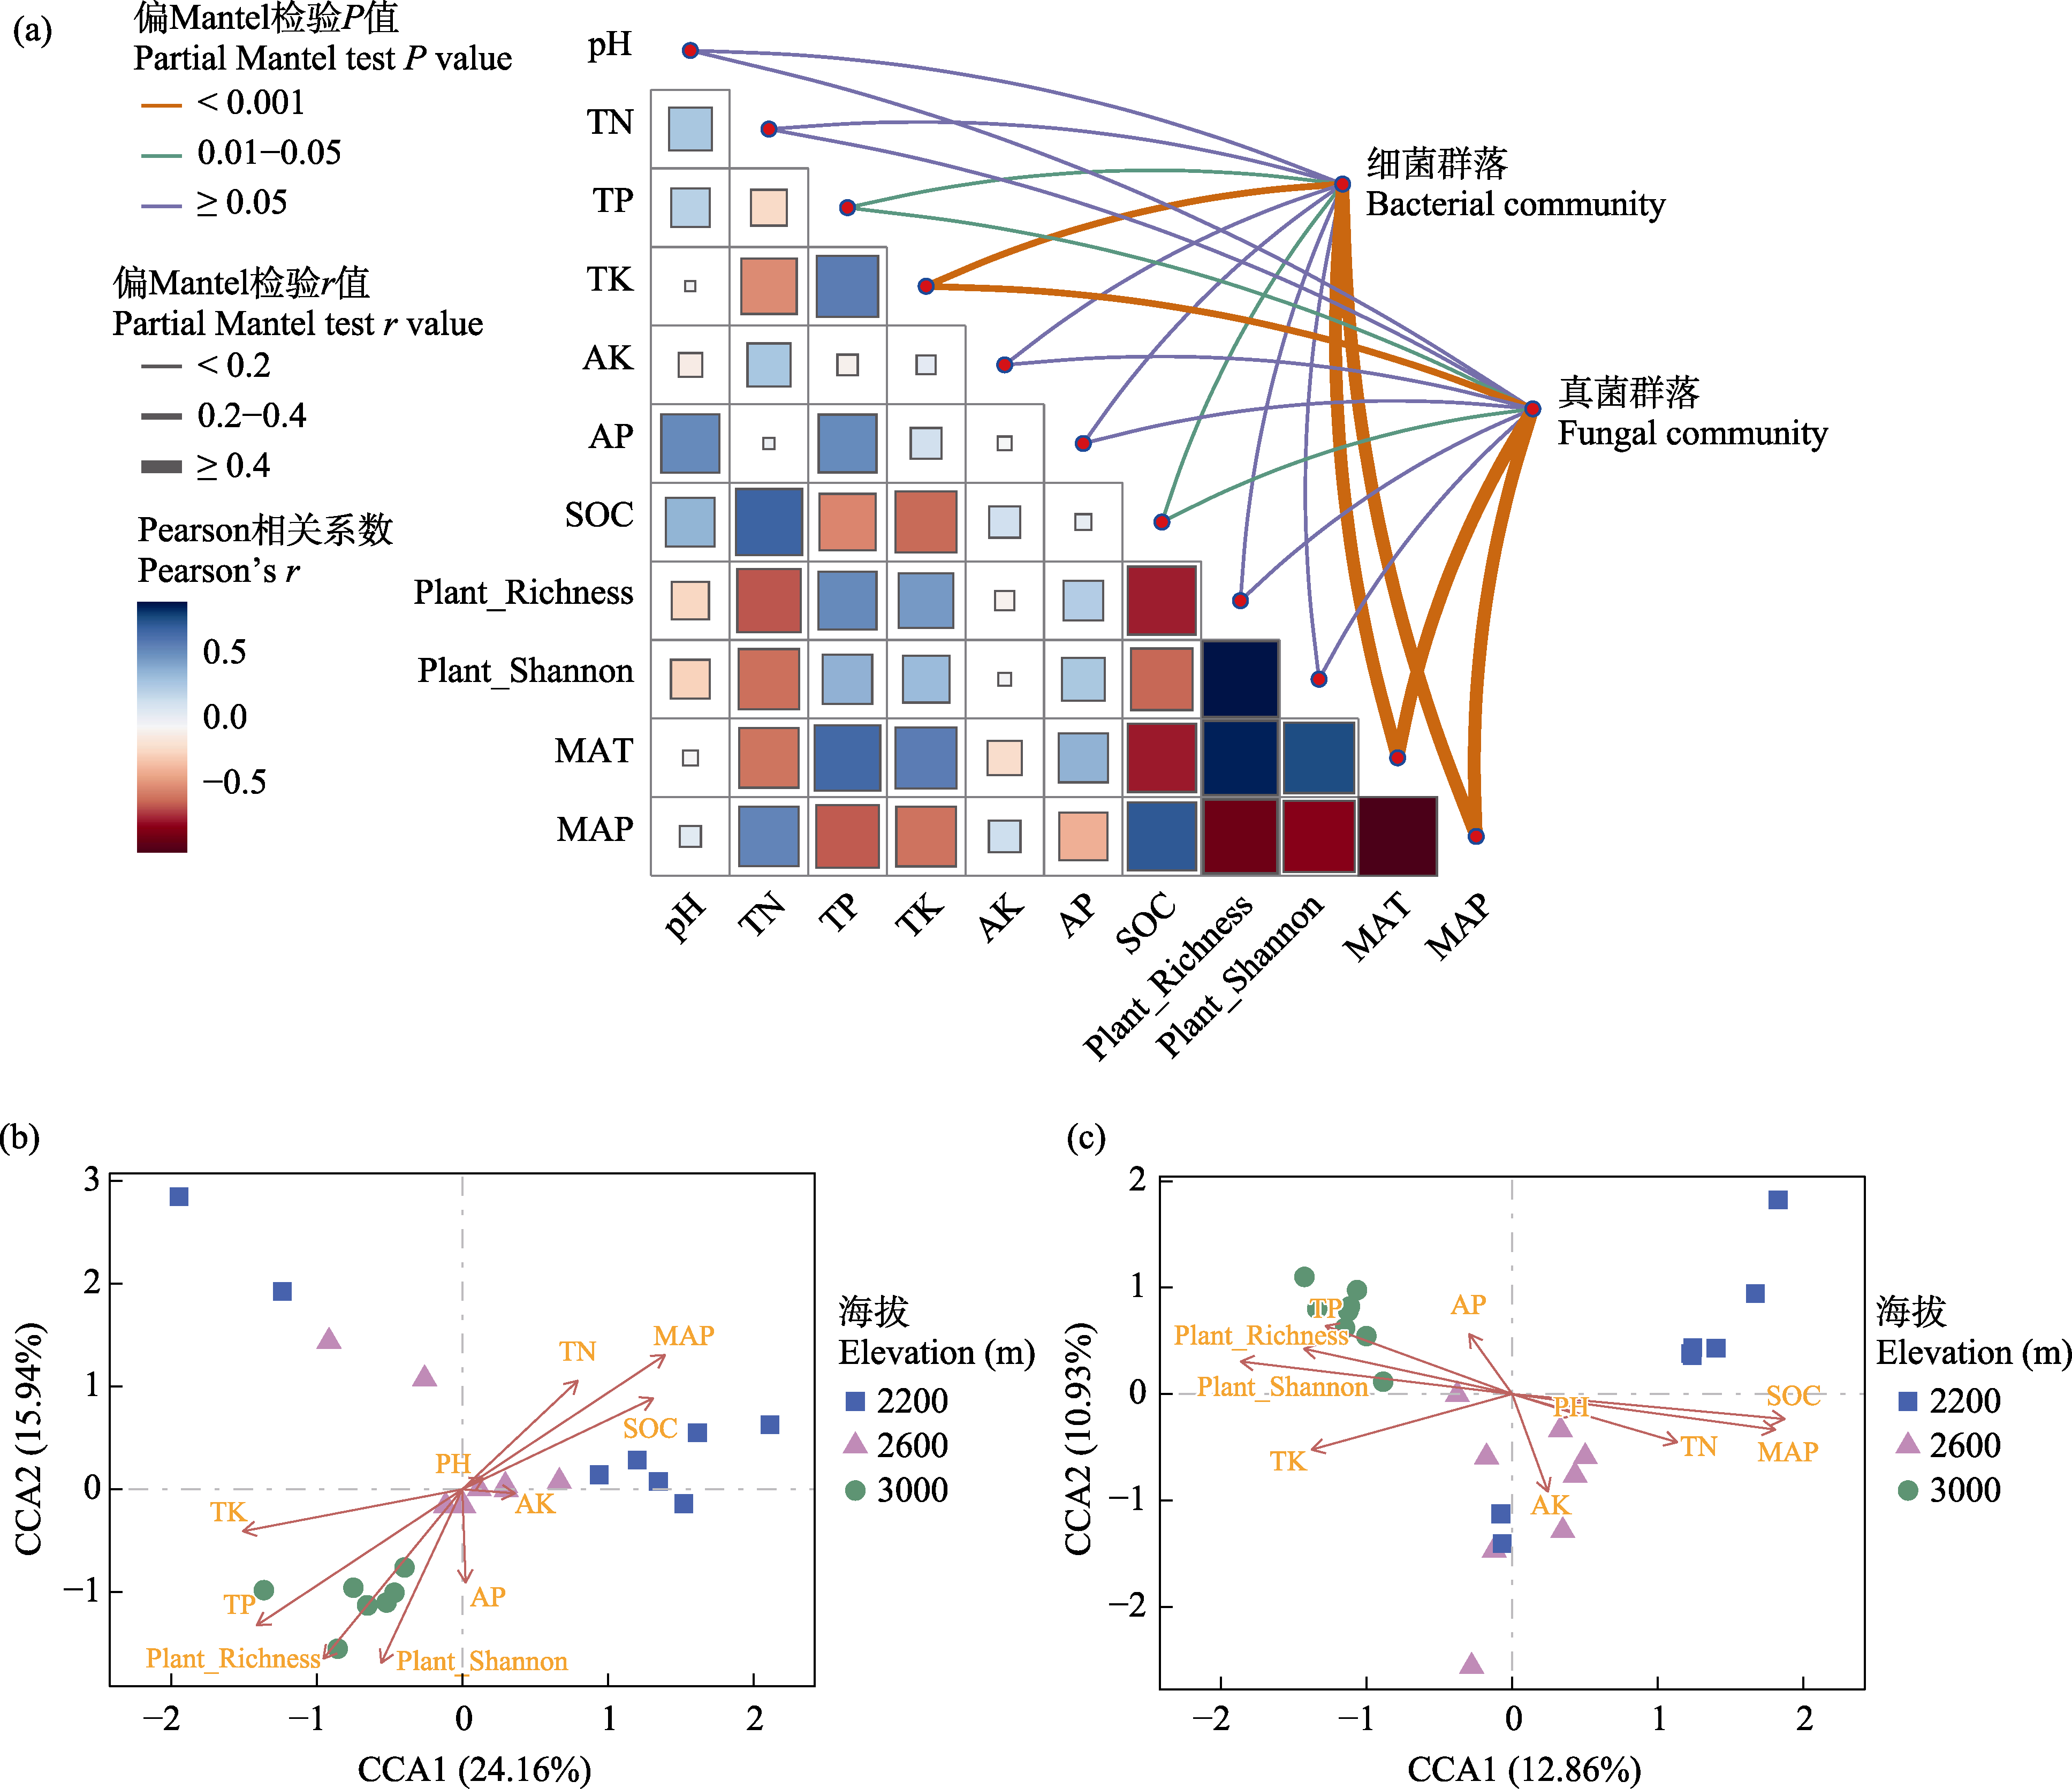
图3 不同环境因子与土壤微生物群落结构的相关关系分析。(a)微生物群落与环境因子的偏Mantel分析; (b)细菌群落与环境因子的典范对应分析(CCA); (c)真菌群落与环境因子的CCA。pH: 土壤pH; TN: 全氮; TP: 全磷; TK: 全钾; AK: 速效钾; AP: 速效磷; SOC: 土壤有机碳; MAT: 年均气温; MAP: 年均降水量; Plant_Richness: 植物物种丰富度; Plant_Shannon: 植物Shannon指数。
Fig. 3 Correlation analysis between environmental factors and soil microbial community structure. (a) Partial Mantel test between microbial communities and environmental factors; (b) Canonical correspondence analysis (CCA) of bacterial communities constrained by environmental factors; (c) CCA of fungal communities constrained by environmental factors. pH, Soil pH; TN, Total nitrogen; TP, Total phosphorus; TK, Total potassium; AK, Available potassium; AP, Available phosphorus; SOC, Soil organic carbon; MAT, Mean annual temperature; MAP, Mean annual precipitation; Plant_Richness, Plant species richness; Plant_Shannon, Plant Shannon index.
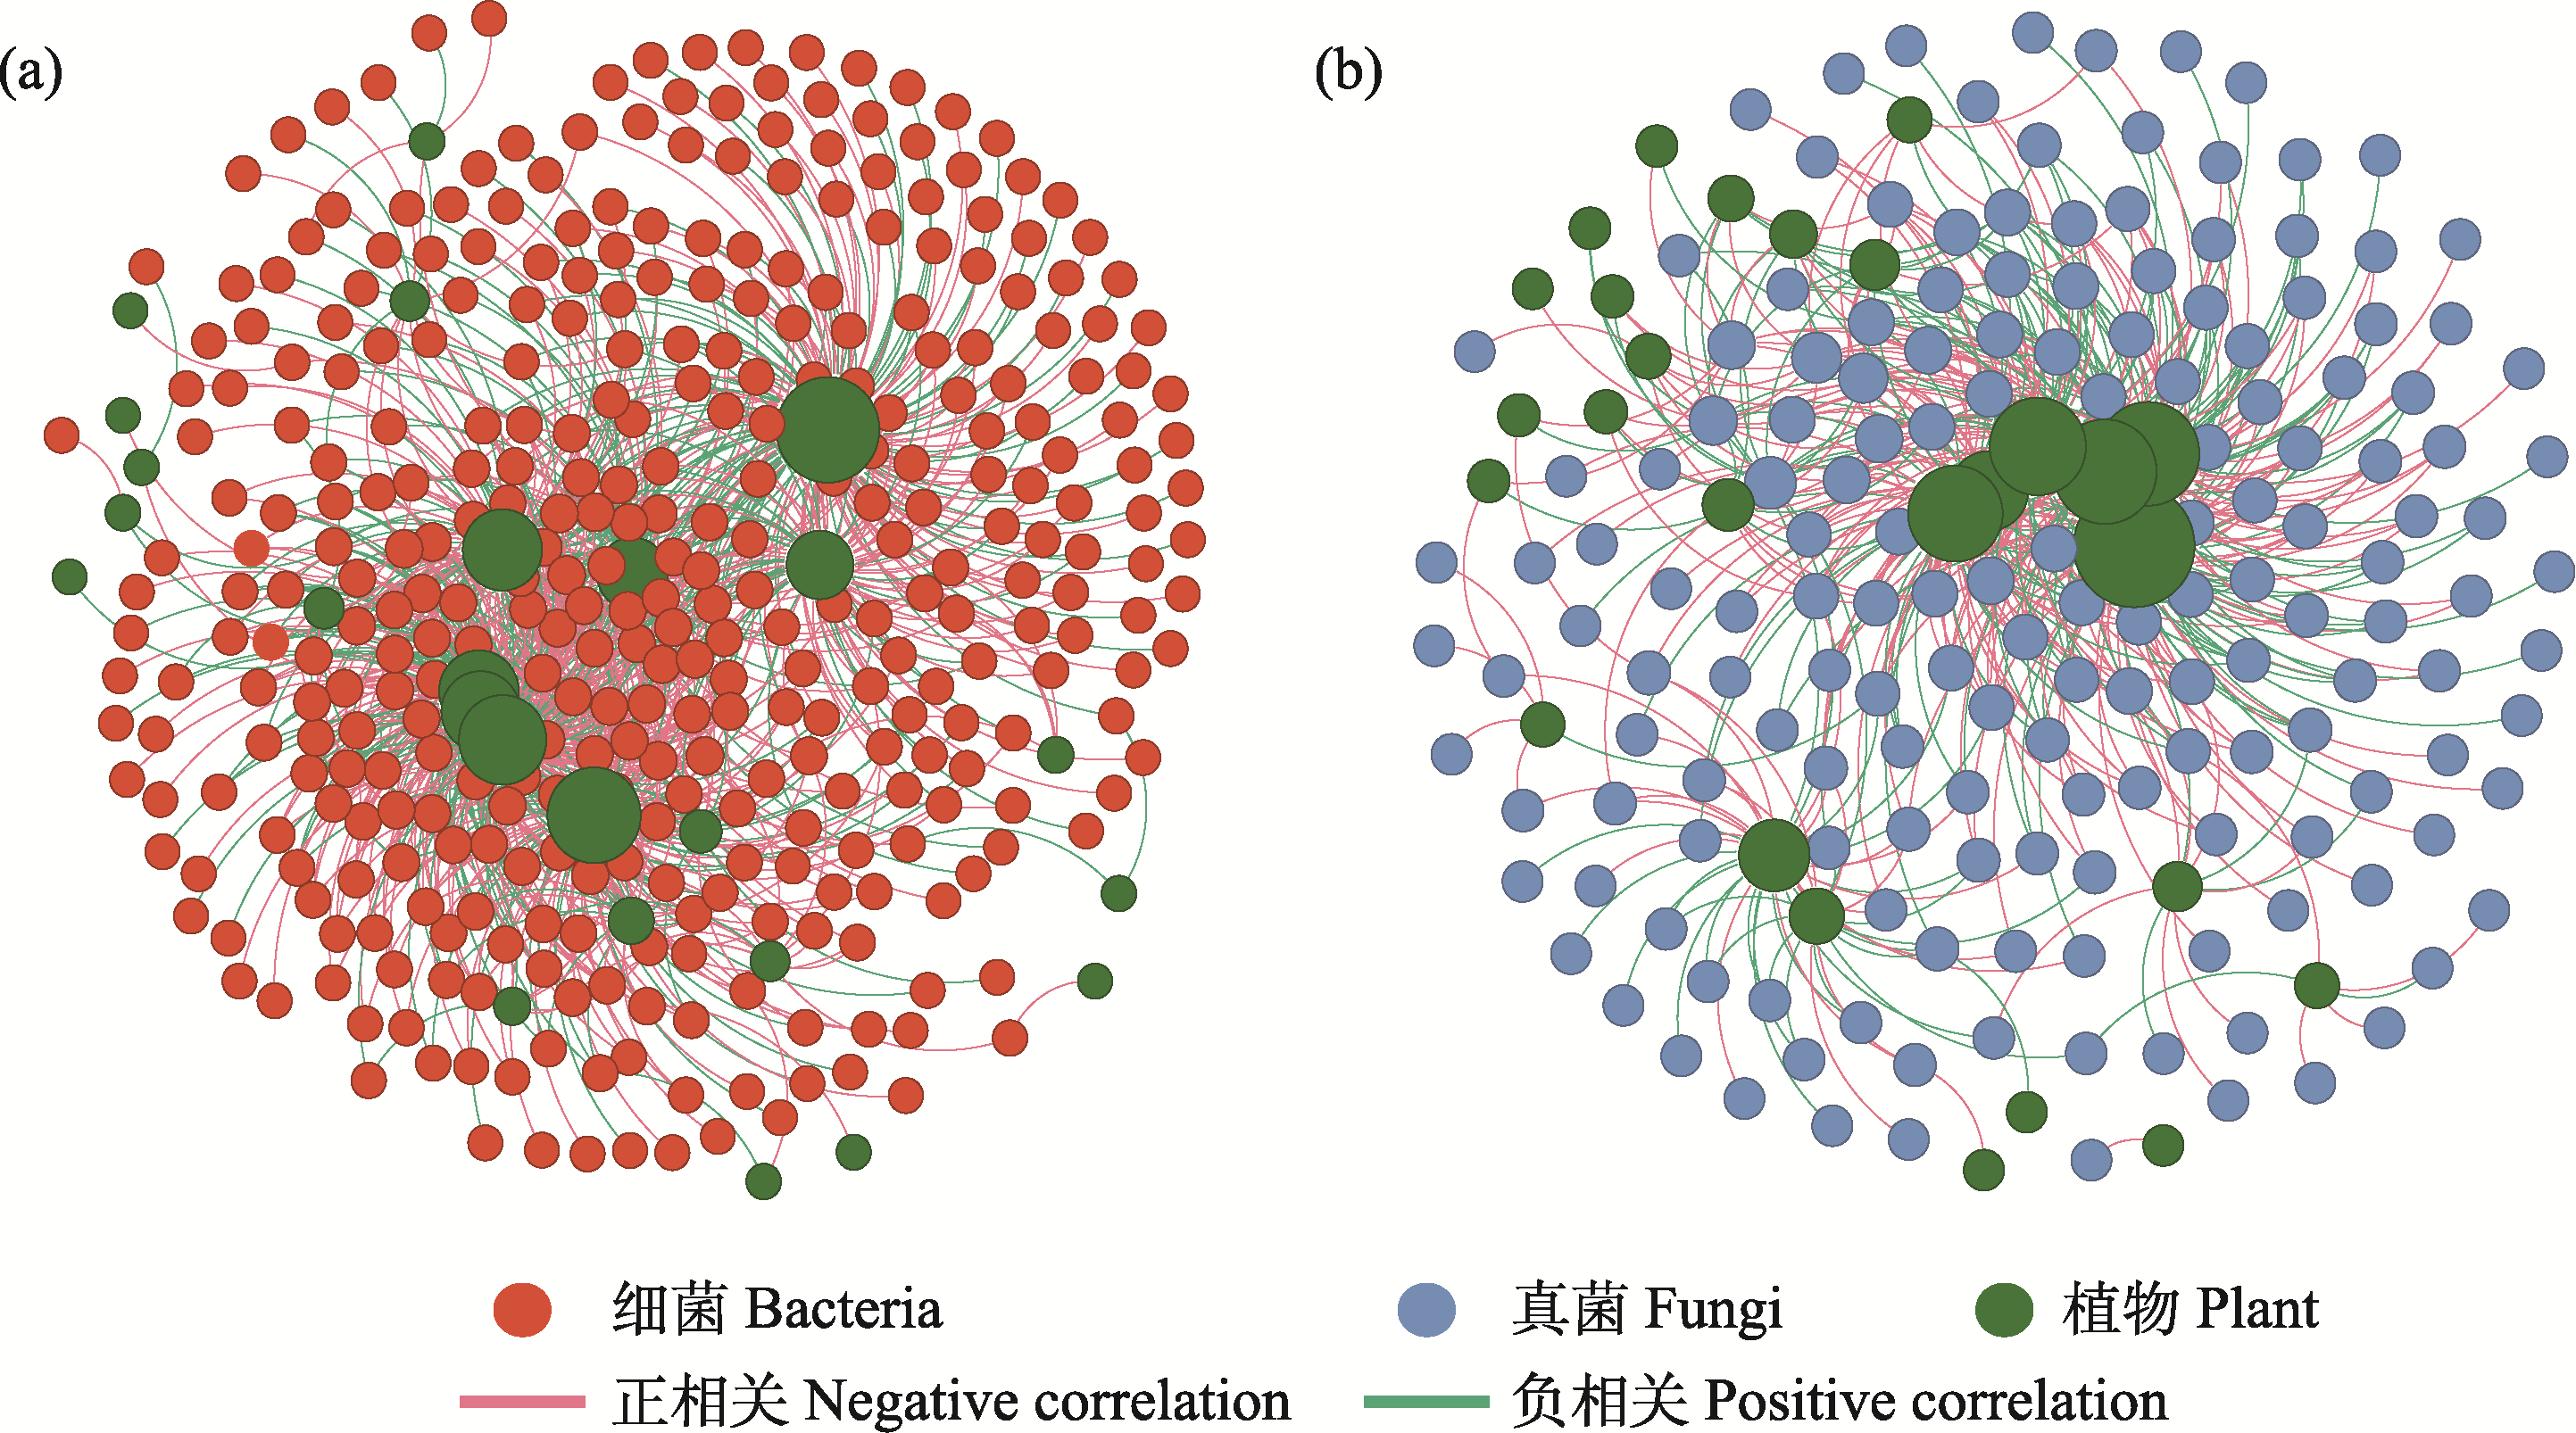
图4 植物与土壤微生物跨界生态网络。(a)植物-土壤细菌跨界生态网络; (b)植物-土壤真菌跨界生态网络。圆圈表示网络节点, 线条表示边; 不同颜色的圆圈表示不同类群, 圆圈大小表示节点度的大小; 红色边表示正相关, 绿色边表示负相关。
Fig. 4 Plant-soil microorganism inter-kingdom ecological networks. (a) Plant-bacterial inter-kingdom ecological network; (b) Plant-fungal inter-kingdom ecological network. Circles represent network nodes, and lines represent edges; circles of different colors indicate different groups, and circle size indicates node degree; red edges indicate positive correlations, whereas green edges indicate negative correlations.
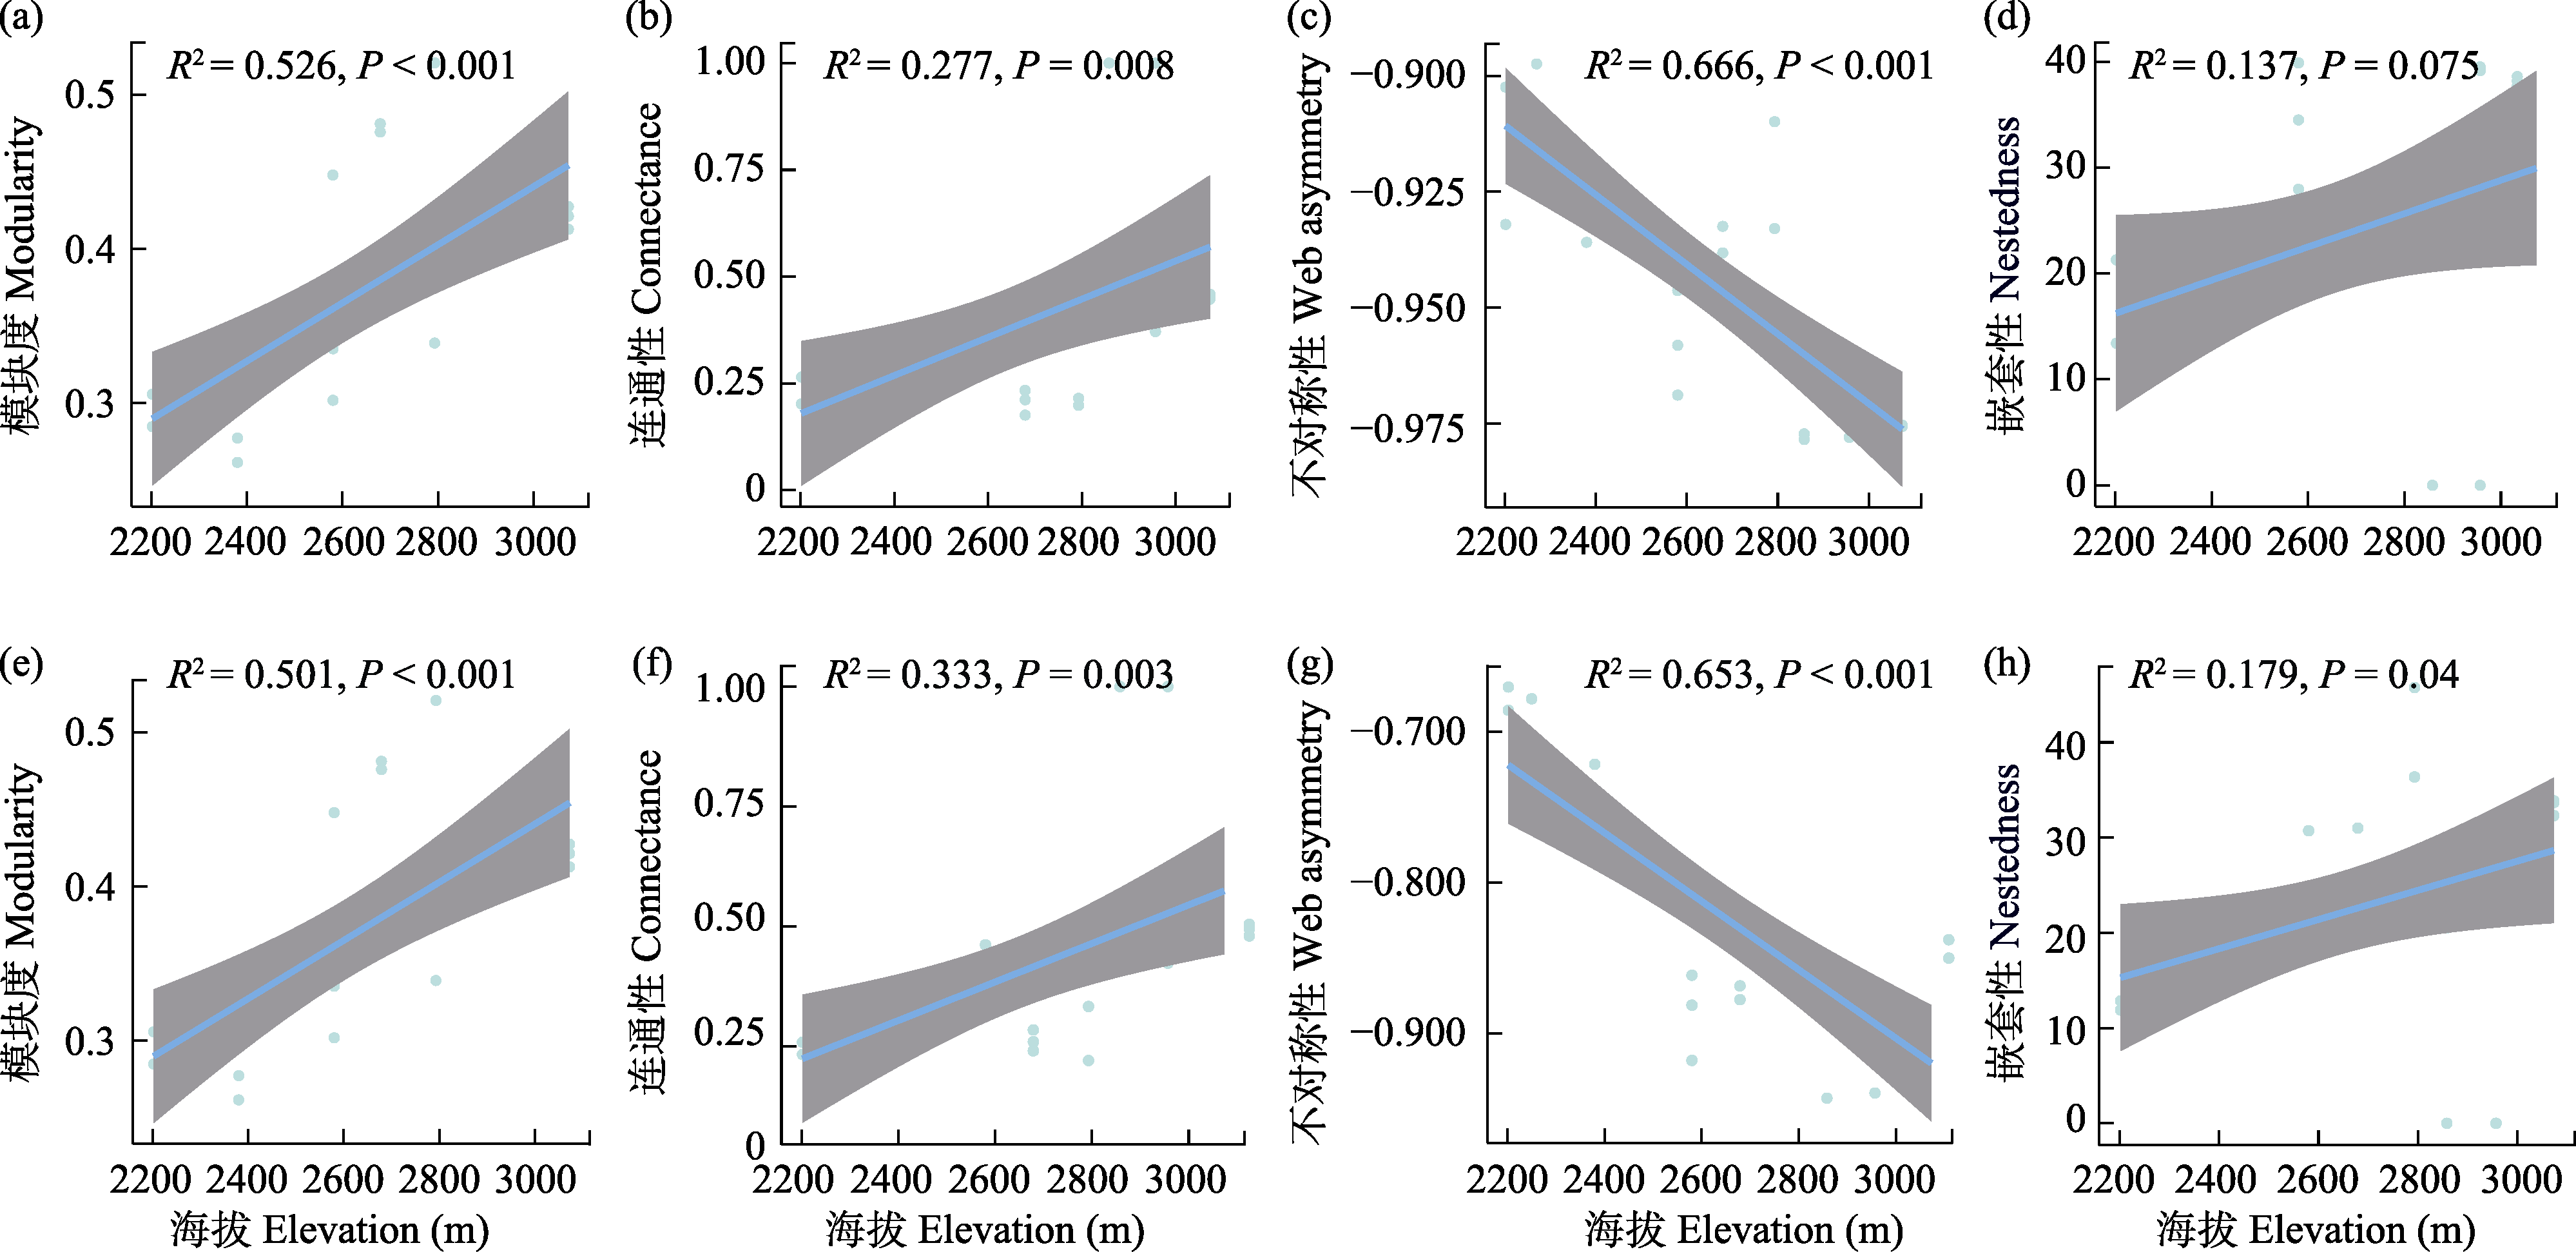
图5 植物-土壤微生物跨界子网络拓扑指数与海拔的回归分析。a-d分别为植物-细菌网络的模块化、连通性、不对称性和嵌套性; e-h分别为植物-真菌网络的模块化、连通性、不对称性和嵌套性。
Fig. 5 Regression analysis of plant-soil microbial inter-kingdom subnetwork topological indices with elevation. a-d are the modularity, connectance, web asymmetry, and nestedness of plant-bacteria networks, respectively; e-h are the modularity, connectance, web asymmetry, and nestedness of plant-fungi networks, respectively.
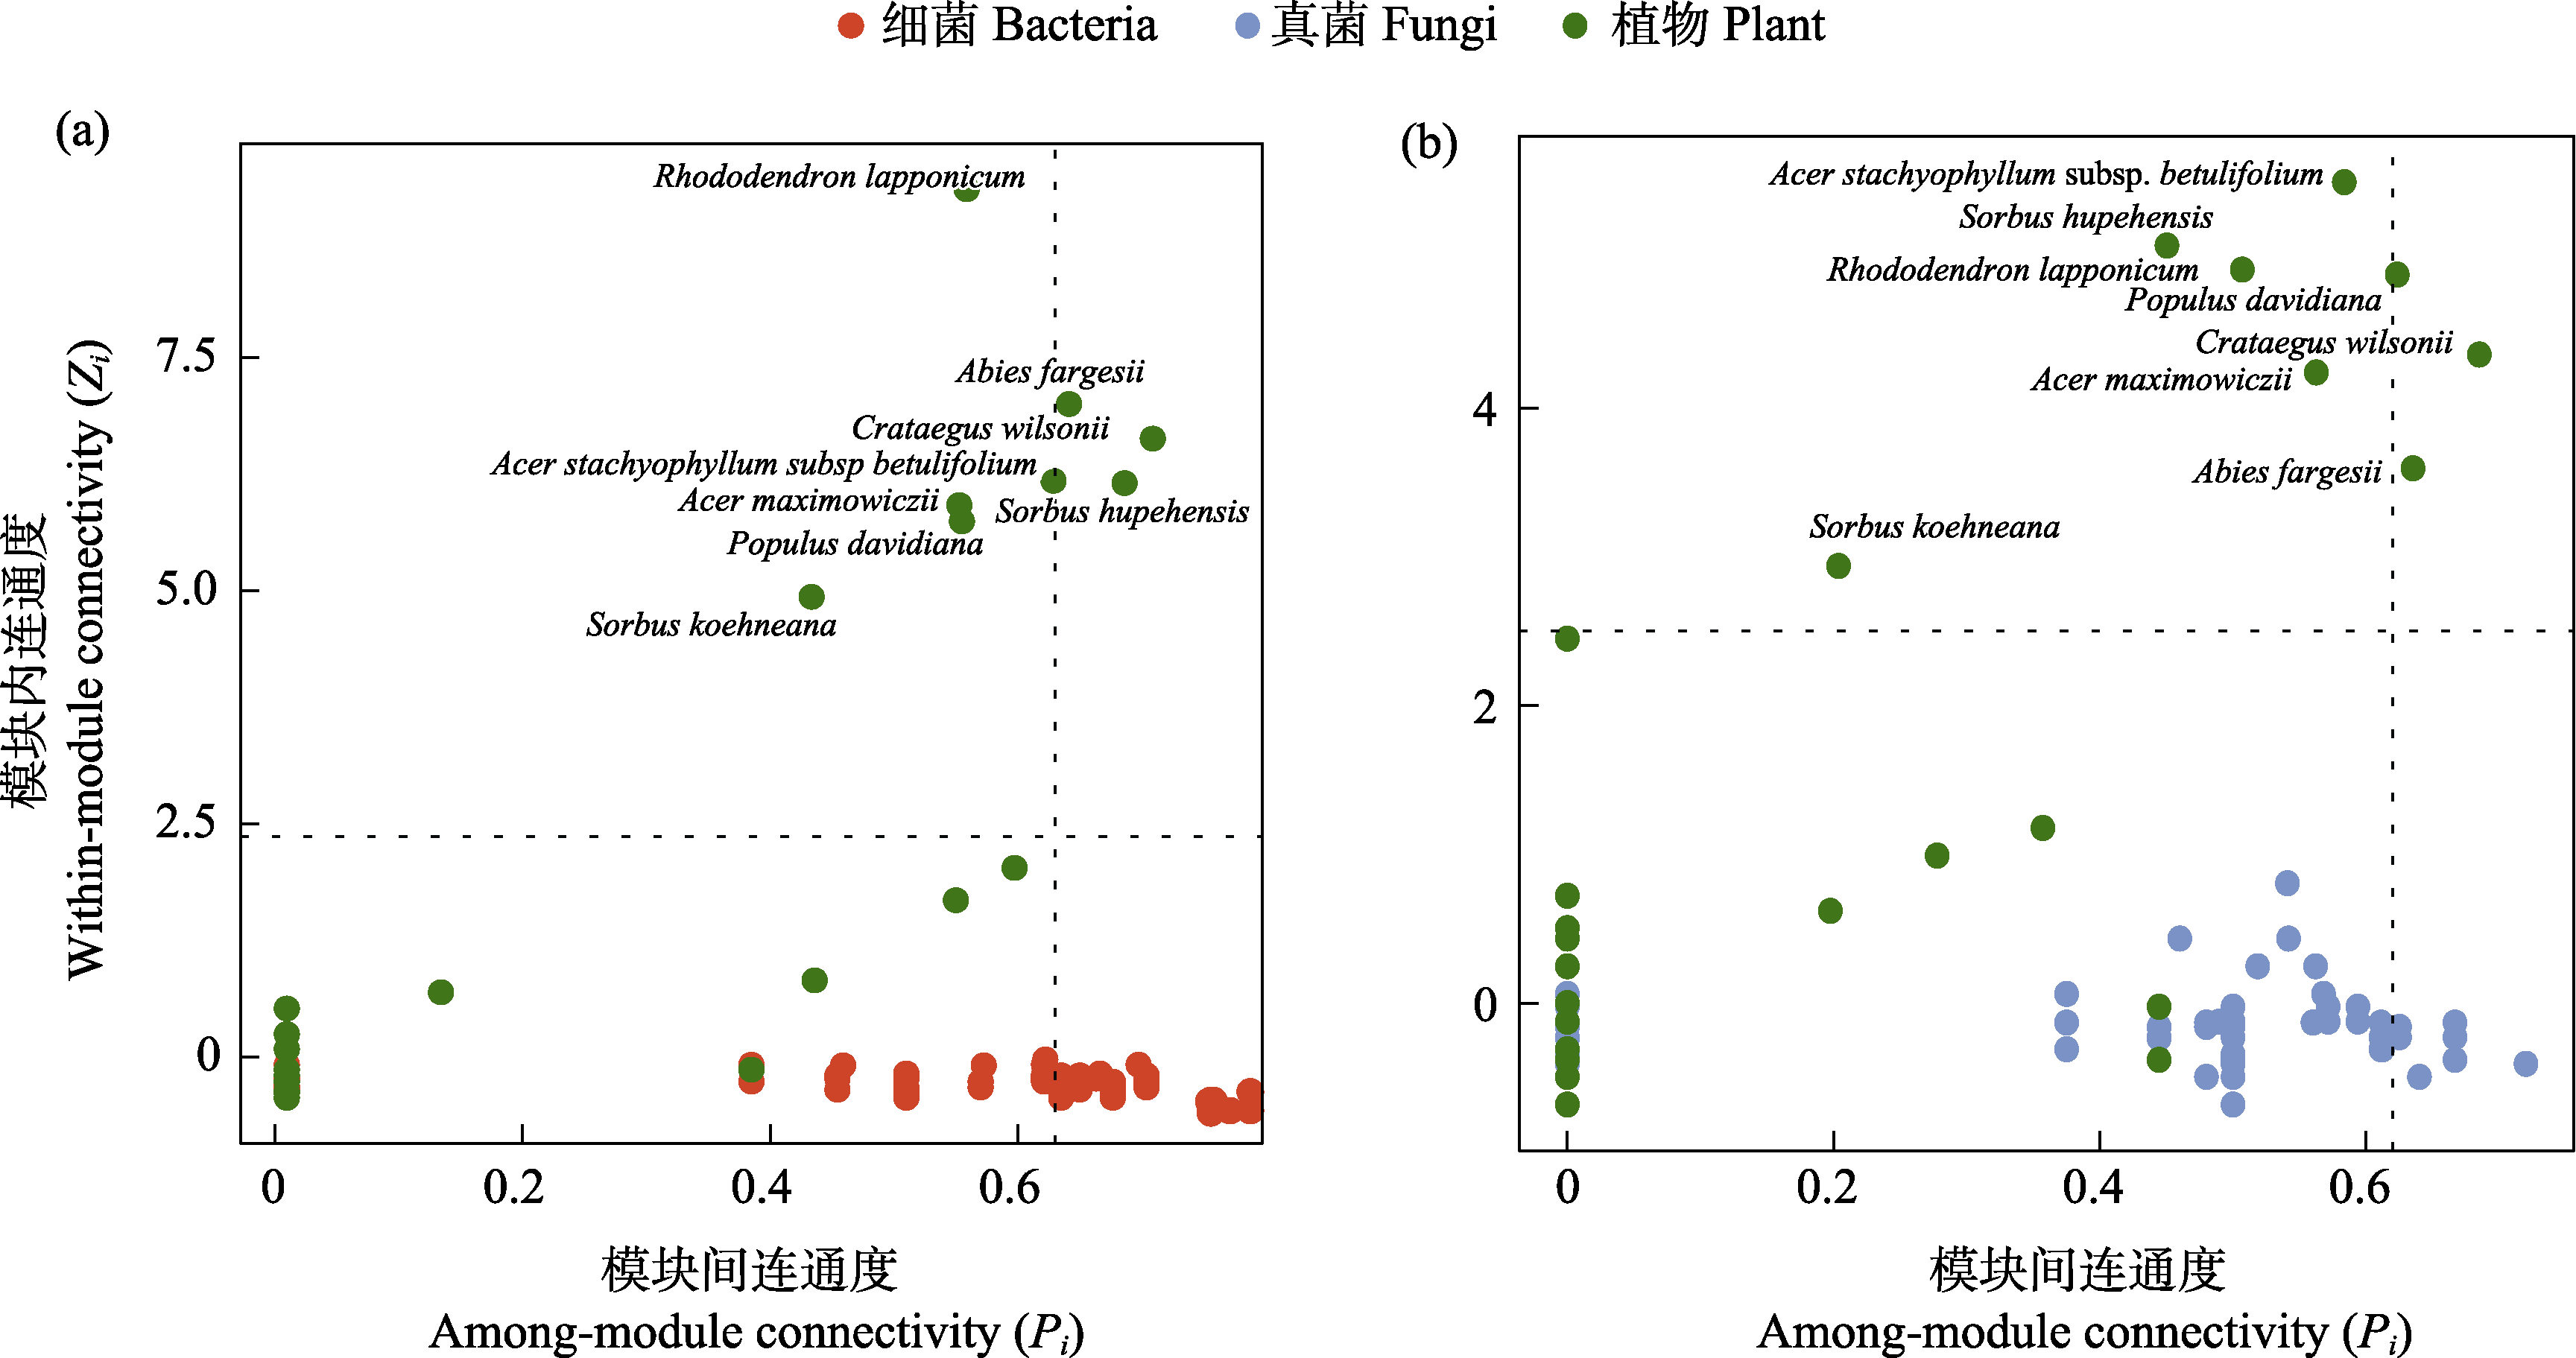
图6 植物与土壤微生物跨界生态网络(IDENs)节点拓扑角色分析。(a)植物-土壤细菌IDENs拓扑角色; (b)植物-土壤真菌IDENs拓扑角色。Rhododendron lapponicum: 高山杜鹃; Abies fargesii: 巴山冷杉; Crataegus wilsonii: 华中山楂; Acer stachyophyllum subsp. Betulifolium: 四蕊槭; Acer maximowiczii: 五尖槭; Sorbus hupehensis: 湖北花楸; Populus davidiana: 山杨; Sorbus koehneana: 陕甘花楸。
Fig. 6 Topological role analysis of nodes in plant-soil inter-kingdom ecological networks (IDENs). (a) Topological role of plant-soil bacterial IDENs; (b) Topological role of plant-soil fungal inter-kingdom ecological network IDENs.
| 植物-土壤微生物跨界生态网络 Plant-soil microbiome IDENs | 关键细菌和真菌纲类 Keystone bacterial and fungal classes | 相对丰度 Relative abundance (%) |
|---|---|---|
| 细菌-植物跨界生态网络 Plant-bacteria IDEN | 酸微菌纲 Acidimicrobiia | 0.07±0.04 |
| 酸杆菌纲Gp1 Acidobacteria Gp1 | 0.55±0.30 | |
| 酸杆菌纲Gp2 Acidobacteria Gp2 | 1.03±0.63 | |
| 酸杆菌纲Gp3 Acidobacteria Gp3 | 0.31±0.22 | |
| 放线菌纲 Actinobacteria | 0.4±0.19 | |
| Alpha变形菌纲 Alpha Proteobacteria | 3.03±0.92 | |
| Beta变形菌纲 Betaproteobacteria | 0.19±0.09 | |
| Delta变形菌纲 Deltaproteobacteria | 0.14±0.13 | |
| Gamma变形菌纲 Gammaproteobacteria | 0.52±0.29 | |
| 纤线杆菌纲 Ktedonobacteria | 0.06±0.06 | |
| 斯巴达杆菌纲 Spartobacteria | 0.12±0.10 | |
| Terriglobia | 0.34±0.30 | |
| 未分类 Unclassified | 0.79±0.64 | |
| 关键类群总和 Total keystone taxa | 7.56±1.59 | |
| 真菌-植物跨界生态网络 Plant-fungi IDEN | 伞菌纲 Agaricomycetes | 0.15±0.19 |
| 古根菌纲 Archaeorhizomycetes | 0.48±1.35 | |
| 锤舌菌纲 Leotiomycetes | 0.14±0.22 | |
| 被孢霉纲 Mortierellomycetes | 0.14±0.19 | |
| 关键类群总和 Total keystone taxa | 0.90±1.34 |
表4 植物-土壤微生物跨界生态网络(IDENs)关键细菌与真菌纲水平相对丰度(平均值±标准差)
Table 4 Relative abundance (mean±SD) of keystone bacterial and fungal classes in plant-soil microbiome inter-kingdom ecological networks (IDENs)
| 植物-土壤微生物跨界生态网络 Plant-soil microbiome IDENs | 关键细菌和真菌纲类 Keystone bacterial and fungal classes | 相对丰度 Relative abundance (%) |
|---|---|---|
| 细菌-植物跨界生态网络 Plant-bacteria IDEN | 酸微菌纲 Acidimicrobiia | 0.07±0.04 |
| 酸杆菌纲Gp1 Acidobacteria Gp1 | 0.55±0.30 | |
| 酸杆菌纲Gp2 Acidobacteria Gp2 | 1.03±0.63 | |
| 酸杆菌纲Gp3 Acidobacteria Gp3 | 0.31±0.22 | |
| 放线菌纲 Actinobacteria | 0.4±0.19 | |
| Alpha变形菌纲 Alpha Proteobacteria | 3.03±0.92 | |
| Beta变形菌纲 Betaproteobacteria | 0.19±0.09 | |
| Delta变形菌纲 Deltaproteobacteria | 0.14±0.13 | |
| Gamma变形菌纲 Gammaproteobacteria | 0.52±0.29 | |
| 纤线杆菌纲 Ktedonobacteria | 0.06±0.06 | |
| 斯巴达杆菌纲 Spartobacteria | 0.12±0.10 | |
| Terriglobia | 0.34±0.30 | |
| 未分类 Unclassified | 0.79±0.64 | |
| 关键类群总和 Total keystone taxa | 7.56±1.59 | |
| 真菌-植物跨界生态网络 Plant-fungi IDEN | 伞菌纲 Agaricomycetes | 0.15±0.19 |
| 古根菌纲 Archaeorhizomycetes | 0.48±1.35 | |
| 锤舌菌纲 Leotiomycetes | 0.14±0.22 | |
| 被孢霉纲 Mortierellomycetes | 0.14±0.19 | |
| 关键类群总和 Total keystone taxa | 0.90±1.34 |
| [1] |
Adams RI, Miletto M, Taylor JW, Bruns TD (2013) Dispersal in microbes: Fungi in indoor air are dominated by outdoor air and show dispersal limitation at short distances. The ISME Journal, 7, 1262-1273.
DOI URL |
| [2] | Bao SD (2000) Soil Agrochemical Analysis, 3rd edn. China Agriculture Press, Beijing.(in Chinese) |
| [鲍士旦 (2000) 土壤农化分析(第3版). 中国农业出版社, 北京.] | |
| [3] | Berger TW, Duboc O, Djukic I, Tatzber M, Gerzabek MH, Zehetner F (2015) Decomposition of beech (Fagus sylvatica) and pine (Pinus nigra) litter along an alpine elevation gradient: Decay and nutrient release. Geoderma, 251, 92-104. |
| [4] |
Bing HJ, Wu YH, Zhou J, Sun HY, Luo J, Wang J, Yu D (2016) Stoichiometric variation of carbon, nitrogen, and phosphorus in soils and its implication for nutrient limitation in alpine ecosystem of Eastern Tibetan Plateau. Journal of Soils and Sediments, 16, 405-416.
DOI URL |
| [5] |
Bokulich NA, Subramanian S, Faith JJ, Gevers D, Gordon JI, Knight R, Mills DA, Caporaso JG (2013) Quality-filtering vastly improves diversity estimates from Illumina amplicon sequencing. Nature Methods, 10, 57-59.
DOI PMID |
| [6] |
Boyle SA, Yarwood RR, Bottomley PJ, Myrold DD (2008) Bacterial and fungal contributions to soil nitrogen cycling under Douglas fir and red alder at two sites in Oregon. Soil Biology and Biochemistry, 40, 443-451.
DOI URL |
| [7] |
Camenzind T, Hättenschwiler S, Treseder KK, Lehmann A, Rillig MC (2018) Nutrient limitation of soil microbial processes in tropical forests. Ecological Monographs, 88, 4-21.
DOI URL |
| [8] | Castle SC, Nemergut DR, Grandy AS, Leff JW, Graham EB, Hood E, Schmidt SK, Wickings K, Cleveland CC (2016) Biogeochemical drivers of microbial community convergence across actively retreating glaciers. Soil Biology and Biochemistry, 101, 74-84. |
| [9] |
Chen J, Feng K, Hannula SE, Kuzyakov Y, Li Y, Xu H (2021) Interkingdom plant-microbial ecological networks under selective and clear cutting of tropical rainforest. Forest Ecology and Management, 491, 119182.
DOI URL |
| [10] |
Chen XL, Taylor AR, Reich PB, Hisano M, Chen HYH, Chang SX (2023) Tree diversity increases decadal forest soil carbon and nitrogen accrual. Nature, 618, 94-101.
DOI |
| [11] |
Chen Y, Xi JJ, Xiao M, Wang SL, Chen WJ, Liu FQ, Shao YZ, Yuan ZL (2022) Soil fungal communities show more specificity than bacteria for plant species composition in a temperate forest in China. BMC Microbiology, 22, 208.
DOI PMID |
| [12] |
Cline LC, Zak DR (2015) Soil microbial communities are shaped by plant-driven changes in resource availability during secondary succession. Ecology, 96, 3374-3385.
PMID |
| [13] | Coban O, De Deyn GB, van der Ploeg M (2022) Soil microbiota as game-changers in restoration of degraded lands. Science, 375, abe0725. |
| [14] |
Cong J, Yang YF, Liu XD, Lu H, Liu X, Zhou JZ, Li DQ, Yin HQ, Ding JJ, Zhang YG (2015) Analyses of soil microbial community compositions and functional genes reveal potential consequences of natural forest succession. Scientific Reports, 5, 10007.
DOI PMID |
| [15] |
Cong W, Yu JJ, Feng K, Deng Y, Zhang YG (2021) The coexistence relationship between plants and soil bacteria based on interdomain ecological network analysis. Frontiers in Microbiology, 12, 745582.
DOI URL |
| [16] |
Conradie TA, Jacobs K (2021) Distribution patterns of Acidobacteriota in different fynbos soils. PLoS ONE, 16, e0248913.
DOI URL |
| [17] |
Cui YX, Moorhead DL, Guo XB, Peng SS, Wang YQ, Zhang XC, Fang LC (2021) Stoichiometric models of microbial metabolic limitation in soil systems. Global Ecology and Biogeography, 30, 2297-2311.
DOI URL |
| [18] |
Dai TJ, Wen DH, Bates CT, Wu LW, Guo X, Liu S, Su YF, Lei JS, Zhou JZ, Yang YF (2022) Nutrient supply controls the linkage between species abundance and ecological interactions in marine bacterial communities. Nature Communications, 13, 175.
DOI PMID |
| [19] |
David B, Stefanie W (2014) Deciphering microbial interactions and detecting keystone species with co-occurrence networks. Frontiers in Microbiology, 5, 219.
DOI PMID |
| [20] | Delgado-Baquerizo M, Reich PB, Trivedi C, Eldridge DJ, Abades S, Alfaro FD, Bastida F, Berhe AA, Cutler NA, Gallardo A, García-Velázquez L, Hart SC, Hayes PE, He JZ, Hseu ZY, Hu HW, Kirchmair M, Neuhauser S, Pérez CA, Reed SC, Santos F, Sullivan BW, Trivedi P, Wang JT, Weber-Grullon L, Williams MA, Singh BK (2020) Multiple elements of soil biodiversity drive ecosystem functions across biomes. Nature Ecology & Evolution, 4, 210-220. |
| [21] |
Deng Y, Jiang YH, Yang YF, He ZL, Luo F, Zhou JZ (2012) Molecular ecological network analyses. BMC Bioinformatics, 13, 113.
DOI PMID |
| [22] |
Dunne JA, Williams RJ, Martinez ND (2002) Network structure and biodiversity loss in food webs: Robustness increases with connectance. Ecology Letters, 5, 558-567.
DOI URL |
| [23] |
Feng K, Zhang YG, He ZL, Ning DL, Deng Y (2019) Interdomain ecological networks between plants and microbes. Molecular Ecology Resources, 19, 1565-1577.
DOI PMID |
| [24] |
Feng K, Zhang ZJ, Cai WW, Liu WZ, Xu MY, Yin HQ, Wang AJ, He ZL, Deng Y (2017) Biodiversity and species competition regulate the resilience of microbial biofilm community. Molecular Ecology, 26, 6170-6182.
DOI PMID |
| [25] |
Fierer N, McCain CM, Meir P, Zimmermann M, Rapp JM, Silman MR, Knight R (2011) Microbes do not follow the elevational diversity patterns of plants and animals. Ecology, 92, 797-804.
PMID |
| [26] |
Gao L, Liu L, Lv AP, Fu L, Lian ZH, Nunoura T, Hedlund BP, Xu QY, Wu D, Yang J, Ali M, Li MM, Liu YH, Antunes A, Jiang HC, Cheng L, Jiao JY, Li WJ, Fang BZ (2024) Reversed oxidative TCA (roTCA) for carbon fixation by an Acidimicrobiia strain from a saline lake. The ISME Journal, 18, wrae147.
DOI URL |
| [27] | Garrity GM, Bell JA, Lilburn T (2005) Class II. Betaproteobacteria class. nov. In: Bergey’s Manual® of Systematic Bacteriology, pp. 575-922. Springer, Boston. |
| [28] |
Gaston KJ (2000) Global patterns in biodiversity. Nature, 405, 220-227.
DOI |
| [29] |
Georgiou K, Abramoff RZ, Harte J, Riley WJ, Torn MS (2017) Microbial community-level regulation explains soil carbon responses to long-term litter manipulations. Nature Communications, 8, 1223.
DOI PMID |
| [30] |
Guimerà R, Nunes Amaral LA (2005) Functional cartography of complex metabolic networks. Nature, 433, 895-900.
DOI |
| [31] |
Gupta RS, Mok A (2007) Phylogenomics and signature proteins for the alpha Proteobacteria and its main groups. BMC Microbiology, 7, 106.
PMID |
| [32] |
Hanson CA, Fuhrman JA, Horner-Devine MC, Martiny JBH (2012) Beyond biogeographic patterns: Processes shaping the microbial landscape. Nature Reviews Microbiology, 10, 497-506.
DOI PMID |
| [33] |
Haq SM, Calixto ES, Rashid I, Srivastava G, Ahmad KA (2022) Tree diversity, distribution and regeneration in major forest types along an extensive elevational gradient in Indian Himalaya: Implications for sustainable forest management. Forest Ecology and Management, 506, 119968.
DOI URL |
| [34] | Hu WJ, Cui HX, Pan L, Tang WP, Li HH, Zeng J, Gan HQ (2023) Niche characteristics and interspecific relationships of degenerated Pinus armandii community in Shennongjia National Park. Journal of Southwest Forestry University, 43(11), 26-37.(in Chinese with English abstract) |
| [胡文杰, 崔鸿侠, 潘磊, 唐万鹏, 李欢欢, 曾静, 甘慧群 (2023) 神农架国家公园华山松退化群落生态位特征及种间关系. 西南林业大学学报, 43(11), 26-37.] | |
| [35] | Huang CY (2000) Soil Science. China Agriculture Press, Beijing.(in Chinese) |
| [黄昌勇 (2000) 土壤学. 中国农业出版社, 北京.] | |
| [36] | Huang Y, Cong RZ, Zhang JL, Wang XH (2023) Soil microbial community structure and influencing factors of typical forest types in Sanjiang plain. Journal of Central South University of Forestry & Technology, 43(7), 129-140.(in Chinese with English abstract) |
| [黄艳, 丛日征, 张吉利, 王晓红 (2023) 三江平原典型森林类型土壤微生物群落结构与影响因子. 中南林业科技大学学报, 43(7), 129-140.] | |
| [37] |
Jagadamma S, Mayes MA, Steinweg JM, Schaeffer SM (2014) Substrate quality alters the microbial mineralization of added substrate and soil organic carbon. Biogeosciences, 11, 4665-4678.
DOI URL |
| [38] | Jiang XQ, Liu YH, Zhao BY (2009) Structure characteristics and spatial distribution of Abies fargesii population in Shennongjia National Nature Reserve, China. Acta Ecologica Sinica, 29, 2211-2218.(in Chinese with English abstract) |
| [蒋雪琴, 刘艳红, 赵本元 (2009) 湖北神农架地区巴山冷杉(Abies fargesii)种群结构特征与空间分布格局. 生态学报, 29, 2211-2218.] | |
| [39] | Jiao K, Zhang XB, Xu M, Liu XJ, An QD, Zhang CY (2021) Depth-related characteristics of soil microbial community along the soil profile of typical dark coniferous forest in southeast Tibet. Acta Ecologica Sinica, 41, 4864-4875.(in Chinese with English abstract) |
| [焦克, 张旭博, 徐梦, 刘晓洁, 安前东, 张崇玉 (2021) 藏东南典型暗针叶林不同土壤剖面微生物群落特征. 生态学报, 41, 4864-4875.] | |
| [40] |
Kalam S, Basu A, Ahmad I, Sayyed RZ, Ali El-Enshasy H, Dailin DJ, Suriani NL (2020) Recent understanding of soil Acidobacteria and their ecological significance: A critical review. Frontiers in Microbiology, 11, 580024.
DOI URL |
| [41] | Kirk P, Cannon P, Minter D, Stalpers J (2008) Ainsworth and Bisby’s Dictionary of the Fungi. CABI, Wallingford. |
| [42] | Klūga A, Dubova L, Alsiņa I, Rostoks N (2023) Alpha-, gamma- and beta-proteobacteria detected in legume nodules in Latvia, using full-length 16S rRNA gene sequencing. Acta Agriculturae Scandinavica, Section B: Soil & Plant Science, 73, 127-141. |
| [43] |
Kubartová A, Ottosson E, Dahlberg A, Stenlid J (2012) Patterns of fungal communities among and within decaying logs, revealed by 454 sequencing. Molecular Ecology, 21, 4514-4532.
DOI PMID |
| [44] | Li XY, Zhang WY, Liu F, Zhang ZM, He TB, Lin CH (2016) The distribution characteristics of soil carbon, nitrogen and phosphorus at different altitudes in Fanjingshan Mountain. Research of Soil and Water Conservation, 23(3), 19-24.(in Chinese with English abstract) |
| [李相楹, 张维勇, 刘峰, 张珍明, 何腾兵, 林昌虎 (2016) 不同海拔高度下梵净山土壤碳、氮、磷分布特征. 水土保持研究, 23(3), 19-24.] | |
| [45] |
Liu L, Zhu K, Krause SMB, Li SP, Wang X, Zhang ZC, Shen MW, Yang QS, Lian JY, Wang XH (2021) Changes in assembly processes of soil microbial communities during secondary succession in two subtropical forests. Soil Biology and Biochemistry, 154, 108144.
DOI URL |
| [46] |
Lu XH, Zang RG, Ding Y, Huang JH, Yang XS, Zhou YD (2015) Effects of tending on the functional traits and functional diversity of woody plants in a secondary tropical lowland rain forest. Biodiversity Science, 23, 79-88.(in Chinese with English abstract)
DOI |
|
[路兴慧, 臧润国, 丁易, 黄继红, 杨秀森, 周亚东 (2015) 抚育措施对热带次生林群落植物功能性状和功能多样性的影响. 生物多样性, 23, 79-88.]
DOI |
|
| [47] |
Ma XJ, Chen T, Zhang GS, Wang R (2004) Microbial community structure along an altitude gradient in three different localities. Folia Microbiologica, 49, 105-111.
PMID |
| [48] |
Masuda Y, Mise K, Xu ZX, Zhang ZC, Shiratori Y, Senoo K, Itoh H (2024) Global soil metagenomics reveals distribution and predominance of delta Proteobacteria in nitrogen-fixing microbiome. Microbiome, 12, 95.
DOI PMID |
| [49] | Memmott J, Waser NM, Price MV (2004) Tolerance of pollination networks to species extinctions. Proceedings of the Royal Society B: Biological Sciences, 271, 2605-2611. |
| [50] |
Montoya JM, Pimm SL, Solé RV (2006) Ecological networks and their fragility. Nature, 442, 259-264.
DOI |
| [51] |
Mori AS, Cornelissen JHC, Fujii S, Okada KI, Isbell F (2020) A meta-analysis on decomposition quantifies afterlife effects of plant diversity as a global change driver. Nature Communications, 11, 4547.
DOI PMID |
| [52] |
Neff F, Brändle M, Ambarli D, Ammer C, Bauhus J, Boch S, Hölzel N, Klaus VH, Kleinebecker T, Prati D, Schall P, Schäfer D, Schulze ED, Seibold S, Simons NK, Weisser WW, Pellissier L, Gossner MM (2021) Changes in plant-herbivore network structure and robustness along land-use intensity gradients in grasslands and forests. Science Advances, 7, eabf3985.
DOI URL |
| [53] |
Onthong J, Osaki M, Nilnond C, Tadano T (1999) Phosphorus status of some highly weathered soils in peninsular Thailand and availability in relation to citrate and oxalate application. Soil Science and Plant Nutrition, 45, 627-637.
DOI URL |
| [54] |
Pang DB, Wu MY, Zhao YR, Yang J, Dong LG, Wu XD, Chen L, Li XB, Ni XL, Li JY, Liang YL (2023) Soil microbial community characteristics and the influencing factors at different elevations on the eastern slope of Helan Mountain, Northwest China. Chinese Journal of Applied Ecology, 34, 1957-1967.(in Chinese with English abstract)
DOI |
|
[庞丹波, 吴梦瑶, 赵娅茹, 杨娟, 董立国, 吴旭东, 陈林, 李学斌, 倪细炉, 李静尧, 梁咏亮 (2023) 贺兰山东坡不同海拔土壤微生物群落特征及其影响因素. 应用生态学报, 34, 1957-1967.]
DOI |
|
| [55] | Pang H, Dai W, Wang B, An XJ, Yin QY, Zhang R (2013) Organic carbon content and mineralization characteristics of soil in a subtropical Pinus massoniana forest. Journal of Chemical & Pharmaceutical Research, 5, 1363-1369. |
| [56] | Peay KG, Matheny PB (2017) The biogeography of ectomycorrhizal fungi—A history of life in the subterranean. In: Molecular Mycorrhizal Symbiosis (ed. Martin F), pp. 341-361. Wiley Blackwell, Hoboken. |
| [57] |
Pellissier L, Albouy C, Bascompte J, Farwig N, Graham C, Loreau M, Maglianesi MA, Melián CJ, Pitteloud C, Roslin T, Rohr R, Saavedra S, Thuiller W, Woodward G, Zimmermann NE, Gravel D (2018) Comparing species interaction networks along environmental gradients. Biological Reviews, 93, 785-800.
DOI URL |
| [58] |
Piao Z, Yang LZ, Zhao LP, Yin SX (2008) Actinobacterial community structure in soils receiving long-term organic and inorganic amendments. Applied and Environmental Microbiology, 74, 526-530.
DOI PMID |
| [59] |
Pinto-Figueroa EA, Seddon E, Yashiro E, Buri A, Niculita-Hirzel H, van der Meer JR, Guisan A (2019) Archaeorhizomycetes spatial distribution in soils along wide elevational and environmental gradients reveal co-abundance patterns with other fungal saprobes and potential weathering capacities. Frontiers in Microbiology, 10, 656.
DOI PMID |
| [60] |
Prescott CE, Grayston SJ (2013) Tree species influence on microbial communities in litter and soil: Current knowledge and research needs. Forest Ecology and Management, 309, 19-27.
DOI URL |
| [61] | R Core Team (2024) R: A Language and Environment for Statistical Computing. R Foundation for Statistical Computing, Vienna, Austria. |
| [62] |
Rapp M, Leonardi S (1988) Litter decomposition during one year in a holm oak Quercus ilex stand. Pedobiologia, 32, 177-185.
DOI URL |
| [63] | Ren QW, Zuo WX, You HZ, Li LD, Bi J (2020) Response of soil nutrients and fertility to altitude gradient in mountainous areas of northern Hebei Province. Journal of Central South University of Forestry & Technology, 40(3), 96-104.(in Chinese with English abstract) |
| [任启文, 左万星, 尤海舟, 李联地, 毕君 (2020) 冀北山地土壤养分和肥力对海拔梯度的响应. 中南林业科技大学学报, 40(3), 96-104.] | |
| [64] | Santolini M, Barabási AL (2018) Predicting perturbation patterns from the topology of biological networks. Proceedings of the National Academy of Sciences, USA, 115, E6375-E6383. |
| [65] |
Scheibe A, Steffens C, Seven J, Jacob A, Hertel D, Leuschner C, Gleixner G (2015) Effects of tree identity dominate over tree diversity on the soil microbial community structure. Soil Biology and Biochemistry, 81, 219-227.
DOI URL |
| [66] |
Schmid MW, van Moorsel SJ, Hahl T, De Luca E, De Deyn GB, Wagg C, Niklaus PA, Schmid B (2021) Effects of plant community history, soil legacy and plant diversity on soil microbial communities. Journal of Ecology, 109, 3007-3023.
DOI URL |
| [67] |
Shen CC, Shi Y, Ni YY, Deng Y, Van Nostrand JD, He ZL, Zhou JZ, Chu HY (2016) Dramatic increases of soil microbial functional gene diversity at the treeline ecotone of Changbai Mountain. Frontiers in Microbiology, 7, 1184.
DOI PMID |
| [68] | Shen F, Huang R, Zeng J, Yu ZB, Wu QL, Zhao DY (2016) Progress of the molecular ecology network analysis. Environmental Science & Technology, 39(S1), 94-98, 173.(in Chinese with English abstract) |
| [沈烽, 黄睿, 曾巾, 余钟波, 吴庆龙, 赵大勇 (2016) 分子生态网络分析研究进展. 环境科学与技术, 39(S1), 94-98, 173.] | |
| [69] |
Shen J, Liang ZY, Kuzyakov Y, Li WT, He YT, Wang CQ, Xiao Y, Chen K, Sun G, Lei YB (2023) Dissolved organic matter defines microbial communities during initial soil formation after deglaciation. Science of the Total Environment, 878, 163171.
DOI URL |
| [70] | Sheng YY, Cong J, Lu H, Yang KH, Yang LS, Wang M, Zhang YG (2018) Soil fungal diversity of the timberline ecotone in Shennongjia National Park. Acta Ecologica Sinica, 38, 5322-5330.(in Chinese with English abstract) |
| [盛玉钰, 丛静, 卢慧, 杨开华, 杨林森, 王敏, 张于光 (2018) 神农架国家公园林线过渡带土壤真菌多样性. 生态学报, 38, 5322-5330.] | |
| [71] |
Sheng YY, Cong W, Yang LS, Liu Q, Zhang YG (2019) Forest soil fungal community elevational distribution pattern and their ecological assembly processes. Frontiers in Microbiology, 10, 2226.
DOI PMID |
| [72] |
Singh D, Lee-Cruz L, Kim WS, Kerfahi D, Chun JH, Adams JM (2014) Strong elevational trends in soil bacterial community composition on Mt. Halla, South Korea. Soil Biology and Biochemistry, 68, 140-149.
DOI URL |
| [73] |
Toju H, Guimarães PR Jr, Olesen JM, Thompson JN (2014) Assembly of complex plant-fungus networks. Nature Communications, 5, 5273.
DOI PMID |
| [74] |
Toju H, Guimarães PR Jr, Olesen JM, Thompson JN (2015) Below-ground plant-fungus network topology is not congruent with above-ground plant-animal network topology. Science Advances, 1, e1500291.
DOI URL |
| [75] |
Tylianakis JM, Morris RJ (2017) Ecological networks across environmental gradients. Annual Review of Ecology, Evolution, and Systematics, 48, 25-48.
DOI URL |
| [76] | Ward NL, Challacombe JF, Janssen PH, Henrissat B, Coutinho PM, Wu M, Xie G, Haft DH, Sait M, Badger J, Barabote RD, Bradley B, Brettin TS, Brinkac LM, Bruce D, Creasy T, Daugherty SC, Davidsen TM, DeBoy RT, Detter JC, Dodson RJ, Durkin AS, Ganapathy A, Gwinn-Giglio M, Han CS, Khouri H, Kiss H, Kothari SP, Madupu R, Nelson KE, Nelson WC, Paulsen I, Penn K, Ren QH, Rosovitz MJ, Selengut JD, Shrivastava S, Sullivan SA, Tapia R, Thompson LS, Watkins KL, Yang Q, Yu CH, Zafar N, Zhou LW, Kuske CR (2009) Three genomes from the phylum Acidobacteria provide insight into the lifestyles of these microorganisms in soils. Applied and Environmental Microbiology, 75, 2046-2056. |
| [77] | Wei X, Zheng XF, Zhang SX (2014) Forest soil physicochemical properties along different altitudinal gradients at Huoditang in the Qinling Mountains. Journal of Northwest Forestry University, 29(3), 9-14.(in Chinese with English abstract) |
| [魏新, 郑小锋, 张硕新 (2014) 秦岭火地塘不同海拔梯度森林土壤理化性质研究. 西北林学院学报, 29(3), 9-14.] | |
| [78] | Xiang HL, Cao Q, Sui HG, Cao W, Shi WY, Yang JY, Ge L (2025) Ecosystem services tradeoff-synergy and supply-demand relationships in the Shennongjia National Park. Acta Ecologica Sinica, 45, 4774-4788.(in Chinese with English abstract) |
| [向洪莉, 曹茜, 眭海刚, 曹威, 史玮玥, 杨敬元, 葛亮 (2025) 神农架国家公园生态系统服务权衡/协同及供需关系. 生态学报, 45, 4774-4788.] | |
| [79] |
Xu N, Tan GC, Wang HY, Gai XP (2016) Effect of biochar additions to soil on nitrogen leaching, microbial biomass and bacterial community structure. European Journal of Soil Biology, 74, 1-8.
DOI URL |
| [80] |
Xue Y, Kang HB, Cui YX, Lu S, Yang H, Zhu JQ, Fu ZJ, Yan CL, Wang DX (2022) Consistent plant and microbe nutrient limitation patterns during natural vegetation restoration. Frontiers in Plant Science, 13, 885984.
DOI URL |
| [81] |
Yang T, Tedersoo L, Soltis PS, Soltis DE, Sun M, Ma YY, Ni YY, Liu X, Fu X, Shi Y, Lin HY, Zhao YP, Fu CX, Dai CC, Gilbert JA, Chu HY (2023) Plant and fungal species interactions differ between aboveground and belowground habitats in mountain forests of Eastern China. Science China Life Sciences, 66, 1134-1150.
DOI |
| [82] | Yang Y, Shi Y, Kerfahi D, Ogwu MC, Wang JJ, Dong K, Takahashi K, Moroenyane I, Adams JM (2021) Elevation-related climate trends dominate fungal co-occurrence network structure and the abundance of keystone taxa on Mt. Norikura, Japan. Science of the Total Environment, 799, 149368. |
| [83] |
Yu JJ, Cong W, Ding Y, Jin LX, Cong J, Zhang YG (2022) Interkingdom plant-soil microbial ecological network analysis under different anthropogenic impacts in a tropical rainforest. Forests, 13, 1167.
DOI URL |
| [84] |
Yuan YL, Si GC, Wang J, Luo TX, Zhang GX (2014) Bacterial community in Alpine grasslands along an altitudinal gradient on the Tibetan Plateau. FEMS Microbiology Ecology, 87, 121-132.
DOI PMID |
| [85] |
Zabaloy MC, Garland JL, Allegrini M, del Valle Gomez E (2016) Soil microbial community-level physiological profiling as related to carbon and nitrogen availability under different land uses. Pedosphere, 26, 216-225.
DOI URL |
| [86] |
Zhang D, Zhang YX, Qu LY, Zhang S, Ma KM (2012) Effects of altitude on soil microbial community in Quercus liaotungensis forest. Chinese Journal of Applied Ecology, 23, 2041-2048.(in Chinese with English abstract)
PMID |
| [张地, 张育新, 曲来叶, 张霜, 马克明 (2012) 海拔对辽东栎林地土壤微生物群落的影响. 应用生态学报, 23, 2041-2048.] | |
| [87] |
Zhang XF, Zhao L, Xu SJ, Liu YZ, Liu HY, Cheng GD (2013) Soil moisture effect on bacterial and fungal community in Beilu River (Tibetan Plateau) permafrost soils with different vegetation types. Journal of Applied Microbiology, 114, 1054-1065.
DOI PMID |
| [88] |
Zhang YG, Cong J, Lu H, Li GL, Qu YY, Su XJ, Zhou JZ, Li DQ (2014) Community structure and elevational diversity patterns of soil Acidobacteria. Journal of Environmental Sciences, 26, 1717-1724.
DOI PMID |
| [89] |
Zhang YG, Cong J, Lu H, Li GL, Xue YD, Deng Y, Li H, Zhou JZ, Li DQ (2015) Soil bacterial diversity patterns and drivers along an elevational gradient on Shennongjia Mountain, China. Microbial Biotechnology, 8, 739-746.
DOI PMID |
| [90] | Zhang YG, Su XJ, Cong J, Chen Z, Lu H, Liu MC, Li DQ (2014) Variation of soil microbial community along elevation in the Shennongjia Mountain. Scientia Silvae Sinicae, 50(9), 161-166.(in Chinese with English abstract) |
| [张于光, 宿秀江, 丛静, 陈展, 卢慧, 刘敏超, 李迪强 (2014) 神农架土壤微生物群落的海拔梯度变化. 林业科学, 50(9), 161-166.] | |
| [91] |
Zhao WQ, Soininen J, Hu A, Liu JF, Li MJ, Wang JJ (2024) The structure of bacteria-fungi bipartite networks along elevational gradients in contrasting climates. Molecular Ecology, 33, e17442.
DOI URL |
| [92] |
Zheng Y, Saitou A, Wang CM, Toyoda A, Minakuchi Y, Sekiguchi Y, Ueda K, Takano H, Sakai Y, Abe K, Yokota A, Yabe S (2019) Genome features and secondary metabolites biosynthetic potential of the class Ktedonobacteria. Frontiers in Microbiology, 10, 893.
DOI PMID |
| [93] | Zhou JZ, Deng Y, Luo F, He ZL, Yang YF (2011) Phylogenetic molecular ecological network of soil microbial communities in response to elevated CO2. mBio, 2, e00122-e00111. |
| [94] |
Zhu ZX, Nizamani MM, Sahu SK, Kunasingam A, Wang HF (2019) Tree abundance, richness, and phylogenetic diversity along an elevation gradient in the tropical forest of Diaoluo Mountain in Hainan, China. Acta Oecologica, 101, 103481.
DOI URL |
| [1] | 李蓉姣, 董江海, 郑文芳, 刘入源, 赵立娟, 高瑞贺. 关帝山不同海拔杨桦混交林土壤动物多样性特征及其影响因素[J]. 生物多样性, 2024, 32(9): 24070-. |
| [2] | 李斌, 宋鹏飞, 顾海峰, 徐波, 刘道鑫, 江峰, 梁程博, 张萌, 高红梅, 蔡振媛, 张同作. 昆仑山青海片区鸟类群落多样性格局及其驱动因素[J]. 生物多样性, 2024, 32(4): 23406-. |
| [3] | 刘志发, 王新财, 龚粤宁, 陈道剑, 张强. 基于红外相机监测的广东南岭国家级自然保护区鸟兽多样性及其垂直分布特征[J]. 生物多样性, 2023, 31(8): 22689-. |
| [4] | 罗小燕, 李强, 黄晓磊. 戴云山国家级自然保护区访花昆虫DNA条形码数据集[J]. 生物多样性, 2023, 31(8): 23236-. |
| [5] | 高瑞贺, 范世明, 董江海, 李蓉姣, 张志伟. 关帝山不同海拔昆虫功能群特征及分布格局[J]. 生物多样性, 2023, 31(10): 23152-. |
| [6] | 魏慧玉,陈凯,王备新. 澜沧江流域水生昆虫群落分类多样性和功能多样性海拔格局的空间尺度依赖性[J]. 生物多样性, 2020, 28(4): 504-514. |
| [7] | 李明家, 吴凯媛, 孟凡凡, 沈吉, 刘勇勤, 肖能文, 王建军. 西藏横断山区溪流细菌beta多样性组分对气候和水体环境的响应[J]. 生物多样性, 2020, 28(12): 1570-1580. |
| [8] | 雷学明, 沈芳芳, 雷学臣, 刘文飞, 段洪浪, 樊后保, 吴建平. 模拟氮沉降和灌草去除对杉木人工林地土壤微生物群落结构的影响[J]. 生物多样性, 2018, 26(9): 962-971. |
| [9] | 陶夏秋, 崔绍朋, 蒋志刚, 初红军, 李娜, 杨道德, 李春旺. 新疆阿勒泰地区爬行动物区系及多样性海拔分布格局[J]. 生物多样性, 2018, 26(6): 578-589. |
| [10] | 郭屹立, 李冬兴, 王斌, 白坤栋, 向悟生, 李先琨. 北热带喀斯特季节性雨林土壤和6个常见树种凋落物的C、N、P化学计量学特征[J]. 生物多样性, 2017, 25(10): 1085-1094. |
| [11] | 冯晨光, 童超, 张仁意, 李国刚, 王贺崐元, 汤永涛, 张存芳, 赵凯. 青藏高原东北部边缘高原鳅属鱼类的 多样性与分布格局[J]. 生物多样性, 2017, 25(1): 53-61. |
| [12] | 赵鸣飞, 王国义, 邢开雄, 王宇航, 薛峰, 康慕谊, 罗开. 秦岭西部森林群落相似性递减格局及其影响因素[J]. 生物多样性, 2017, 25(1): 3-10. |
| [13] | 杨阳, 韩杰, 刘晔, 忠永茨仁, 石松林, 斯那此里, 许玥, 应凌霄, 张婉君, 沈泽昊. 三江并流地区干旱河谷植物物种多样性海拔梯度格局比较[J]. 生物多样性, 2016, 24(4): 440-452. |
| [14] | 李香真, 郭良栋, 李家宝, 姚敏杰. 中国土壤微生物多样性监测的现状和思考[J]. 生物多样性, 2016, 24(11): 1240-1248. |
| [15] | 刘芳, 李琪, 申聪聪, 褚海燕, 梁文举. 长白山不同海拔梯度裸肉足虫群落分布特征[J]. 生物多样性, 2014, 22(5): 608-617. |
| 阅读次数 | ||||||
|
全文 |
|
|||||
|
摘要 |
|
|||||
备案号:京ICP备16067583号-7
Copyright © 2026 版权所有 《生物多样性》编辑部
地址: 北京香山南辛村20号, 邮编:100093
电话: 010-62836137, 62836665 E-mail: biodiversity@ibcas.ac.cn
![]()