
生物多样性 ›› 2026, Vol. 34 ›› Issue (1): 25398. DOI: 10.17520/biods.2025398 cstr: 32101.14.biods.2025398
邢丁亮*( )(
)( )
)
收稿日期:2025-10-10
接受日期:2025-12-27
出版日期:2026-01-20
发布日期:2026-01-21
通讯作者:
邢丁亮
基金资助:
Dingliang Xing*()()
Received:2025-10-10
Accepted:2025-12-27
Online:2026-01-20
Published:2026-01-21
Contact:
Dingliang Xing
Supported by:摘要:
物种空间分布格局是群落生态学和宏生态学研究的核心问题之一。广泛用于度量空间聚集度的指标包括针对样方数据的负二项分布参数k, 以及针对点格局数据的非参邻域密度指数(如Condit等(2000)提出的Ω和Wiegand等(2025)提出的kff), 但这两类指数及对应的估计误差如何影响聚集度-多度关系尚不清楚。本文基于一个空间显式中性模型模拟的群落数据, 计算了上述聚集度指数及其标准误, 以分析这些指数及其估计误差如何影响聚集度与物种多度之间的关系。结果表明: (1)在空间聚集程度较高时, 3种聚集度指数之间存在高度正相关; 聚集程度较弱时, 尽管估计误差增大, 但k仍能区分聚集度种间差异, 而两个点格局指数则判别力不足。(2)不同指数的估计误差之间存在一定正相关, 但相关性较弱。极大似然法给出的稀有种和弱聚集物种k值标准误较大, 与模拟结果一致; 相比之下, 基于重采样方法的点格局指数标准误整体偏小。(3)聚集度-多度关系受所选指数及回归方法(是否加权)影响。对于1/k, 加权回归能够稳定复现出中性理论所预测的幂律关系及幂指数(等于-1), 而不加权回归得到的幂指数较理论值更接近0, 且在聚集程度较弱的群落中尤为明显。两种点格局指数与多度之间亦呈幂律关系, 但幂指数随群落平均聚集程度而变化, 聚集程度越弱幂指数越接近0。综上所述, 忽略聚集度估计的不确定性会显著影响对聚集度-多度关系的推断, 可能导致错误地拒绝中性零假设, 增加I类统计错误的风险。两种基于点格局的指数与多度的关系能反映群落平均聚集程度的影响, 但并不适用于检验中性与非中性群落构建机制。建议在分析样方数据时, 采用基于极大似然估计的负二项分布参数k及其标准误来度量物种聚集度, 并将不确定性纳入后续分析。对于其他聚集度指数及其与多度之间的关系, 需进一步发展基于中性理论的零假设。
邢丁亮 (2026) 空间聚集度指数及其估计不确定性对聚集度-多度关系的影响. 生物多样性, 34, 25398. DOI: 10.17520/biods.2025398.
Dingliang Xing (2026) Influence of aggregation indices and estimation uncertainty on the aggregation-abundance relationship. Biodiversity Science, 34, 25398. DOI: 10.17520/biods.2025398.
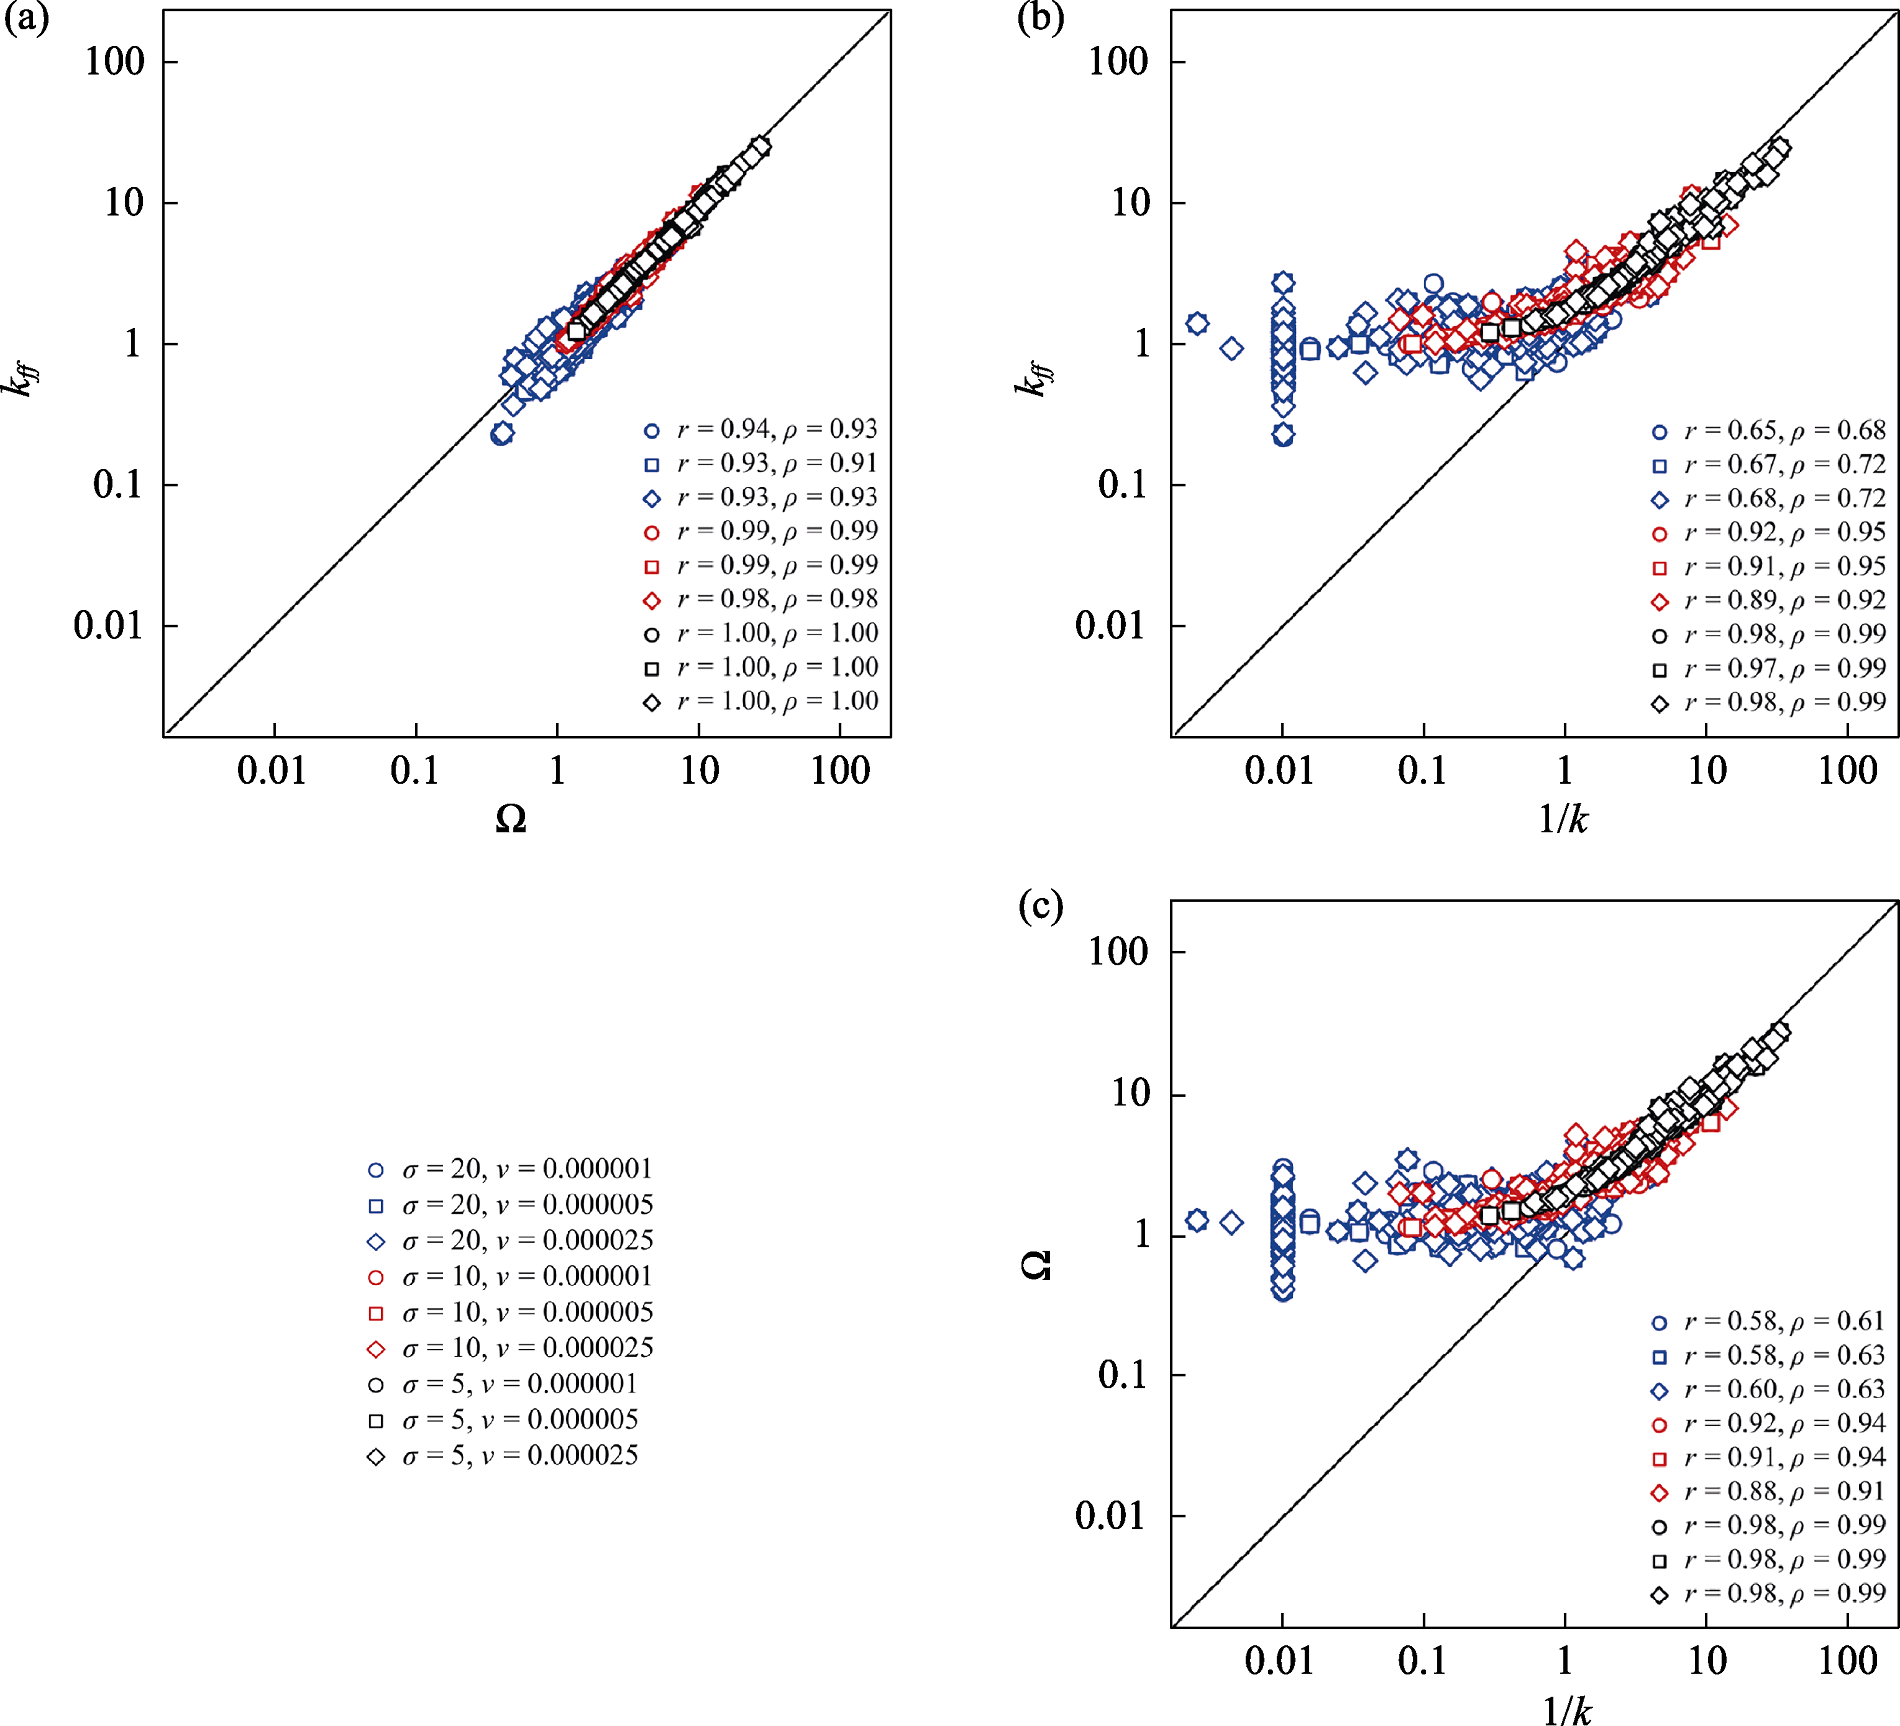
图1 3种聚集度指数之间的相关性。不同的形状和颜色表示中性显式模拟模型中不同的参数(扩散参数σ和成种速率ν见图例)组合。r和ρ分别为不同参数组合下聚集度指数之间的Pearson和Spearman相关系数。k为负二项分布聚集度参数, Ω为Condit等(2000)的相对邻体密度指数, kff为Wiegand等(2025)的距离加权邻体密度指数。
Fig. 1 Correlations among three indices of spatial aggregation. Different shapes and colors represent simulations from a spatially explicit neutral model with various combinations of parameters (dispersal potential, σ; and speciation rate, ν). The values r and ρ denote the Pearson and Spearman correlation coefficients, respectively. k, Aggregation parameter of the negative binomial distribution; Ω, Relative neighborhood density index of Condit et al. (2000); kff, Distance-weighted version of the relative neighborhood density index of Wiegand et al. (2025).
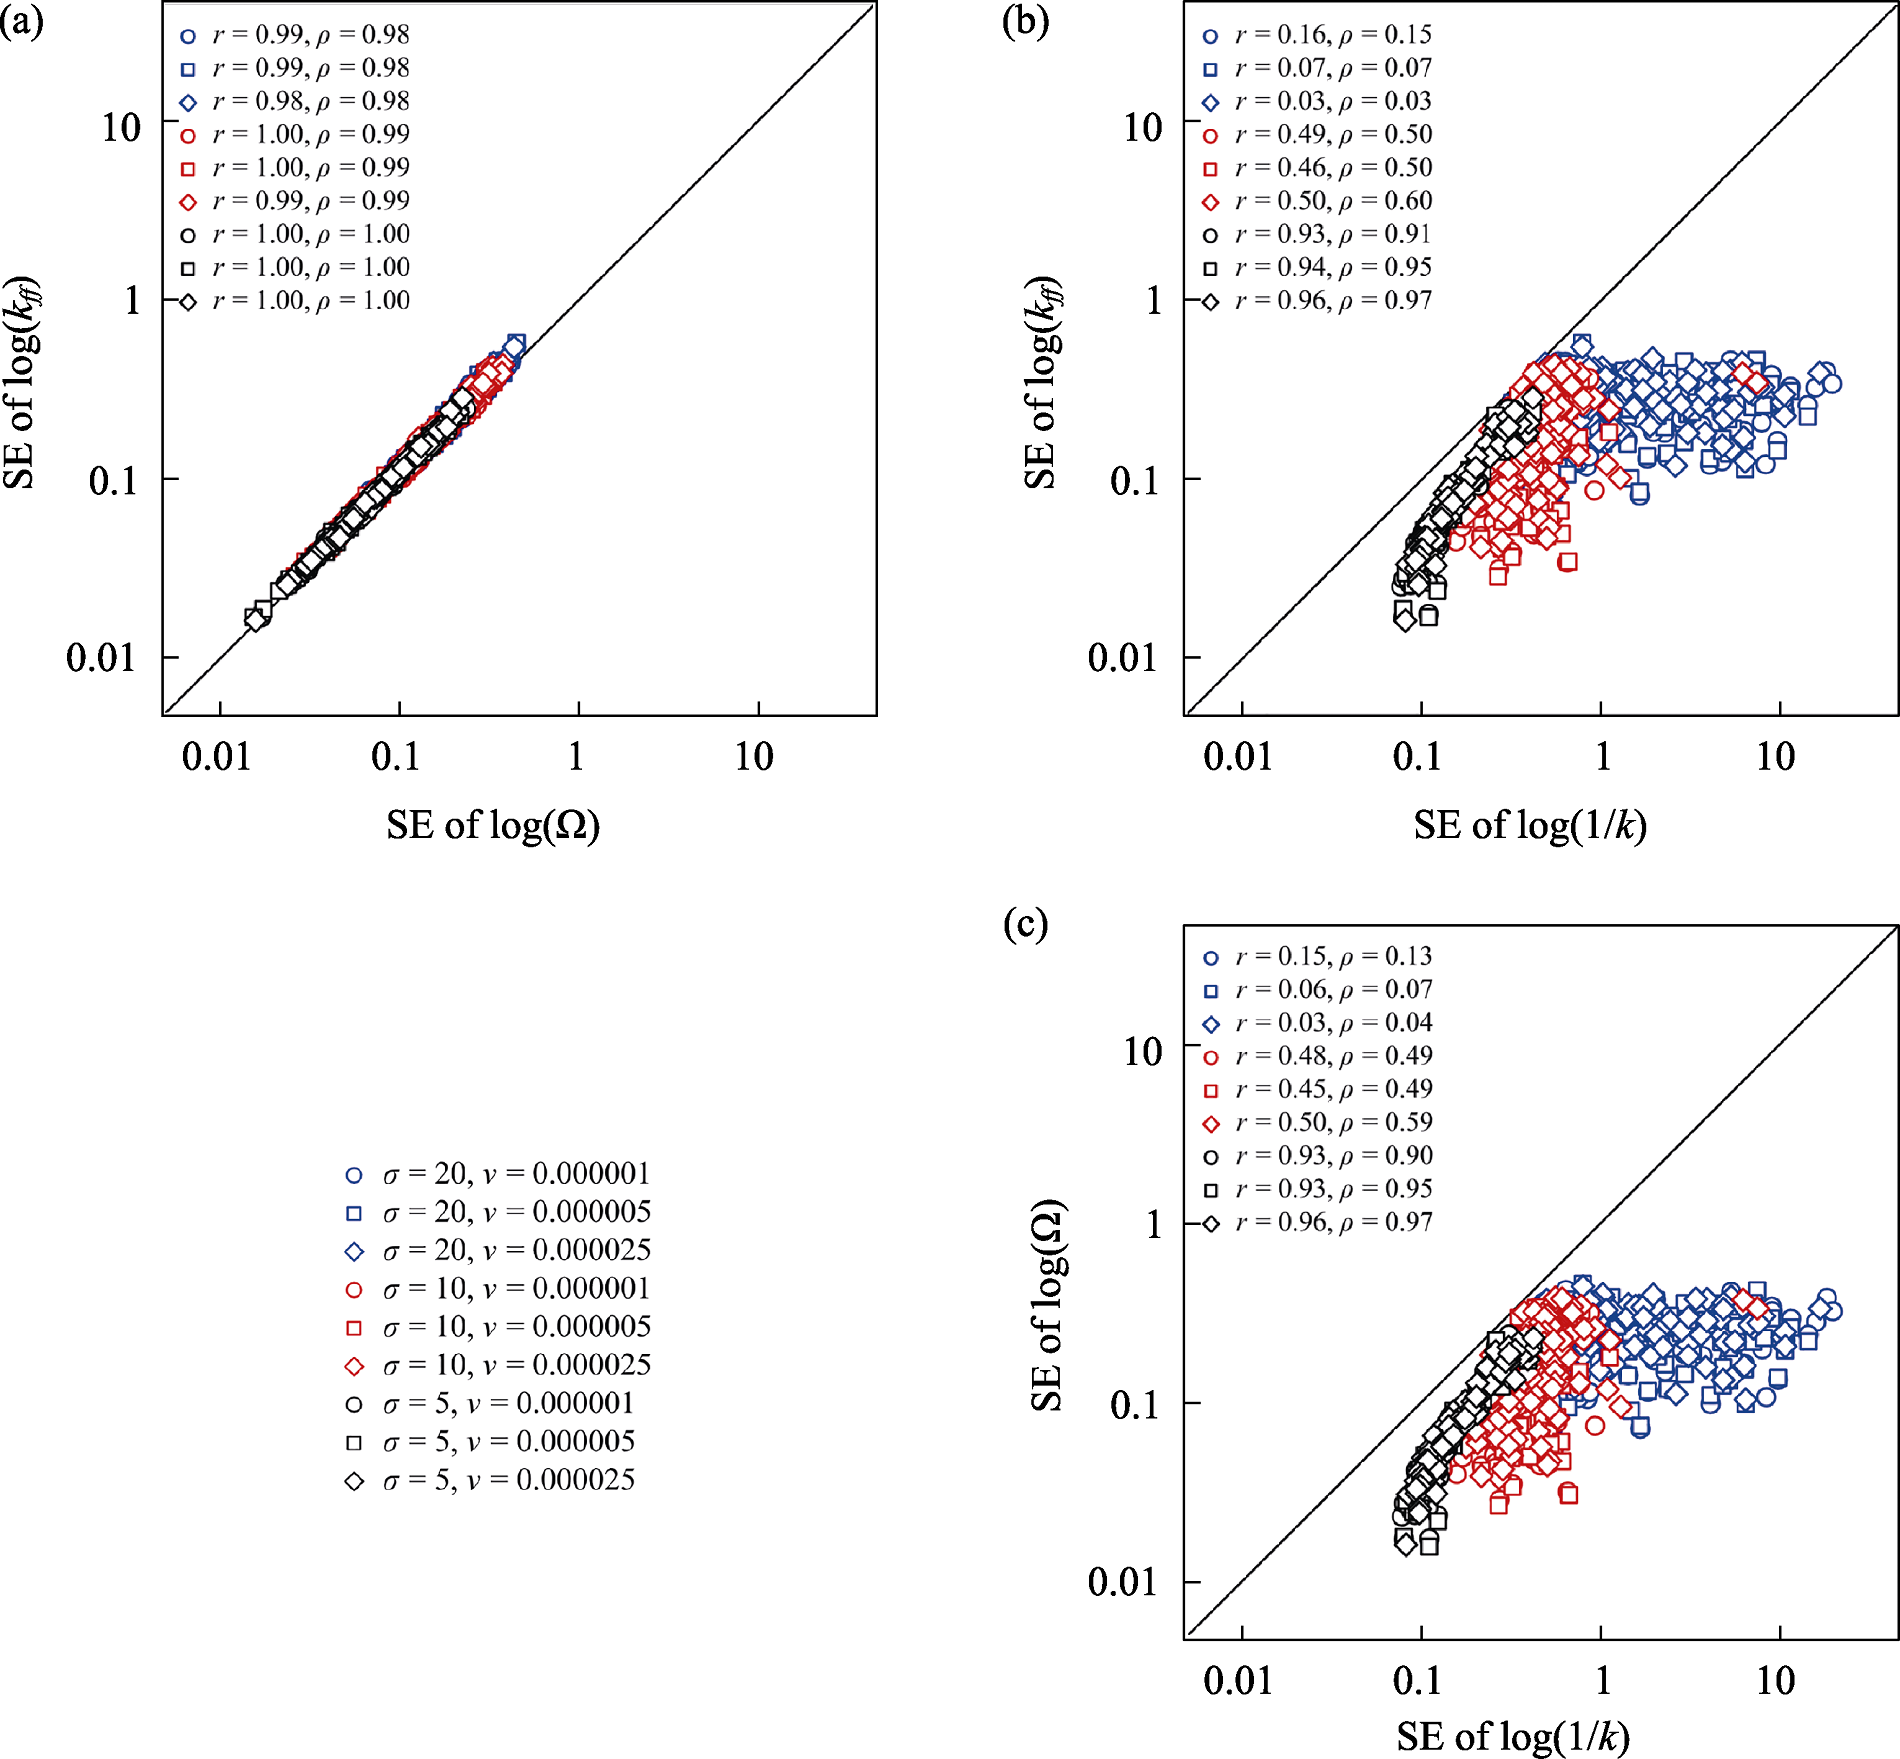
图2 3种聚集度指数标准误(SE)之间的相关性。σ、ν、r、ρ、k、Ω和kff含义同图1。
Fig. 2 Correlations among the standard errors (SE) of the three spatial aggregation indices. σ, ν, r, ρ, k, Ω, and kff are as described in Fig. 1.
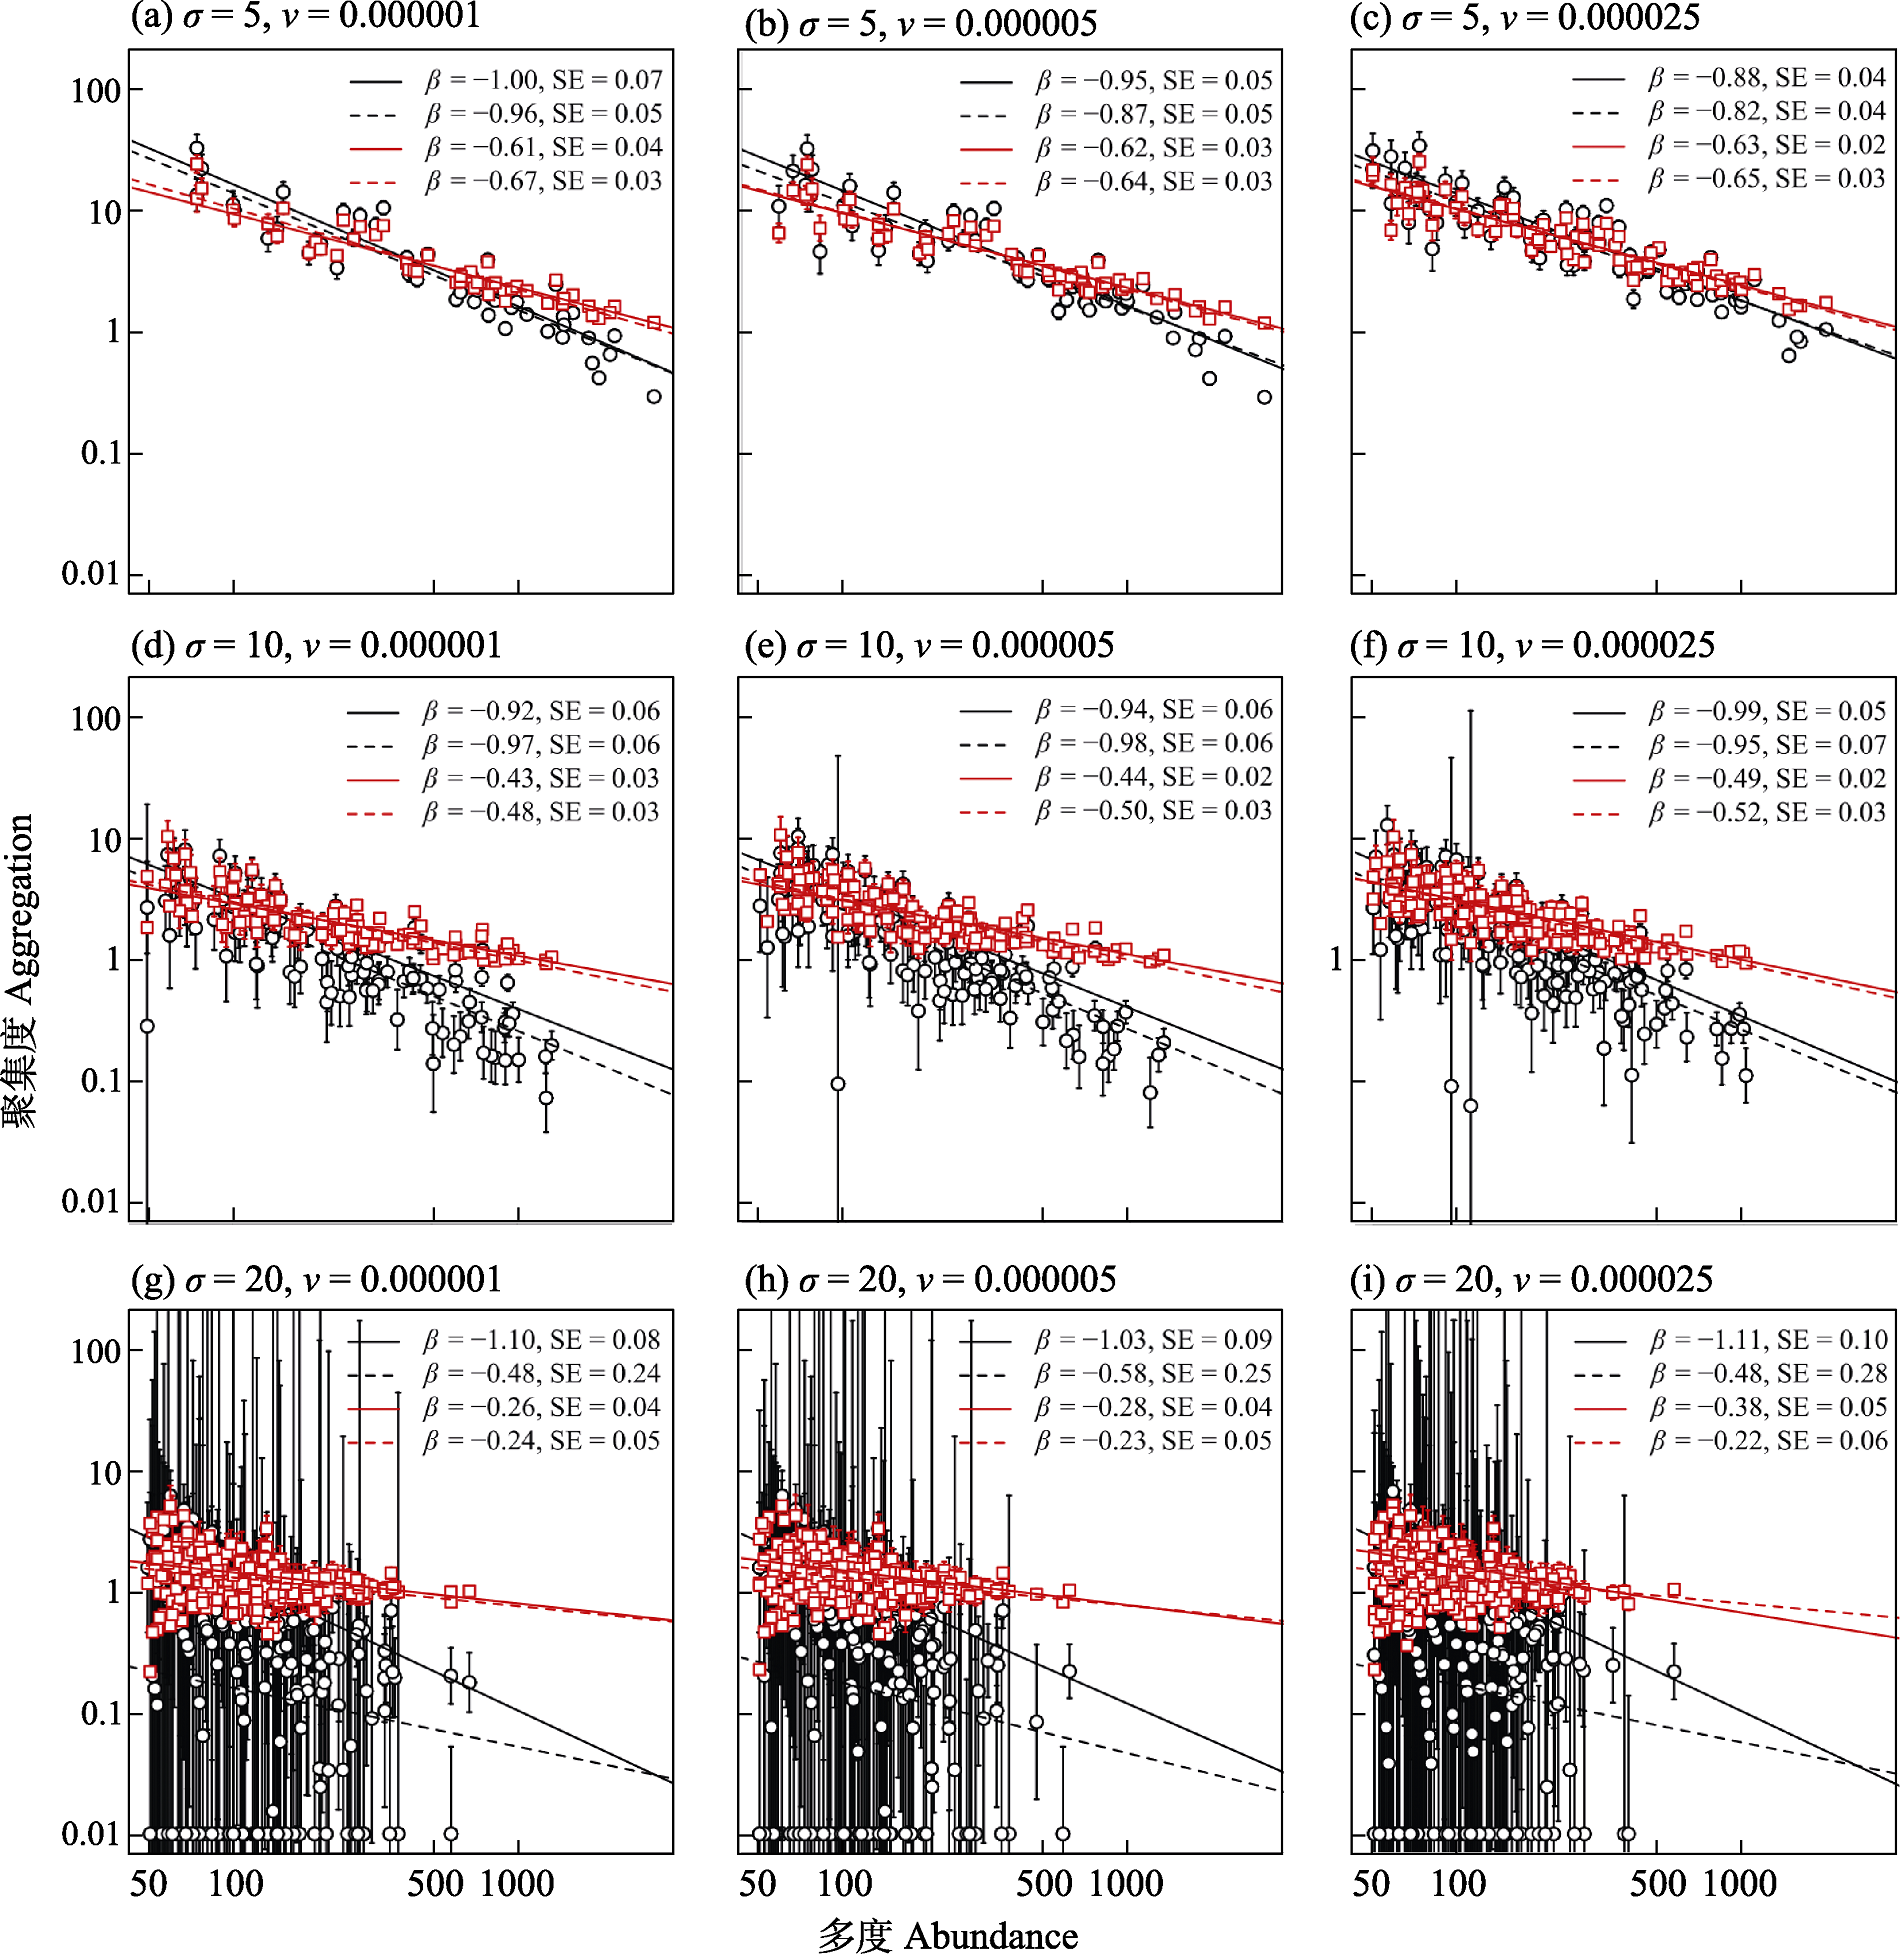
图3 不同参数组合(扩散参数σ和成种速率ν)模拟空间明晰中性群落中的聚集度-多度关系。黑色小圆圈与对应的回归线代表以负二项分布参数k度量聚集度(聚集度 = 1/k)的结果, 红色小方块和对应回归线代表以kff度量聚集度的结果。实线为加权回归, 虚线为非加权回归。β和SE为回归斜率和对应的标准误。
Fig. 3 Relationships between spatial aggregation and species abundance for simulated spatial-explicit neutral communities with different combinations of parameters (dispersal potential, σ; and speciation rate, ν). Aggregation is measured using either the negative binomial parameter k (where aggregation = 1/k; black circles) or the kff index (red squares). Solid and dashed lines represent weighted and non-weighted least-square regressions, respectively. β and SE denote the regression slope and its standard error.
| [1] |
Condit R, Ashton PS, Baker P, Bunyavejchewin S, Gunatilleke S, Gunatilleke N, Hubbell SP, Foster RB, Itoh A, LaFrankie JV, Lee HS, Losos E, Manokaran N, Sukumar R, Yamakura T (2000) Spatial patterns in the distribution of tropical tree species. Science, 288, 1414-1418.
DOI PMID |
| [2] | Deane DC, Xing DL, Hui C, McGeoch M, He FL (2022) A null model for quantifying the geometric effect of habitat subdivision on species diversity. Global Ecology and Biogeography, 32, 440-453. |
| [3] |
Du H, Hu F, Zeng FP, Wang KL, Peng WX, Zhang H, Zeng ZX, Zhang F, Song TQ (2017) Spatial distribution of tree species in evergreen-deciduous broadleaf karst forests in Southwest China. Scientific Reports, 7, 15664.
DOI PMID |
| [4] |
Gilbert GS, Howard E, Ayala-Orozco B, Bonilla-Moheno M, Cummings J, Langridge S, Parker IM, Pasari J, Schweizer D, Swope S (2010) Beyond the tropics: Forest structure in a temperate forest mapped plot. Journal of Vegetation Science, 21, 388-405.
DOI URL |
| [5] |
Green JL, Plotkin JB (2007) A statistical theory for sampling species abundances. Ecology Letters, 10, 1037-1045.
PMID |
| [6] |
Gu HY, Li JX, Qi G, Wang SZ (2020) Species spatial distributions in a warm-temperate deciduous broad-leaved forest in China. Journal of Forestry Research, 31, 1187-1194.
DOI |
| [7] |
Guo YL, Lu JM, Franklin SB, Wang QG, Xu YZ, Zhang KH, Bao DC, Qiao XJ, Huang HD, Lu ZJ, Jiang MX (2013) Spatial distribution of tree species in a species-rich subtropical mountain forest in Central China. Canadian Journal of Forest Research, 43, 826-835.
DOI URL |
| [8] |
Guyatt HL, Bundy DAP, Medley GF, Grenfell BT (1990) The relationship between the frequency distribution of Ascaris lumbricoides and the prevalence and intensity of infection in human communities. Parasitology, 101, 139-143.
DOI URL |
| [9] |
Hairston NG (1959) Species abundance and community organization. Ecology, 40, 404-416.
DOI URL |
| [10] | Harte J (2011) Maximum Entropy and Ecology: A Theory of Abundance, Distribution, and Energetics. Oxford University Press, Oxford. |
| [11] |
Hassell MP, Southwood TRE, Reader PM (1987) The dynamics of the viburnum whitefly (Aleurotrachelus jelinekii): A case study of population regulation. Journal of Animal Ecology, 56, 283-300.
DOI URL |
| [12] |
He FL, Gaston KJ (2003) Occupancy, spatial variance, and the abundance of species. The American Naturalist, 162, 366-375.
DOI URL |
| [13] | He FL, Legendre P (2002) Species diversity patterns derived from species-area models. Ecology, 83, 1185-1198. |
| [14] |
He FL, Legendre P, LaFrankie JV (1997) Distribution patterns of tree species in a Malaysian tropical rain forest. Journal of Vegetation Science, 8, 105-114.
DOI URL |
| [15] |
Hubbell SP (1979) Tree dispersion, abundance, and diversity in a tropical dry forest. Science, 203, 1299-1309.
PMID |
| [16] | Hubbell SP (2001) The Unified Neutral Theory of Biodiversity and Biogeography. Princeton University Press, Princeton. |
| [17] |
Hurlbert SH (1990) Spatial distribution of the montane unicorn. Oikos, 58, 257-271.
DOI URL |
| [18] | Kendall DG (1949) Stochastic processes and population growth. Journal of the Royal Statistical Society B: Methodological, 11, 230-282. |
| [19] |
Kitzes J, Brush M, Walters K (2021) A unified framework for species spatial patterns: Linking the occupancy area curve, Taylor’s Law, the neighborhood density function and two-plot species turnover. Ecology Letters, 24, 2043-2053.
DOI URL |
| [20] | Krebs CJ (1989) Ecological Methodology. Harper & Row, New York. |
| [21] |
Kretzschmar M, Adler FR (1993) Aggregated distributions in models for patchy populations. Theoretical Population Biology, 43, 1-30.
PMID |
| [22] |
Li L, Huang ZL, Ye WH, Cao HL, Wei SG, Wang ZG, Lian JY, Sun IF, Ma KP, He FL (2009) Spatial distributions of tree species in a subtropical forest of China. Oikos, 118, 495-502.
DOI URL |
| [23] |
Lowe WH, McPeek MA (2014) Is dispersal neutral? Trends in Ecology & Evolution, 29, 444-450.
DOI URL |
| [24] |
McGill BJ (2010) Towards a unification of unified theories of biodiversity. Ecology Letters, 13, 627-642.
DOI PMID |
| [25] | Niu CJ, Lou AR, Sun RY, Li QF (2023) Basic Ecology, 4th edn. Higher Education Press, Beijing. (in Chinese) |
| [牛翠娟, 娄安如, 孙儒泳, 李庆芬 (2023) 基础生态学(第四版). 高等教育出版社, 北京.] | |
| [26] |
Plotkin JB, Muller-Landau HC (2002) Sampling the species composition of a landscape. Ecology, 83, 3344-3356.
DOI URL |
| [27] |
Song HJ, Xu YD, Hao J, Zhao BQ, Guo DG, Shao HB (2017) Investigating distribution pattern of species in a warm-temperate conifer-broadleaved-mixed forest in China for sustainably utilizing forest and soils. Science of the Total Environment, 578, 81-89.
DOI URL |
| [28] | Taylor RAJ (2019) Taylor’s Power Law: Order and Pattern in Nature. Elsevier, San Diego. |
| [29] |
Thompson SED, Chisholm RA, Rosindell J (2020) Pycoalescence and rcoalescence: Packages for simulating spatially explicit neutral models of biodiversity. Methods in Ecology and Evolution, 11, 1237-1246.
DOI |
| [30] |
Wang XG, Ye J, Li BH, Zhang J, Lin F, Hao ZQ (2010) Spatial distributions of species in an old-growth temperate forest, northeastern China. Canadian Journal of Forest Research, 40, 1011-1019.
DOI URL |
| [31] |
Wiegand T, Uriarte M, Kraft NJB, Shen GC, Wang XG, He FL (2017) Spatially explicit metrics of species diversity, functional diversity, and phylogenetic diversity: Insights into plant community assembly processes. Annual Review of Ecology, Evolution, and Systematics, 48, 329-351.
DOI URL |
| [32] | Wiegand T, Wang XG, Anderson-Teixeira KJ, Bourg NA, Cao M, Ci XQ, Davies SJ, Hao ZQ, Howe RW, Kress WJ, Lian JY, Li J, Lin LX, Lin Y, Ma KP, McShea W, Mi XC, Su SH, Sun IF, Wolf A, Ye WH, Huth A (2021) Consequences of spatial patterns for coexistence in species-rich plant communities. Nature Ecology & Evolution, 5, 965-973. |
| [33] |
Wiegand T, Wang XG, Fischer SM, Kraft NJB, Bourg NA, Brockelman WY, Cao GH, Cao M, Chanthorn W, Chu CJ, Davies S, Ediriweera S, Savitri Gunatilleke CV, Gunatilleke IAUN, Hao ZQ, Howe R, Jiang MX, Jin GZ, Kress WJ, Li BH, Lian JY, Lin LX, Liu F, Ma KP, McShea W, Mi XC, Myers JA, Nathalang A, Orwig DA, Shen GC, Su SH, Sun IF, Wang XH, Wolf A, Yan ER, Ye WH, Zhu Y, Huth A (2025) Latitudinal scaling of aggregation with abundance and coexistence in forests. Nature, 640, 967-973.
DOI |
| [34] |
Wilber MQ, Kitzes J, Harte J (2015) Scale collapse and the emergence of the power law species-area relationship. Global Ecology and Biogeography, 24, 883-895.
DOI URL |
| [35] |
Xing DL, He FL (2021) Analytical models for β-diversity and the power-law scaling of β-deviation. Methods in Ecology and Evolution, 12, 405-414.
DOI URL |
| [36] | Zhang J, Hao ZQ, Song B, Ye J, Li BH, Yao XL (2007) Spatial distribution patterns and associations of Pinus koraiensis and Tilia amurensis in broad-leaved Korean pine mixed forest in Changbai Mountain. Chinese Journal of Applied Ecology, 18, 1681-1687. (in Chinese with English abstract) |
| [张健, 郝占庆, 宋波, 叶吉, 李步杭, 姚晓琳 (2007) 长白山阔叶红松林中红松与紫椴的空间分布格局及其关联性. 应用生态学报, 18, 1681-1687.] | |
| [37] |
Zhang Z, Hu G, Zhu J, Ni J (2013) Aggregated spatial distributions of species in a subtropical karst forest, southwestern China. Journal of Plant Ecology, 6, 131-140.
DOI |
| [1] | 王映霓, 雷晶晶, 包雨鑫, 廖丹, 张新娜, 王娟. 性别系统对东北天然针阔混交林中优势树种空间分布格局的影响[J]. 生物多样性, 2025, 33(11): 25101-. |
| [2] | 王明慧, 陈昭铨, 李帅锋, 黄小波, 郎学东, 胡子涵, 尚瑞广, 刘万德. 云南普洱季风常绿阔叶林不同种子扩散方式的优势种空间点格局分析[J]. 生物多样性, 2023, 31(9): 23147-. |
| [3] | 李世东. 中国和美国国家公园时空发展及驱动因素[J]. 生物多样性, 2023, 31(6): 23040-. |
| [4] | 陈宏, 冼晓青, 陈宜雪, 林娜, 王苗苗, 李志鹏, 赵健. 海岛型城市红火蚁发生程度空间格局及驱动因子——以福建海坛岛为例[J]. 生物多样性, 2023, 31(5): 22501-. |
| [5] | 张伟, 翟东东, 熊飞, 刘红艳, 陈元元, 王莹, 廖传松, 段辛斌, 田辉伍, 邓华堂, 陈大庆. 三峡库区鱼类群落结构和功能多样性[J]. 生物多样性, 2023, 31(2): 22136-. |
| [6] | 田希, 刘文聪, 饶杰生, 王晓凤, 杨涛, 陈稀, 张秋雨, 刘其明, 徐衍潇, 张旭, 沈泽昊. 云南鸡足山半湿润常绿阔叶林的林隙干扰格局与成因[J]. 生物多样性, 2023, 31(11): 23219-. |
| [7] | 付飞, 魏慧玉, 常育腾, 王备新, 陈凯. 澜沧江中游水生昆虫生活史和生态学性状多样性的海拔格局: 气候和土地利用的影响[J]. 生物多样性, 2022, 30(5): 21332-. |
| [8] | 鲁梦珍, 曾馥平, 宋同清, 彭晚霞, 张浩, 苏樑, 刘坤平, 谭卫宁, 杜虎. 喀斯特常绿落叶阔叶林死亡个体空间分布格局及生境关联[J]. 生物多样性, 2022, 30(4): 21340-. |
| [9] | 孙佳欢, 刘冬, 朱家祺, 张书宁, 高梅香. 小麦-玉米轮作农田土壤螨多样性空间分布格局[J]. 生物多样性, 2022, 30(12): 22292-. |
| [10] | 黄小,朱江,姚兰,艾训儒,王进,吴漫玲,朱强,陈绍林. 水杉原生种群结构及空间分布格局[J]. 生物多样性, 2020, 28(4): 463-473. |
| [11] | 宋垚彬, 徐力, 段俊鹏, 张卫军, 申屠晓露, 李天翔, 臧润国, 董鸣. 西藏极小种群野生植物密叶红豆杉种群的性比及雌雄空间格局[J]. 生物多样性, 2020, 28(3): 269-276. |
| [12] | 王鑫厅, 柴静, 姜超, 邰阳, 迟延艳, 张维华, 刘芳, 李素英. 典型草原大针茅种群空间格局及对长期过度放牧的响应[J]. 生物多样性, 2020, 28(2): 128-134. |
| [13] | 葛振鹏, 刘权兴. 整体大于部分之和: 生态自组织斑图及其涌现属性[J]. 生物多样性, 2020, 28(11): 1431-1443. |
| [14] | 王世彤, 吴浩, 刘梦婷, 张佳鑫, 刘检明, 孟红杰, 徐耀粘, 乔秀娟, 魏新增, 卢志军, 江明喜. 极小种群野生植物黄梅秤锤树群落结构与动态[J]. 生物多样性, 2018, 26(7): 749-759. |
| [15] | 梁健超, 丁志锋, 张春兰, 胡慧建, 朵海瑞, 唐虹. 青海三江源国家级自然保护区麦秀分区鸟类多样性空间格局及热点区域研究[J]. 生物多样性, 2017, 25(3): 294-303. |
| 阅读次数 | ||||||
|
全文 |
|
|||||
|
摘要 |
|
|||||
备案号:京ICP备16067583号-7
Copyright © 2026 版权所有 《生物多样性》编辑部
地址: 北京香山南辛村20号, 邮编:100093
电话: 010-62836137, 62836665 E-mail: biodiversity@ibcas.ac.cn
![]()