
生物多样性 ›› 2021, Vol. 29 ›› Issue (6): 790-797. DOI: 10.17520/biods.2021011 cstr: 32101.14.biods.2021011
邹怡*( )
)
收稿日期:2021-01-08
接受日期:2021-04-26
出版日期:2021-06-20
发布日期:2021-06-08
通讯作者:
邹怡
作者简介:* E-mail: yi.zou@xjtlu.edu.cn基金资助:
Yi Zou*()
Received:2021-01-08
Accepted:2021-04-26
Online:2021-06-20
Published:2021-06-08
Contact:
Yi Zou
摘要:
度量样方间物种组成的差异, 即β多样性, 是生态学研究中的常用手段。在开展生态学研究的过程中, 不同样方获取的样本量通常不同。使用物种稀疏曲线可以计算不同样本量的α多样性, 但常用的β多样性指数的计算却没有考虑样本量的差异。本文主要介绍了从稀疏曲线演化而来的可以计算不同样本量的β多样性指数——预期共享物种数(expected species shared, ESS)及其标准化后的指数, 其中详细介绍了弦标准化的预期共享物种数(chord-normalized expected species shared, CNESS)。利用真实采集的数据集, 本文演示了在不同样本参数m下, CNESS经过主坐标分析(principal coordinates analysis, PCoA)的二维排序结果, 并比较了样本量变化后, CNESS与基于多度的Chao-Jaccard相异性指数之间的差异。模拟结果表明, CNESS指数与Chao-Jaccard指数的PCoA结果具有相关性, 该相关性不随m值的变化而变化。CNESS指数较Chao-Jaccard指数具有更多优势, 通过调节样本参数m, CNESS的结果可以分析优势种或者稀有种的物种组成差异, 同时CNESS指数对样本量不敏感。ESS系列相异指数是基于物种多度的计算, 适用于样本量不一致时的β多样性研究, 建议在开展昆虫等无脊椎动物的生态学研究中使用此指数。为了更加准确地获得样方之间的物种组成差异, 在数据分析的过程中应选取不同大小的m值计算CNESS。然而, 由于样本量小于特定m值的样方会在计算中被剔除, 因此, 在实际的取样工作中, 每个样方都应该尽量采集到足够多的个体, 才能保证在m值足够大的时候也不丢失样方信息。
邹怡 (2021) 样本量不一致时的β多样性计算. 生物多样性, 29, 790-797. DOI: 10.17520/biods.2021011.
Yi Zou (2021) The calculation of β-diversity for different sample sizes. Biodiversity Science, 29, 790-797. DOI: 10.17520/biods.2021011.
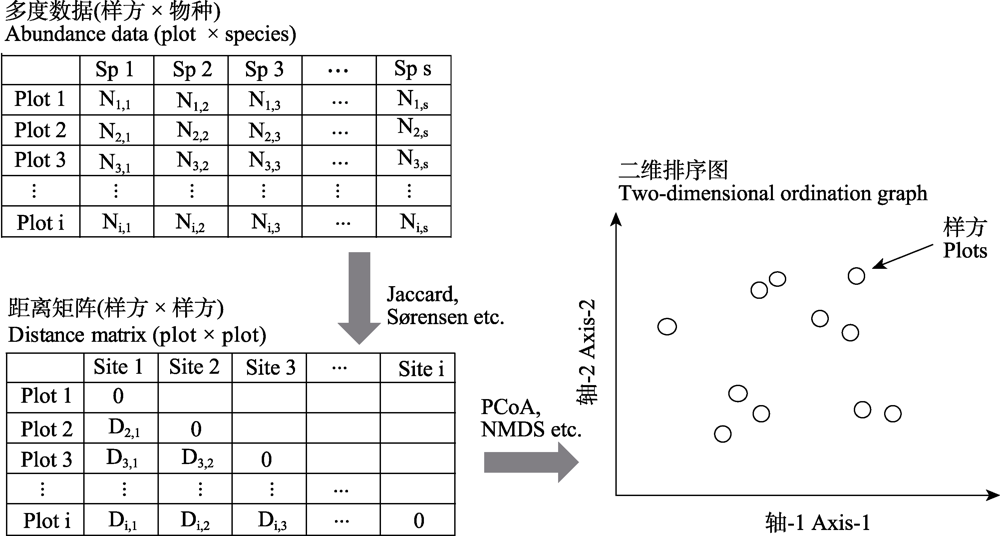
图1 从样方 × 物种的多度数据转换成二维排序图的流程图。原始的多度数据通过计算相异指数可以得到一个两两样方配对的距离矩阵; 该距离矩阵可以通过合适的排序方法得到二维的降序图; 二维图中的一个点代表一个样方, 点与点之间的距离代表样方之间的物种组成是相异(距离比较远)还是相似(距离比较近)。
Fig. 1 Flow chart for converting plot × species multi-dimensional data into a two-dimensional ordination graph. The raw data can be calculated into a pair-wised distance matrix. The distance matrix can be descended into a two-dimensional ordination graph. One point in the ordination graph represents a sampling plot, while the distance between the points represents that the species composition between plot is dissimilar (distance is far) or similar (distance is relatively close).
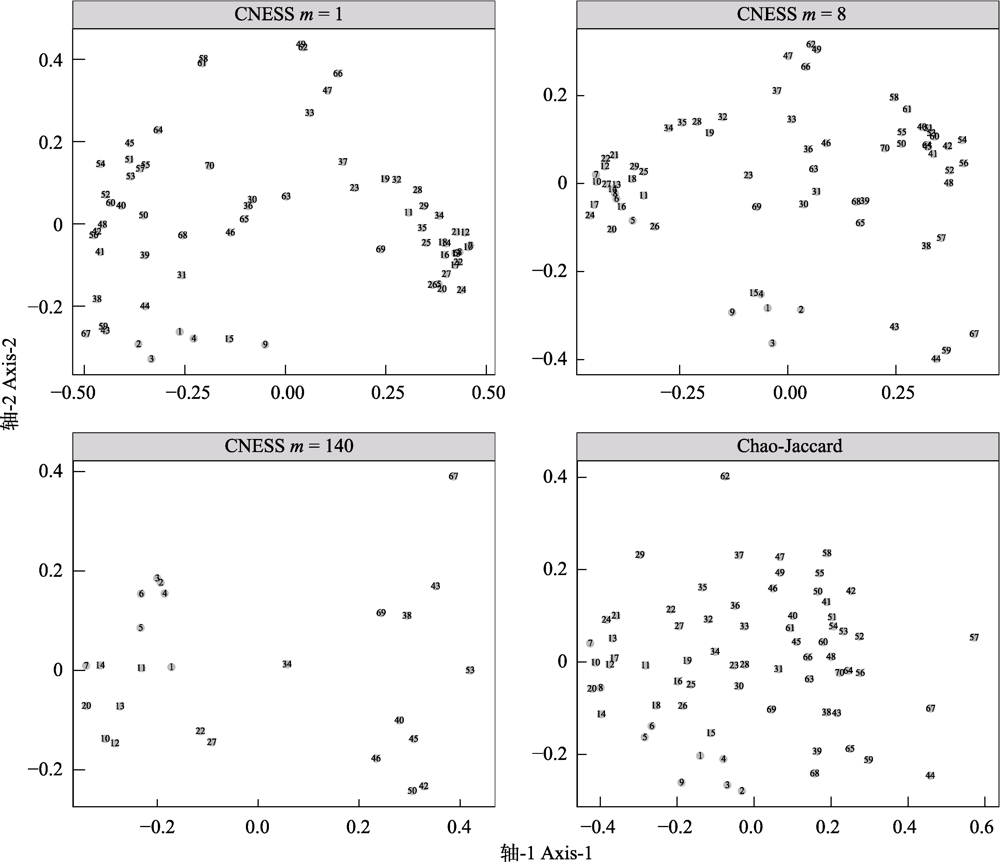
图2 不同取样参数大小(m = 1, 8和140)下的基于弦标准化的预期共享物种数(CNESS)指数以及Chao-Jaccard指数的主坐标分析(PCoA)二维排序图
Fig. 2 Two-dimensional principal coordinates analysis (PCoA) plots based on chord-normalized expected species shared (CNESS) index with different sampling size parameter (m= 1, 8, 140) and based on the Chao-Jaccard index
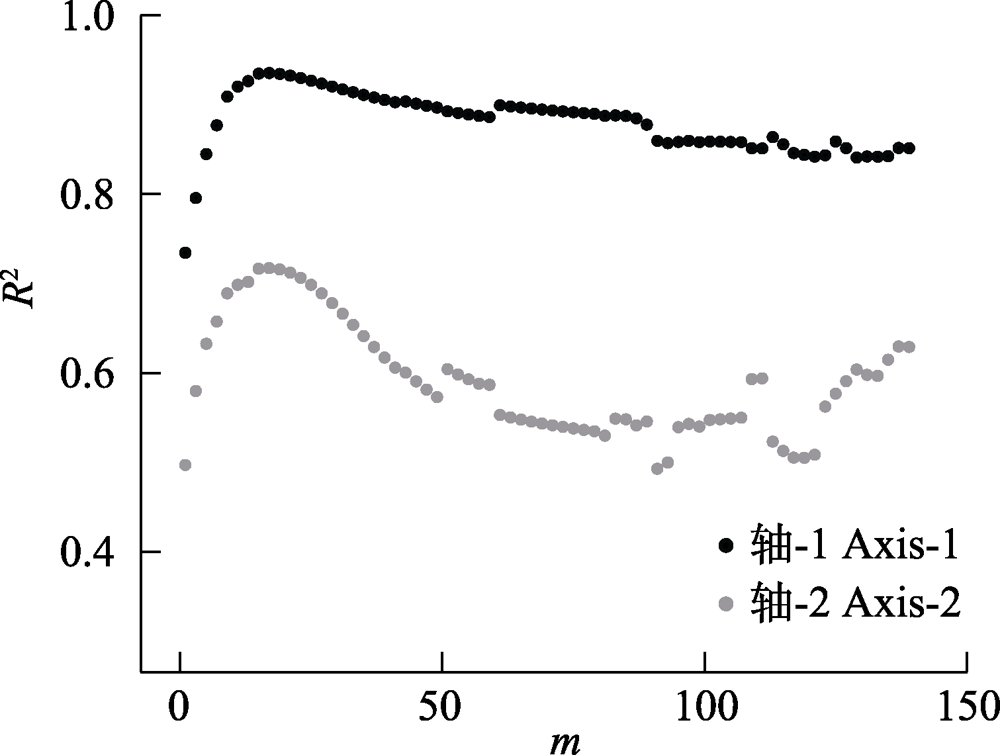
图3 基于弦标准化的预期共享物种数(CNESS)指数的主坐标分析(PCoA)排序产生的两个轴(Axis-1与Axis-2)与基于Chao-Jaccard的PCoA排序产生的两个轴分别进行线性回归后的回归系数(R2)在不同m值下的变化
Fig. 3 Linear regression value (R2) between respective axes (Axis-1 and Axis-2) that generated by chord-normalized expected species shared (CNESS) index based and Chao-Jaccard based principal coordinates analysis (PCoA) plots at different m values
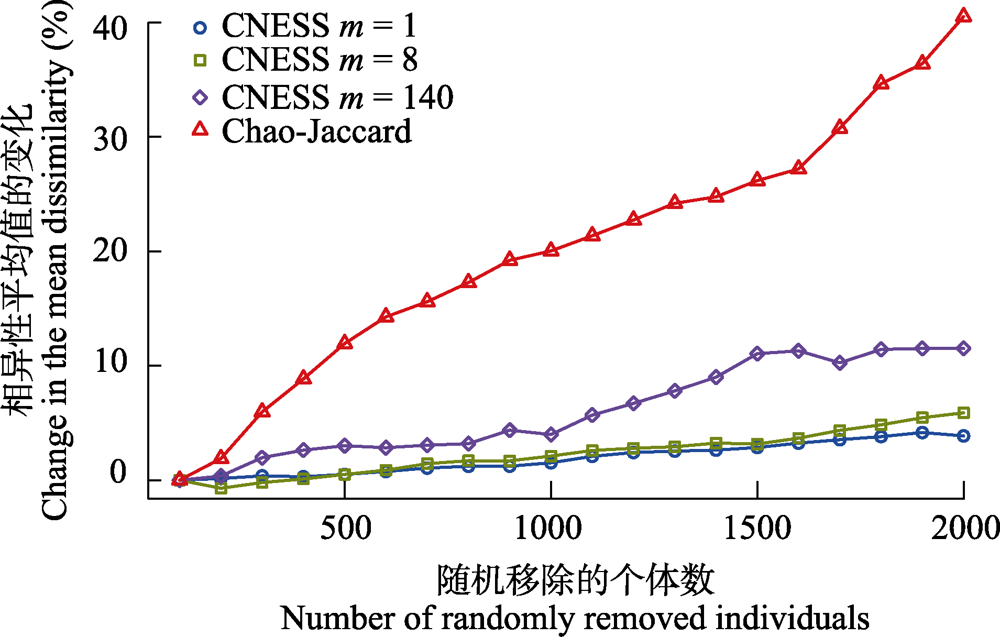
图4 弦标准化的预期共享物种数(CNESS) (m = 1、8和140)和Chao-Jaccard相异性的平均值的变化率与随机移除的个体数之间的关系
Fig. 4 Relationship between the changes of mean dissimilarity distance with the number of individuals randomly removed from the dataset for chord-normalized expected species shared (CNESS) index with different m value (m = 1, 8 and 140) and the Chao-Jaccard index
| [1] |
Beck J, Vun Khen C (2007) Beta-diversity of geometrid moths from northern Borneo: Effects of habitat, time and space. Journal of Animal Ecology, 76,230-237.
DOI URL |
| [2] |
Bonifácio P, Martínez Arbizu P, Menot L (2020) Alpha and beta diversity patterns of polychaete assemblages across the nodule province of the eastern Clarion-Clipperton Fracture Zone (equatorial Pacific). Biogeosciences, 17,865-886.
DOI URL |
| [3] | Borcard D, Legendre P (1994) Environmental control and spatial structure in ecological communities: An example using oribatid mites (Acari, Oribatei)(equatorial Pacific). Environmental and Ecological Statistics, 1,37-61. |
| [4] |
Chao A, Chazdon RL, Colwell RK, Shen TJ (2005) A new statistical approach for assessing similarity of species composition with incidence and abundance data. Ecology Letters, 8,148-159.
DOI URL |
| [5] | Chao A, Chiu C (2016) Species richness: Estimation and comparison. In: Wiley StatsRef: Statistics Reference Online (eds Balakrishnan N, Colton T, Everitt B, Piegorsch W, Ruggeri F, Teugels JL), pp. 1-26. John Wiley & Sons, Inc. |
| [6] |
Chen SB, Ouyang ZY, Xu WH, Xiao Y (2010) A review of beta diversity studies. Biodiversity Science, 18,323-335. (in Chinese with English abstract)
DOI |
|
陈圣宾, 欧阳志云, 徐卫华, 肖燚 (2010) Beta多样性研究进展. 生物多样性, 18,323-335.]
DOI |
|
| [7] |
Colwell RK, Chao A, Gotelli NJ, Lin SY, Mao CX, Chazdon RL, Longino JT (2012) Models and estimators linking individual-based and sample-based rarefaction, extrapolation and comparison of assemblages. Journal of Plant Ecology, 5,3-21.
DOI URL |
| [8] | Duan MC, Liu YH, Wang CL, Axmacher JC, Li LT, Yu ZR (2012) Diversity of geometrid moth (Lepidoptera: Geometridae) in cropland and reforested semi-natural habitats at different altitudes of Bashang Plateau, Hebei Province of China. Chinese Journal of Applied Ecology, 23,785-790. (in Chinese with English abstract) |
| 段美春, 刘云慧, 王长柳, Axmacher JC, 李良涛, 宇振荣 (2012) 坝上地区不同海拔农田和恢复半自然生境下尺蛾多样性. 应用生态学报, 23,785-790.] | |
| [9] | Gallagher ED (1998) Compah96. http://www.es.umb.edu/faculty/edg/files/pub/COMPAH.EXE (accessed on 2013-09-01) |
| [10] |
Grassle JF, Smith W (1976) A similarity measure sensitive to the contribution of rare species and its use in investigation of variation in marine benthic communities. Oecologia, 25,13-22.
DOI URL |
| [11] |
Hurlbert SH (1971) The nonconcept of species diversity: A critique and alternative parameters. Ecology, 52,577-586.
DOI PMID |
| [12] |
Koleff P, Gaston KJ, Lennon JJ (2003) Measuring beta diversity for presence-absence data. Journal of Animal Ecology, 72,367-382.
DOI URL |
| [13] |
Legendre P, Gallagher ED (2001) Ecologically meaningful transformations for ordination of species data. Oecologia, 129,271-280.
DOI PMID |
| [14] | Legendre P, Legendre L (2012) Numerical Ecology, 3rd edn. Elsevier, Amsterdam, |
| [15] |
Liu YH, Axmacher JC, Wang CL, Li LT, Yu ZR (2010) Ground beetles (Coleoptera: Carabidae) in the intensively cultivated agricultural landscape of Northern China—Implications for biodiversity conservation. Insect Conservation and Diversity, 3,34-43.
DOI URL |
| [16] | Ma KP (1994) Measurement of biotic community diversity. I. α diversity (Part 1). Chinese Biodiversity, 2,162-168. (in Chinese) |
| 马克平 (1994) 生物群落多样性的测度方法. I. α多样性的测度方法(上). 生物多样性, 2,162-168.] | |
| [17] | Melo AS (2014) CommEcol: Community Ecology Analyses. R package version 1.6.5. http://CRAN.R-project.org/package=CommEcol. (accessed on 2021-02-01) |
| [18] | Menot L (2019) ness: Hypergeometric standardization and probabilistic measures of similarity for community ecology. R package version 0.1.0, Zenodo. https://doi.org/10.5281/zenodo.3254750. (accessed on 2021-02-01) |
| [19] | Oksanen J, Blanchet FG, Kindt R, Legendre P, Minchin PR, O'Hara RB, Simpson GL, Solymos P, Stevens MRH, Wagner H (2018) vegan: Community Ecology Package. R package version 2.5-6. 10.1111/j.1654-1103.2003.tb02228.x. (accessed on 2021-02-01) |
| [20] | R Core Team (2020) R: A Language and Environment for Statistical Computing. Version 3.6.3, R Foundation for Statistical Computing, Vienna, Austria. |
| [21] | Schroeder PJ, Jenkins DG (2018) How robust are popular beta diversity indices to sampling error? Ecosphere, 9,e02100. |
| [22] |
Si XF, Zhao YH, Chen CW, Ren P, Zeng D, Wu LB, Ding P (2017) Beta-diversity partitioning: Methods, applications and perspectives. Biodiversity Science, 25,464-480. (in Chinese with English abstract)
DOI URL |
|
斯幸峰, 赵郁豪, 陈传武, 任鹏, 曾頔, 吴玲兵, 丁平 (2017) Beta多样性分解: 方法、应用与展望. 生物多样性, 25,464-480.]
DOI |
|
| [23] |
Simberloff D (1972) Properties of the rarefaction diversity measurement. The American Naturalist, 106,414-418.
DOI URL |
| [24] |
Smith W, Grassle JF (1977) Sampling properties of a family of diversity measures. Biometrics, 33,283-292.
DOI URL |
| [25] | Trueblood DD, Gallagher ED, Gould DM (1994) Three stages of seasonal succession on the Savin Hill Cove mudflat, Boston Harbor. Limnology and Oceanography,1440-1454. |
| [26] |
Tuomisto H (2010) A diversity of beta diversities: Straightening up a concept gone awry. Part 2. Quantifying beta diversity and related phenomena. Ecography, 33,23-45.
DOI URL |
| [27] |
Whittaker RH (1960) Vegetation of the Siskiyou Mountains, Oregon and California. Ecological Monographs, 30,279-338.
DOI URL |
| [28] |
Zou Y, Axmacher JC (2020) The Chord-Normalized Expected Species Shared (CNESS)-distance represents a superior measure of species turnover patterns. Methods in Ecology and Evolution, 11,273-280.
DOI |
| [29] | Zou Y, Axmacher JC (2021) Estimating the number of species shared by incompletely sampled communities. Ecography, 44,ecog.05625. |
| [30] |
Zou Y, Sang WG, Zhou HC, Huang LY, Axmacher JC (2014) Altitudinal diversity patterns of ground beetles (Coleoptera: Carabidae) in the forests of Changbai Mountain, Northeast China. Insect Conservation and Diversity, 7,161-171.
DOI URL |
| [1] | 张海龙, 聂海燕, 刘萌萌, 魏美才, 李泽建. 浙江乌岩岭叶蜂多样性分布及影响因素[J]. 生物多样性, 2026, 34(5): 25459-. |
| [2] | 张晋越, 卞宝乐, 唐泰然, 农文豪, 朱书峰, 卢新民. 植物-根际微生物互作及对昆虫胁迫的响应[J]. 生物多样性, 2026, 34(4): 25334-. |
| [3] | 周婷婷, 张浩淼, 王浩杰, 廖健, 陈晓丹, 杨楠, 韩博平, 刘振元. 广东省蜻蜓目物种多样性空间格局及关键影响因素[J]. 生物多样性, 2026, 34(2): 25337-. |
| [4] | 谷际岐, 赖江山, 王瑛, 吴浩然, 张雪, 宋晓彤, 邵小明, 娄安如. 联合物种分布模型与生物群落层次建模框架: 生态学理论、方法及应用[J]. 生物多样性, 2026, 34(1): 25364-. |
| [5] | 邹怡. α多样性指数选择: 不等量采样下的模拟比较[J]. 生物多样性, 2026, 34(1): 25278-. |
| [6] | 周昊, 王茗毅, 张楚格, 肖治术, 欧阳芳. 昆虫旅馆在独栖蜂多样性保护中的现状与挑战[J]. 生物多样性, 2025, 33(5): 24472-. |
| [7] | 农荞伊, 曹军, 程文达, 彭艳琼. 不同方法对蜜蜂总科昆虫资源与多样性监测效果的比较[J]. 生物多样性, 2025, 33(4): 25057-. |
| [8] | 刘志祥, 谢华, 张慧, 黄晓磊. 表皮碳氢化合物在社会性昆虫中的功能多样性及其调控[J]. 生物多样性, 2025, 33(2): 24302-. |
| [9] | 仝蟠龙, 张瀚文, 王艳梅, 王顺忠, 祝燕. 北京东灵山木本幼苗时间beta多样性的变化驱动因子[J]. 生物多样性, 2025, 33(11): 25309-. |
| [10] | 熊欢, 刘雪艳, 吴燕芳, 陈红州, 马妍, 胡星月, 张静宜, 夏瑨宇, 吴伟泽, 陈伟. 皖西大别山地区无尾两栖类alpha和beta多样性格局及其影响因素[J]. 生物多样性, 2025, 33(11): 25160-. |
| [11] | 刘振元, 张浩淼, 周婷婷, 镡雨欣, 韩博平. 广东省蜻蜓目物种名录和地理分布数据集[J]. 生物多样性, 2025, 33(10): 25348-. |
| [12] | 陈自宏, 张翼飞, 陈凯, 陈见影, 徐玲. 高黎贡山南段昆虫病原真菌物种多样性及影响因素[J]. 生物多样性, 2025, 33(1): 24228-. |
| [13] | 冯志荣, 陈明波, 杨小芳, 王刚, 董乙乂, 彭艳琼, 陈华燕, 王波. 榕树繁育系统及榕小蜂资源利用塑造了榕小蜂群落[J]. 生物多样性, 2024, 32(3): 23307-. |
| [14] | 赵榕江, 吴纪华, 何维明, 赵彩云, 周波, 李博, 杨强. 土壤生物多样性与外来植物入侵: 进展与展望[J]. 生物多样性, 2024, 32(11): 24243-. |
| [15] | 谭晓丹, 张鹏, 朱思睿, 刘向, 周淑荣, 刘木. 青藏高原高寒草甸灌丛化对圆穗蓼昆虫植食作用的影响[J]. 生物多样性, 2024, 32(1): 23417-. |
| 阅读次数 | ||||||
|
全文 |
|
|||||
|
摘要 |
|
|||||
备案号:京ICP备16067583号-7
Copyright © 2026 版权所有 《生物多样性》编辑部
地址: 北京香山南辛村20号, 邮编:100093
电话: 010-62836137, 62836665 E-mail: biodiversity@ibcas.ac.cn
![]()