
生物多样性 ›› 2019, Vol. 27 ›› Issue (3): 243-248. DOI: 10.17520/biods.2018327 cstr: 32101.14.biods.2018327
陈立军1,肖文宏1,肖治术1,2,*( )
)
收稿日期:2018-12-12
接受日期:2019-04-11
出版日期:2019-03-20
发布日期:2019-03-20
通讯作者:
肖治术
基金资助:
Chen Lijun1,Xiao Wenhong1,Xiao Zhishu1,2,*()
Received:2018-12-12
Accepted:2019-04-11
Online:2019-03-20
Published:2019-03-20
Contact:
Xiao Zhishu
摘要:
多度是衡量物种种群数量的参数之一, 多度的动态及其影响因素是种群生态学研究的经典问题。物种相对多度指数(relative abundance index, RAI)作为一种简单、便利的指标, 广泛应用于动物本底清查中。但RAI易受物种自身特征、探测率和环境因素的影响, 需要结合其他物种数量分析方法, 以验证其与种群大小的相关性。随着红外相机技术在野生动物调查中的广泛应用, 用红外相机数据估计动物种群数量的研究越来越多。目前, 基于红外相机数据计算RAI的方法有多种, 不同计算方法和应用范围存在差异, 亟需对现有方法和应用进行梳理。本文综述了根据红外相机数据计算物种相对多度的4种主要方法: (1)拍摄一张有效照片所需要的天数; (2)基于单位调查强度的物种拍摄率; (3)每个位点每天的物种拍摄率; (4)某一物种的照片数占所有物种的比例。总结了我国野生动物监测调查中采用红外相机方法计算RAI的应用现状。国内的研究主要采用第2种和第4种计算方法, 其中约72.5%的研究论文应用第2种计算方法, 而第4种方法一般适用于群落中的物种组成比较。我们建议根据红外相机数据计算RAI时尽量使用第2种计算方法, 这有助于研究或管理人员对不同研究中的物种RAI进行比较分析。
陈立军,肖文宏,肖治术 (2019) 物种相对多度指数在红外相机数据分析中的应用及局限. 生物多样性, 27, 243-248. DOI: 10.17520/biods.2018327.
Chen Lijun,Xiao Wenhong,Xiao Zhishu (2019) Limitations of relative abundance indices calculated from camera-trapping data. Biodiversity Science, 27, 243-248. DOI: 10.17520/biods.2018327.
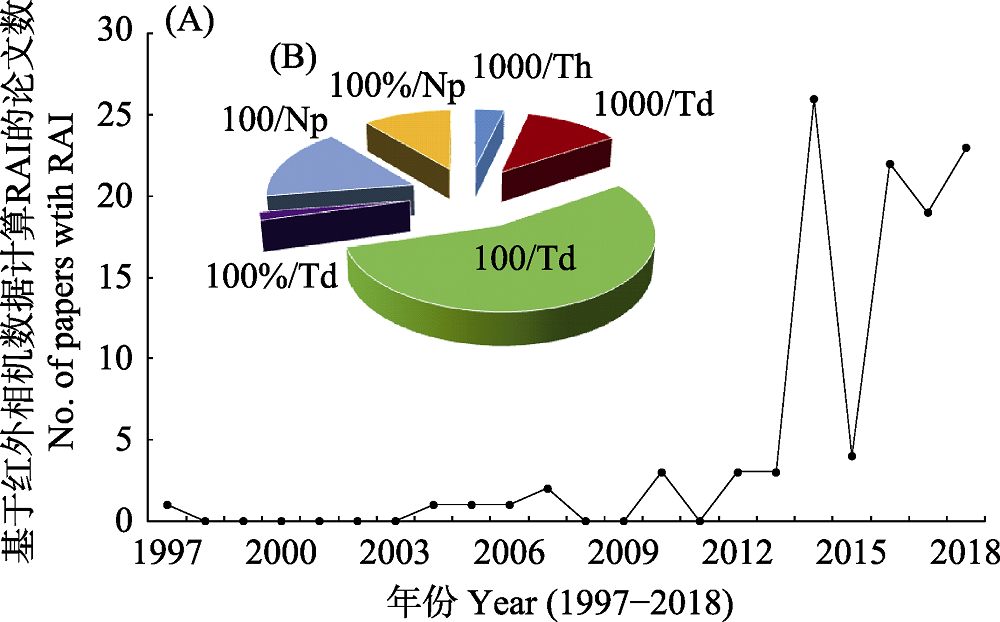
图1 我国基于红外相机数据计算相对多度指数(RAI)的编目论文统计分析(1997-2018)。(A)不同年份发表关于RAI的编目论文总数(N = 109); (B)不同RAI类型的文章比例, 以单位抽样时间内所拍摄的独立有效照片数来获得RAI_2 (N = 79), 包括以1,000 h为单位的论文(1000/Th, N = 4)、以1,000 d为单位的论文(1000/Td, N = 13)、以100 d为单位的论文(100/Td, N = 60)和以1 d为单位的论文(100%/Td, N = 2)等4种亚类型; 另一种则主要分析调查区域内每个物种占所有独立有效照片数的比例(N = 30), 包括每100或1,000张独立有效照片中的物种照片数(100/Np, N = 18)和物种的独立有效照片数占所有物种独立有效照片总数的比例(100%/Np, N = 12)。
Fig. 1 Summary about the papers of species inventory with the relative abundance index based on camera trapping data across China (from 1997 to 2018). (A) The camera-trapping papers in each year (N = 109); (B) These inventory papers with two key categories and six subtypes: one is to get the RAI based on the independent photo each unit of trapping effort (N = 79) with the unit of 1,000 h (1,000/Th, N = 4), 1,000 d (1,000/Td, N = 13), 100 d (100/Td, N = 60) and 1 d (100%/Td, N = 2); the other is to get the relative composition (N = 30), including species composition from 100 or 1,000 independent photo from a given site (100/Np, N = 18), and the proportion of each species among all independent photo from a given site (100%/Np, N = 12).
| 1 |
Azlan JM, Sharma DSK ( 2006) The diversity and activity patterns of wild felids in a secondary forest in Peninsular Malaysia. Oryx, 40, 36-41.
DOI URL |
| 2 |
Bengsen AJ, Leung LKP, Lapidge SJ, Gordon IJ ( 2011) Using a general index approach to analyze camera-trap abundance indices. Journal of Wildlife Management, 75, 1222-1227.
DOI URL |
| 3 |
Carbone C, Christie S, Conforti K, Coulson T, Franklin N, Ginsberg JR, Griffiths M, Holden J, Kawanishi K, Kinnaird M, Laidlaw R, Lynam A, Macdonald DW, Martyr D, McDougal C, Nath L, O’Brien T, Seidensticker J, Smith DJL, Sunquist M, Tilson R, Shahruddin WNW ( 2001) The use of photographic rates to estimate densities of tigers and other cryptic mammals. Animal Conservation, 4, 75-79.
DOI URL |
| 4 |
Carbone C, Christie S, Conforti K, Coulson T, Franklin N, Ginsberg JR, Griffiths M, Holden J, Kinnaird M, Laidlaw R, Lynam A, MacDonald DW, Martyr D, McDougal C, Nath L, O’Brien T, Seidensticker J, Smith JLD, Tilson R, Shahruddin WNW ( 2002) The use of photographic rates to estimate densities of cryptic mammals: Response to Jennelle et al. Animal Conservation, 5, 121-123.
DOI URL |
| 5 |
Chandler RB, Royle JA ( 2013) Spatially explicit models for inference about density in unmarked or partially marked populations. The Annals of Applied Statistics, 7, 936-954.
DOI URL |
| 6 |
Diao KP, Li MF, Pan SY, Gu WL, Zhang XO, Wen C ( 2017) Role of vertebrates in wild animal corpses degradation process by camera trap in Tangjiahe National Nature Reserve. Sichuan Journal of Zoology, 36, 616-623. (in Chinese with English abstract)
DOI URL |
|
[ 刁鲲鹏, 李明富, 潘世玥, 顾伟龙, 张晓鸥, 闻丞 ( 2017) 基于红外相机研究脊椎动物在唐家河国家级自然保护区动物尸体分解过程中的作用. 四川动物, 36, 616-623.]
DOI URL |
|
| 7 |
Engeman RM ( 2005) Indexing principles and a widely applicable paradigm for indexing animal populations. Wildlife Research, 32, 203-210.
DOI URL |
| 8 |
Engeman RM, Massei G, Sage M, Gentle MN ( 2013) Monitoring wild pig populations: A review of methods. Environmental Science and Pollution Research, 20, 8077-8091.
DOI URL PMID |
| 9 |
Jennelle CS, Runge MC, MacKenzie DI ( 2002) The use of photographic rates to estimate densities of tigers and other cryptic mammals: A comment on misleading conclusions. Animal Conservation, 5, 119-120.
DOI URL |
| 10 | Kawanishi K, Sahak AM, Sunquist M ( 1999) Preliminaty analysis on abundance of large mammals at Sungai Relau, Taman Negara. The Journal of Wildlife and Parks, 17, 62-82. |
| 11 |
Li S, McShea WJ, Wang DJ, Shao LK, Shi XG ( 2010) The use of infrared-triggered cameras for surveying phasianids in Sichuan Province, China. Ibis, 152, 299-309.
DOI URL |
| 12 |
Li S, Wang DJ, Xiao ZS, Li XH, Wang TM, Feng LM, Wang Y ( 2014) Camera-trapping in wildlife research and conservation in China: Review and outlook. Biodiversity Science, 22, 685-695. (in Chinese with English abstract)
DOI URL |
|
[ 李晟, 王大军, 肖治术, 李欣海, 王天明, 冯利民, 王云 ( 2014) 红外相机技术在我国野生动物研究与保护中的应用与前景. 生物多样性, 22, 685-695.]
DOI URL |
|
| 13 |
Li S, Wang DJ, Bu HL, Liu XG, Jin T ( 2016) Camera-trapping survey on the mammal diversity in the Laohegou Nature Reserve, Sichuan Province. Acta Theriologica Sinica, 36, 282-291. (in Chinese with English abstract)
DOI URL |
|
[ 李晟, 王大军, 卜红亮, 刘小庚, 靳彤 ( 2016) 四川省老河沟自然保护区兽类多样性红外相机调查. 兽类学报, 36, 282-291.]
DOI URL |
|
| 14 |
Liu X, Wu P, Songer M, Cai Q, He X, Zhu Y, Shao X ( 2013) Monitoring wildlife abundance and diversity with infra-red camera traps in Guanyinshan Nature Reserve of Shaanxi Province, China. Ecological Indicators, 33, 121-128.
DOI URL |
| 15 |
MacKenzie DI, Nichols JD, Lachman GB, Droege S, Royle JA, Langtimm CA ( 2002) Estimating site occupancy rates when detection probabilities are less than one. Ecology, 83, 2248-2255.
DOI URL |
| 16 |
Moeller AK, Lukacs PM, Horne JS ( 2018) Three novel methods to estimate abundance of unmarked animals using remote cameras. Ecosphere, 9, e02331.
DOI URL |
| 17 |
O’Brien TG, Kinnaird MF, Wibisono HT ( 2003) Crouching tigers, hidden prey: Sumatran tiger and prey populations in a tropical forest landscape. Animal Conservation, 6, 131-139.
DOI URL |
| 18 | Pei KJ, Chen CT, Wu ST, Teng MC ( 1997) Use of auto-trigger camera and geographic information system to study spatial distribution of forest wildlife. Quarterly Journal of Chinese Forestry, 30, 279-289. (in Chinese with English abstract) |
| [ 裴家骐, 陈朝圳, 吴守从, 胜民强 ( 1997) 利用自动照相机设备与地理资讯系统研究森林野生动物族群之空间分布利用. 中华林学季刊, 30, 279-289.] | |
| 19 |
Pollock KH, Nichols JD, Simons TR, Farnsworth GL, Bailey LL, Sauer JR ( 2002) Large scale wildlife monitoring studies: Statistical methods for design and analysis. Environmetrics, 13, 105-119.
DOI URL |
| 20 |
Rovero F, Marshall AR ( 2009) Camera trapping photographic rate as an index of density in forest ungulates. Journal of Applied Ecology, 46, 1011-1017.
DOI URL |
| 21 |
Rowcliffe JM, Field J, Turvey ST, Carbone C ( 2008) Estimating animal density using camera traps without the need for individual recognition. Journal of Applied Ecology, 45, 1228-1236.
DOI URL |
| 22 |
Royle JA ( 2004) N-mixture models for estimating population size from spatially replicated counts. Biometrics, 60, 108-115.
DOI URL PMID |
| 23 |
Royle JA, Nichols JD ( 2003) Estimating abundance from repeated presence-absence data or point counts. Ecology, 84, 777-790.
DOI URL |
| 24 |
Sollmann R, Mohamed A, Samejima H, Wilting A ( 2013) Risky business or simple solution-relative abundance indices from camera-trapping. Biological Conservation, 159, 405-412.
DOI URL |
| 25 |
Sun JX, Li JQ, Wan YQ, Li S, Guan TP, Wang J, Xia WC, Xu HG ( 2018) Study on the activity rhythms of nine ungulates in summer and autumn in Sichuan. Journal of Ecology and Rural Environment, 34, 1003-1009. (in Chinese with English abstract)
DOI URL |
|
[ 孙佳欣, 李佳琦, 万雅琼, 李晟, 官天培, 王杰, 夏万才, 徐海根 ( 2018) 四川9种有蹄类动物夏秋季活动节律研究. 生态与农村环境学报, 34, 1003-1009.]
DOI URL |
|
| 26 | Sun RY ( 2001) Principles of Animal Ecology, 3rd edn. Beijing Normal University Press, Beijing. (in Chinese) |
| [ 孙儒泳 ( 2001) 动物生态学原理, 第三版. 北京师范大学出版社, 北京.] | |
| 27 |
Ulrich W, Ollik M ( 2005) Limits to the estimation of species richness: The use of relative abundance distributions. Diversity and Distributions, 11, 265-273.
DOI URL |
| 28 | Wu PF, Liu XH, Cai Q, He XB, Songer M, Zhu Y, Shao XM ( 2012) The application of infrared camera in mammal research in Guanyinshan Nature Reserve, Shaanxi. Acta Theriologica Sinica, 32, 67-71. (in Chinese with English abstract) |
| [ 武鹏峰, 刘雪华, 蔡琼, 何祥博, Songer M, 朱云, 邵小明 ( 2012) 红外相机技术在陕西观音山自然保护区兽类监测研究中的应用. 兽类学报, 32, 67-71.] | |
| 29 | Xiao WH, Hu L, Huang XQ, Xiao ZS ( 2019 a) Using capture-recapture models in wildlife camera-trapping monitoring and the study case. Biodiversity Science, 27, 257-265. (in Chinese with English abstract) |
| [ 肖文宏, 胡力, 黄小群, 肖治术 ( 2019 a) 基于标记-重捕模型开展野生动物红外相机种群监测的方法及案例. 生物多样性, 27, 257-265.] | |
| 30 | Xiao WH, Shu ZF, Chen LJ, Yao WT, Ma Y, Zhang YM, Xiao ZS ( 2019 b) Using occupancy models in wildlife camera-trapping monitoring and the study case. Biodiversity Science, 27, 249-256. (in Chinese with English abstract) |
| [ 肖文宏, 束祖飞, 陈立军, 姚武韬, 马勇, 张应明, 肖治术 ( 2019 b) 占域模型的原理及在野生动物红外相机研究中的应用案例. 生物多样性, 27, 249-256.] | |
| 31 |
Xiao ZS, Li XH, Jiang GS ( 2014) Applications of camera trapping to wildlife surveys in China. Biodiversity Science, 22, 683-684. (in Chinese)
DOI URL |
|
[ 肖治术, 李欣海, 姜广顺 ( 2014) 红外相机技术在我国野生动物监测研究中的应用. 生物多样性, 22, 683-684.]
DOI URL |
|
| 32 |
Yu GQ, Kang ZJ, Liu MS, Chen ZF, Deng ZC ( 2018) Preliminary survey using infrared camera reveals fauna and avifauna diversity at Hupingshan National Nature Reserve, Hunan, China. Acta Theriologica Sinica, 38, 104-112. (in Chinese with English abstract)
DOI URL |
|
[ 于桂清, 康祖杰, 刘美斯, 陈振法, 邓忠次 ( 2018) 利用红外相机对湖南壶瓶山国家级自然保护区兽类和鸟类多样性的初步调查. 兽类学报, 38, 104-112.]
DOI URL |
|
| 33 | Zhang SS, Bao YX, Wang YN, Fang PF, Ye B ( 2012) Comparisons of different camera trap placement patterns in monitoring mammal resources in Gutianshan National Nature Reserve. Chinese Journal of Ecology, 31, 2016-2022. (in Chinese with English abstract) |
| [ 章书声, 鲍毅新, 王艳妮, 方平福, 叶彬 ( 2012) 不同相机布放模式在古田山兽类资源监测中的比较. 生态学杂志, 31, 2016-2022.] |
| [1] | 罗敏, 杨永川, 靳程, 周礼华, 龙宇潇. 城市森林兽类组成特征及人类活动的影响——以重庆中心城区为例[J]. 生物多样性, 2025, 33(5): 24402-. |
| [2] | 龚翠凤, 韦伟, 罗概, 韩一敏, 吴鹏程, 何梦楠, 闵清悦, 付强, 陈鹏. 大熊猫国家公园崇州片区有蹄类动物空间分布及共存关系[J]. 生物多样性, 2025, 33(3): 24260-. |
| [3] | 王大伟, 程帅, 冯佳伟, 王天明. 东北地区张广才岭2015-2020年野生动物红外相机监测数据集[J]. 生物多样性, 2025, 33(2): 24384-. |
| [4] | 卢佳玉, 石小亿, 多立安, 王天明, 李治霖. 基于红外相机技术的天津城市地栖哺乳动物昼夜活动节律评价[J]. 生物多样性, 2024, 32(8): 23369-. |
| [5] | 苏荣菲, 陈睿山, 俞霖琳, 吴婧彬, 康燕. 基于红外相机调查的上海市长宁区社区生境花园生物多样性[J]. 生物多样性, 2024, 32(8): 24068-. |
| [6] | 高翔, 潘淑芳, 孙争争, 李霁筱, 高天雨, 董路, 王宁. 广东珠海凤凰山和淇澳岛小灵猫的分布与活动节律[J]. 生物多样性, 2024, 32(8): 24045-. |
| [7] | 张明军, 王合升, 颜文博, 符运南, 王琦, 曾治高. 海南大田国家级自然保护区小灵猫的活动节律与栖息地选择[J]. 生物多样性, 2024, 32(6): 23420-. |
| [8] | 冉辉, 杨天友, 米小其. 贵州省爬行动物更新名录[J]. 生物多样性, 2024, 32(4): 23348-. |
| [9] | 王启蕃, 刘小慧, 朱紫薇, 刘磊, 王鑫雪, 汲旭阳, 周绍春, 张子栋, 董红雨, 张明海. 黑龙江北极村国家级自然保护区鸟类与兽类多样性[J]. 生物多样性, 2024, 32(4): 24024-. |
| [10] | 麦晓烔, 康佳, 李梓琛, 王天明. 东北虎豹国家公园梅花鹿活动节律及其对道路的响应[J]. 生物多样性, 2024, 32(11): 24178-. |
| [11] | 杜诚, 汪远, 闫小玲, 严靖, 李惠茹, 张庆费, 胡永红. 上海市植物物种多样性组成和历史变化暨上海维管植物名录更新(2022版)[J]. 生物多样性, 2023, 31(6): 23093-. |
| [12] | 楼晨阳, 任海保, 陈小南, 米湘成, 童冉, 朱念福, 陈磊, 吴统贵, 申小莉. 钱江源国家公园森林群落的物种多样性、结构多样性及其对黑麂出现概率的影响[J]. 生物多样性, 2023, 31(6): 22518-. |
| [13] | 赵坤明, 陈圣宾, 杨锡福. 基于红外相机技术调查四川都江堰破碎化森林鸟兽多样性及优势种活动节律[J]. 生物多样性, 2023, 31(6): 22529-. |
| [14] | 陈本平, 陈建武, 凌征文, 杨旭, 陈鑫, 李生强, 杨彪. 四川老君山国家级自然保护区林下鸟兽多样性及动态变化数据集[J]. 生物多样性, 2023, 31(5): 22566-. |
| [15] | 李珍珍, 杜梦甜, 朱原辛, 王大伟, 李治霖, 王天明. 基于红外相机的不可个体识别动物种群密度估算方法[J]. 生物多样性, 2023, 31(3): 22422-. |
| 阅读次数 | ||||||
|
全文 |
|
|||||
|
摘要 |
|
|||||
备案号:京ICP备16067583号-7
Copyright © 2026 版权所有 《生物多样性》编辑部
地址: 北京香山南辛村20号, 邮编:100093
电话: 010-62836137, 62836665 E-mail: biodiversity@ibcas.ac.cn
![]()