

生物多样性 ›› 2026, Vol. 34 ›› Issue (5): 25482. DOI: 10.17520/biods.2025482 cstr: 32101.14.biods.2025482
周丽芳1,2( ), 慈秀芹1,*()(
 ), 陈筠灵1,2(), 苏艳萍1, 申健勇1, 李捷1,*()()
收稿日期:2025-11-28
接受日期:2026-04-06
出版日期:2026-05-20
发布日期:2026-07-01
通讯作者:
慈秀芹,李捷
基金资助:
Lifang Zhou1,2(), Xiuqin Ci1,*()(), Junling Chen1,2(), Yanping Su1, Jianyong Shen1, Jie Li1,*()()
Received:2025-11-28
Accepted:2026-04-06
Online:2026-05-20
Published:2026-07-01
Contact:
Xiuqin Ci, Jie Li
Supported by:摘要:
引种植物能否长期存活是评估迁地保护有效性的关键。为探究引种植物在热带植物园户外存活状况及环境因子的影响, 本研究以中国科学院西双版纳热带植物园引种的1,232个物种共2,234株植物为研究对象, 基于混合效应Cox比例风险模型, 量化评估了热带植物园与植物分布地之间气候与土壤差异对其存活的独立影响。结果表明, 在气候因子驱动的模型中, 基于物种分布地气候中位数构建的模型获得最高经验支持, 生长型、年均温和最冷月最低温对引种植物存活具有主要影响, 降水因子(年降水量、最干月降水量和最湿月降水量)的影响相对较弱但也达到显著水平, 且草本植物的死亡风险低于木本植物。在土壤因子驱动的模型中, 基于种源地土壤差异构建的模型获得最高经验支持, 土壤表层有机碳含量和碎石体积百分比是影响引种植物存活的主要因子, 且草本植物的死亡风险高于木本植物。在制定引种策略时, 优先考虑热带植物园与物种分布地气候特征和种源地土壤条件的匹配性, 可提高引种植物存活率并提升热带植物园迁地保护成效。
周丽芳, 慈秀芹, 陈筠灵, 苏艳萍, 申健勇, 李捷 (2026) 基于混合效应Cox比例风险模型评估气候与土壤对热带引种植物存活的影响. 生物多样性, 34, 25482. DOI: 10.17520/biods.2025482.
Lifang Zhou, Xiuqin Ci, Junling Chen, Yanping Su, Jianyong Shen, Jie Li (2026) Assessing plant survival in tropical botanical gardens based on climatic and soil factors using mixed-effects Cox proportional hazards models. Biodiversity Science, 34, 25482. DOI: 10.17520/biods.2025482.
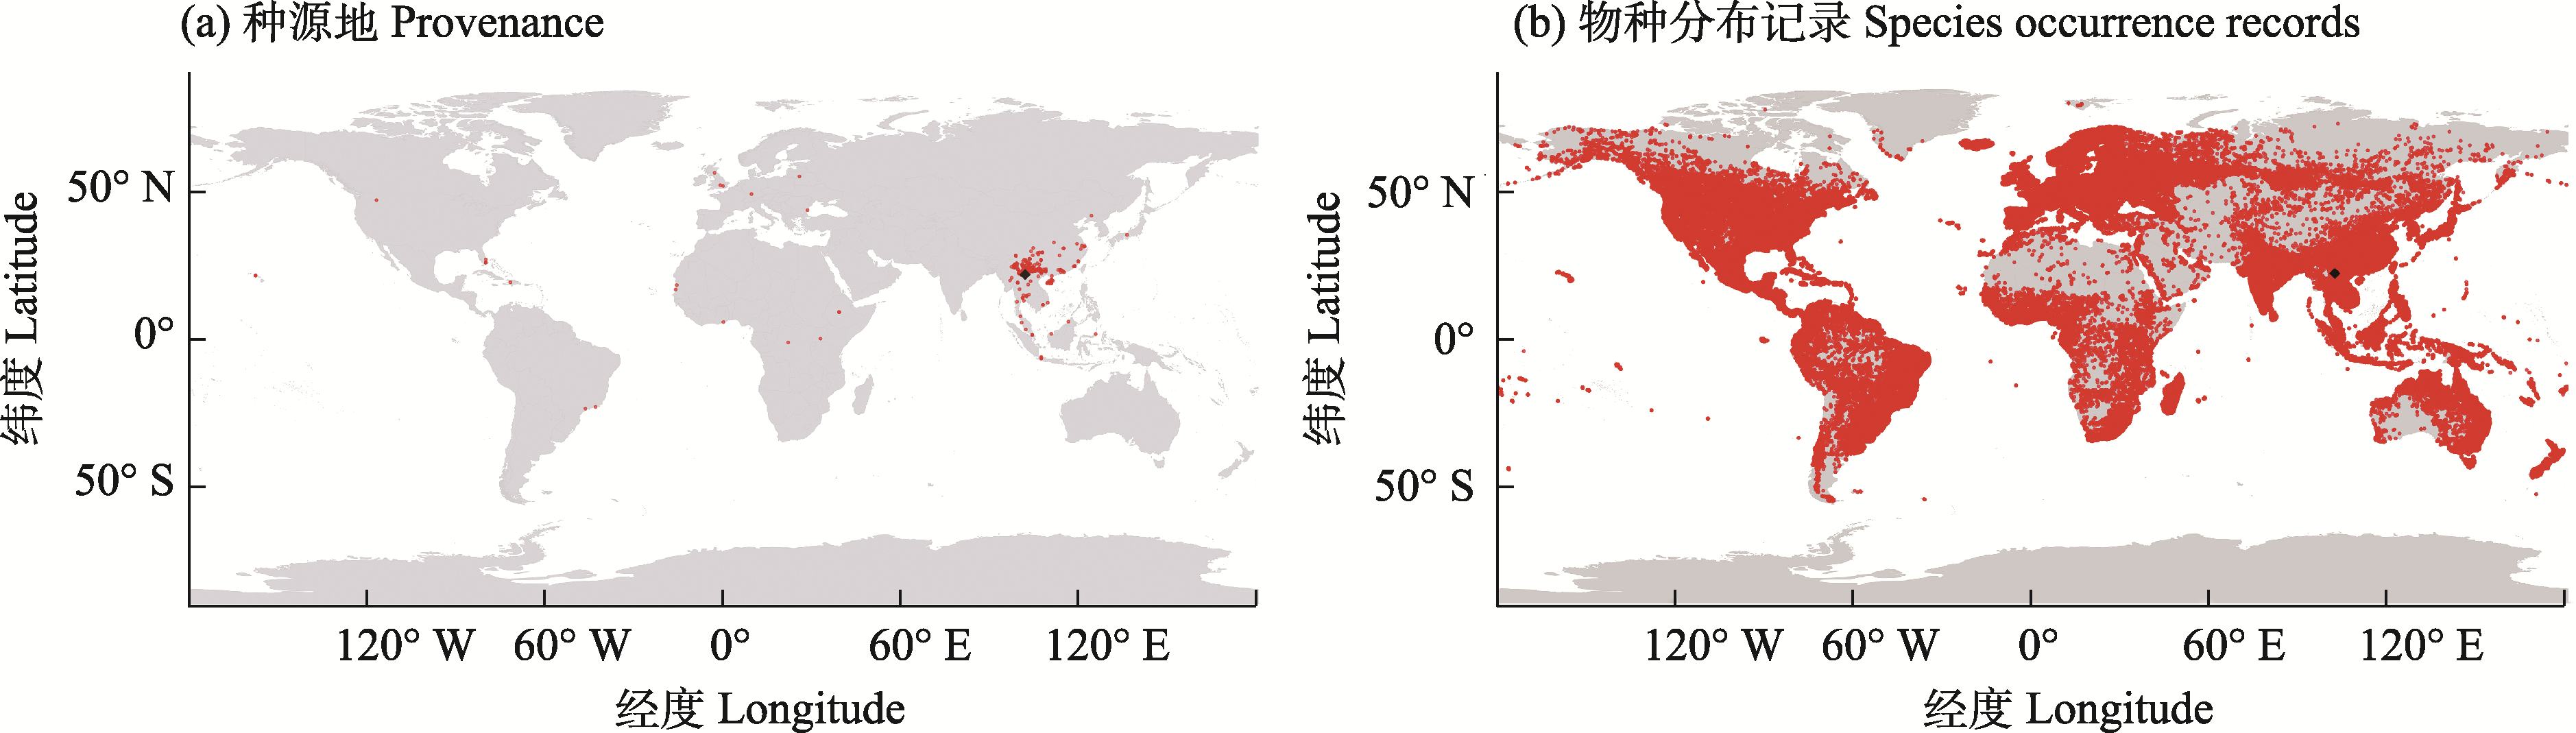
图1 本研究引种植物种源地(a)与物种分布记录(b)的地理分布。繁殖体来自435个种源地, 由中国科学院西双版纳热带植物园(XTBG)通过野外采集、与其他植物园交换及购买获得。本研究共涵盖1,232个物种, 其3,152,039条分布记录源自全球生物多样性信息网络(GBIF, https://www.gbif.org/) (已剔除异常值)。各物种分布记录数量的中位数为47, 平均值为2,767 (1-500,332)。XTBG的位置(21°41′ N, 101°25′ E)以黑色菱形符号标示, (a)和(b)中的红色实心圆分别代表各种源地和各物种分布地的位置。
Fig. 1 Geographic distribution of provenance (a) and species occurrence records (b) for introduced plants included in this study. Propagules were obtained from 435 provenances through field collection, exchange with other botanical gardens, and purchase, all coordinated by the Xishuangbanna Tropical Botanical Garden, Chinese Academy of Sciences (XTBG). This study includes 1,232 species, with 3,152,039 occurrence records obtained from the Global Biodiversity Information Facility (GBIF, https://www.gbif.org/) and cleaned by removing outliers. The number of occurrence records per species had a median of 47, a mean of 2,767, and ranged from 1 to 500,332. The location of XTBG (21°41′ N, 101°25′ E) is marked by a black diamond. Red circles indicate provenance in (a) and species occurrence records in (b).
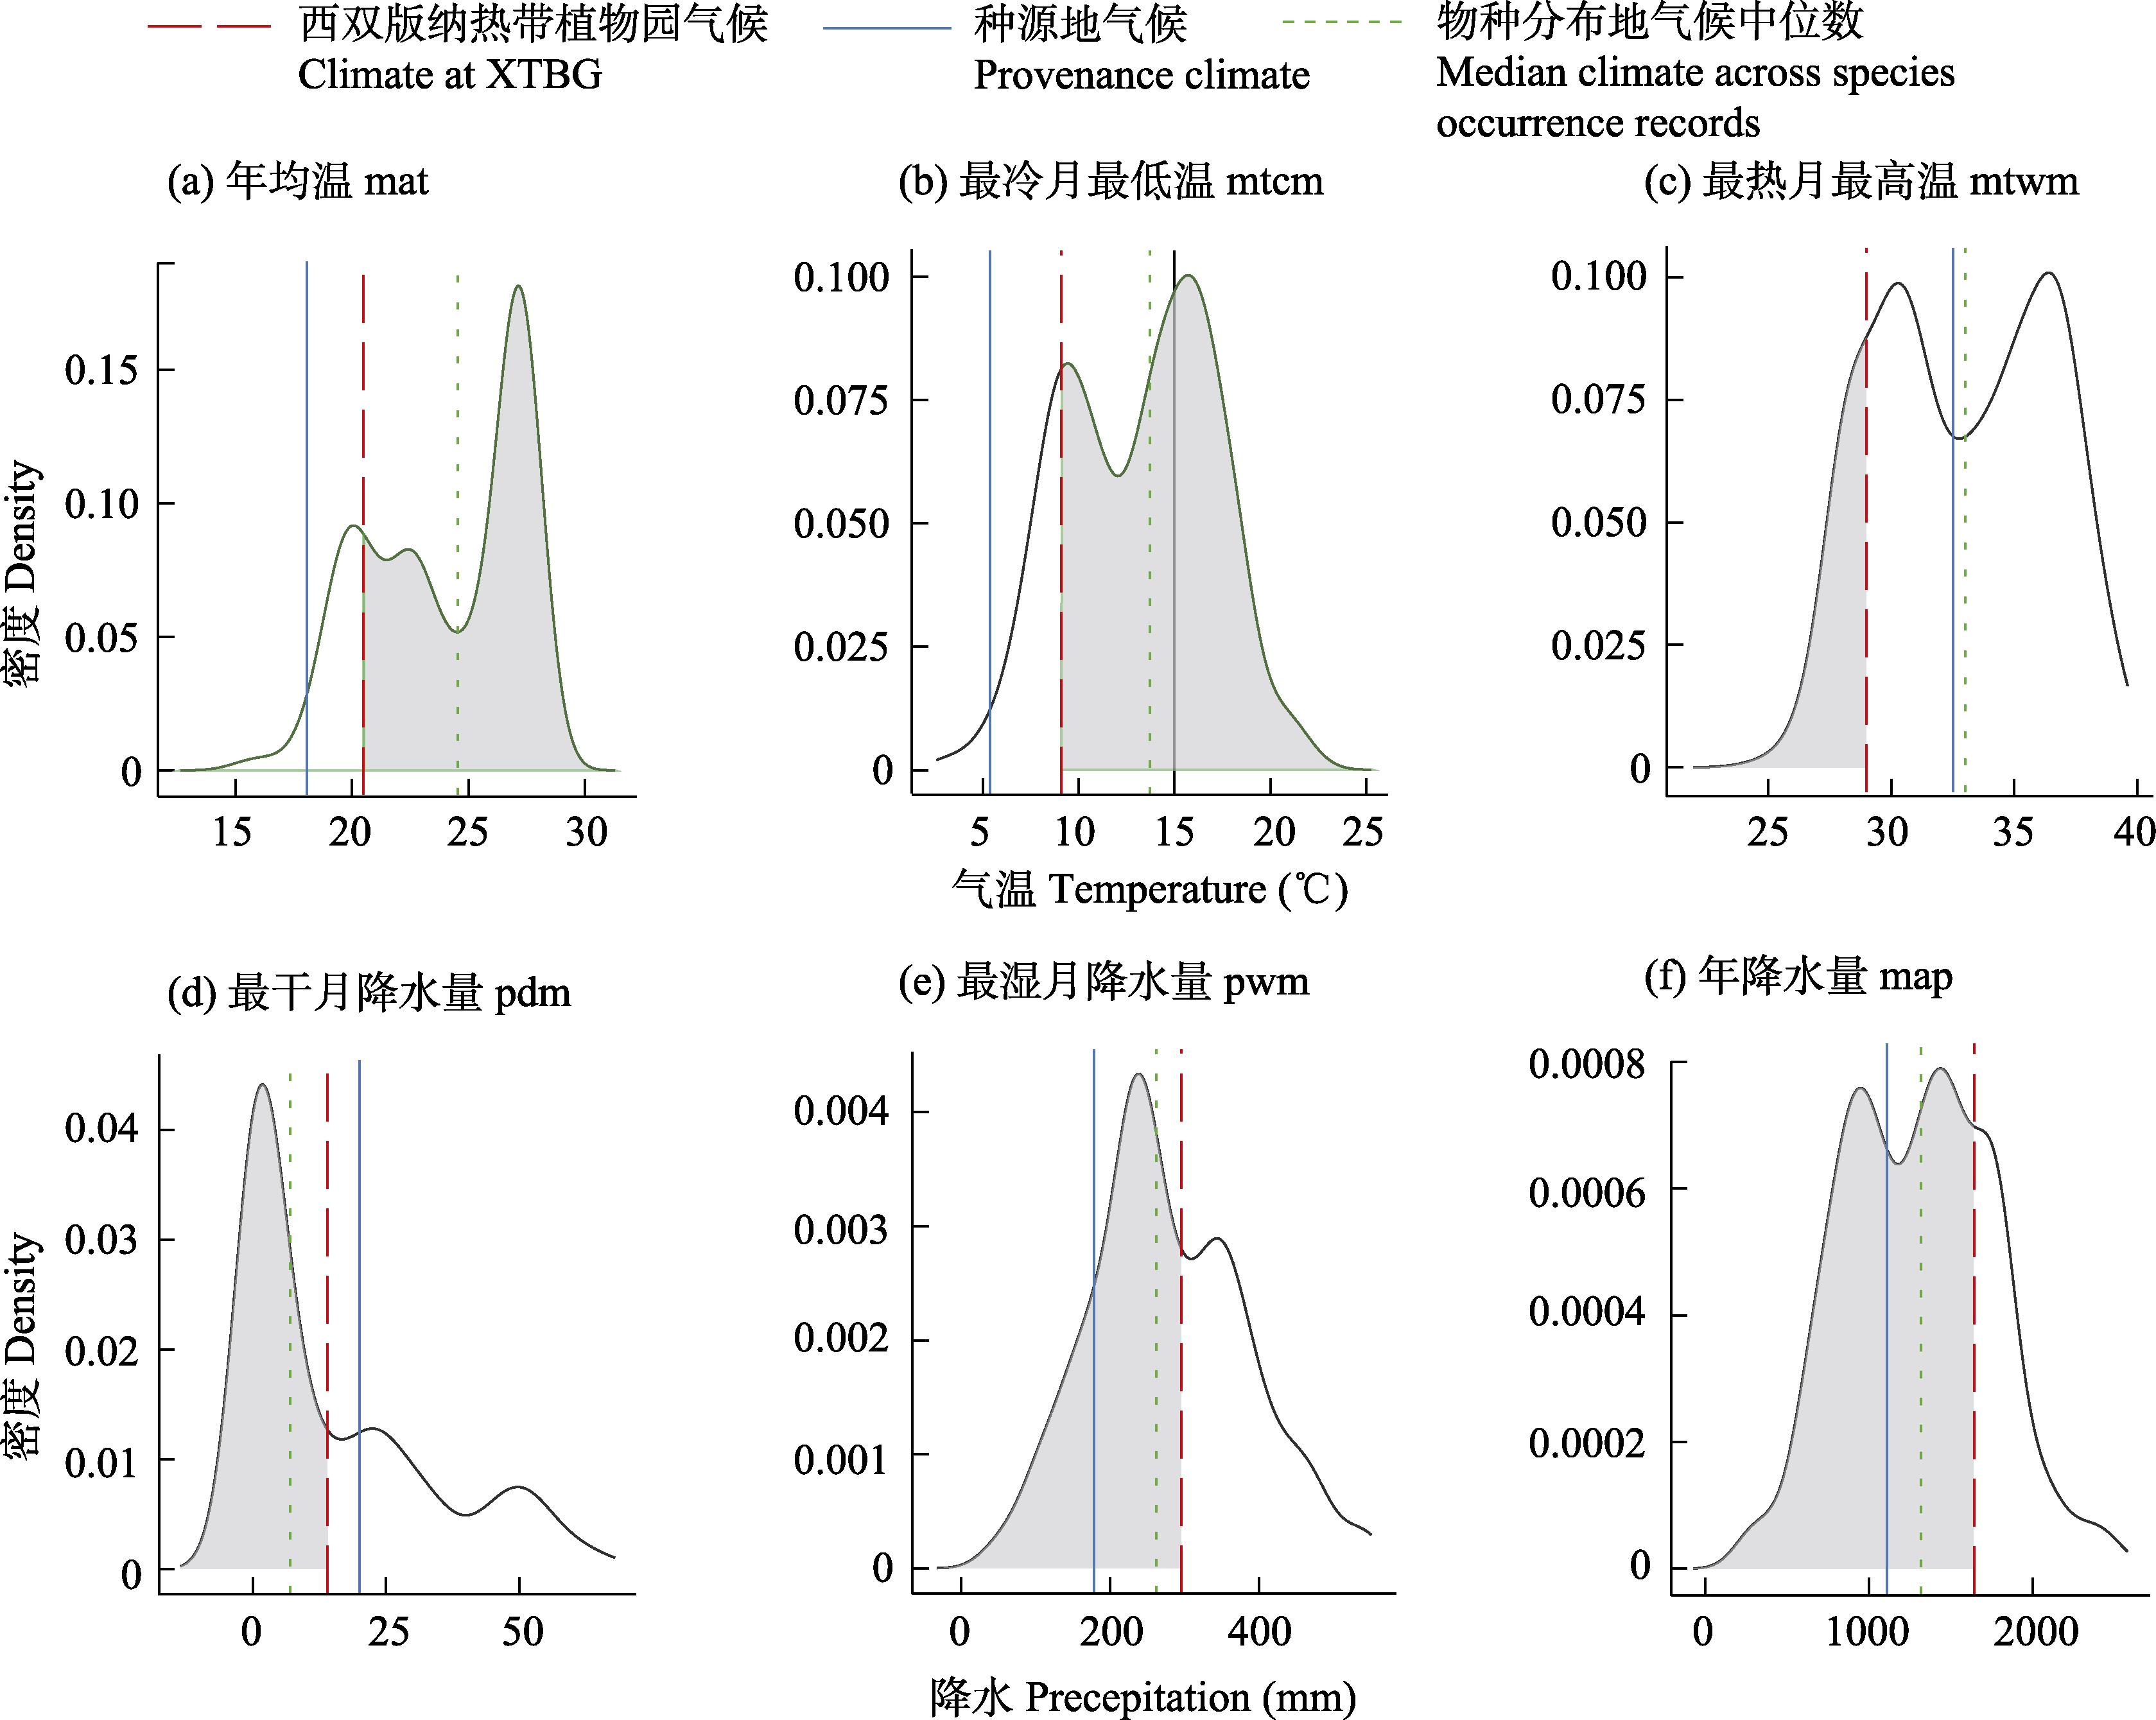
图2 基于物种整体分布点计算气候条件较中国科学院西双版纳热带植物园(XTBG)更为极端的比例。以研究物种黄葛树(Ficus viren)为例进行图示说明: 红色长虚线表示XTBG的气候参数值, 蓝色线表示种源地气候, 绿色短虚线表示物种分布地气候中位数, 灰色阴影曲线为采用核密度估计构建的物种气候分布密度(分布点气候数据基于GBIF分布记录与WorldClim 2.1气候数据匹配提取)。该指标通过计算物种分布区中较XTBG气候更为极端一侧的累积比例获得。具体计算规则如下: 最冷月最低温(mtcm)取分布点中较XTBG更温暖者所占比例; 最热月最高温(mtwm)取较XTBG更寒冷者所占比例; 年均温(mat)依据物种分布区气候中位数与XTBG的相对关系确定, 若中位数低于XTBG, 则计算低于XTBG的分布点比例, 反之则计算高于XTBG的分布点比例。降水变量统一计算低于XTBG降水值的分布点比例。该方法以物种气候生态位整体为参照, 区别于基于单一繁殖体来源地的局域适应假设, 适用于气候耐受性由广适基因型主导的情形。
Fig. 2 Climatic differences between Xishuangbanna Tropical Botanical Garden, Chinese Academy of Sciences (XTBG) and the distribution of plants in the wild based on the proportion of the climatic distribution of each species that was more extreme than the climate at XTBG, illustrated with one of the study species: Ficus virens. Red long-dashed vertical lines indicate the climatic parameter values at XTBG; blue lines indicate the climate at the provenance; green short-dashed vertical lines indicate the median climate across occurrence records of the species; and gray shaded curves represent the density of the species climatic distribution constructed using kernel density estimation, with climatic data for occurrence records extracted by matching GBIF distribution records with WorldClim 2.1. This metric was derived by calculating the cumulative proportion of species occurrence records falling on the side more extreme than the XTBG threshold. Specifically, for minimum temperature of coldest month (mtcm), we calculated the proportion of occurrence records with temperatures warmer than that at XTBG; for maximum temperature of warmest month (mtwm), we calculated the proportion of occurrence records with temperatures colder than that at XTBG. For mean annual temperature (mat), the metric depended on the relative position between the species median and XTBG: When the species median was lower, we calculated the proportion of occurrence records with temperatures lower than that at XTBG; otherwise, we calculated the proportion of occurrence records with temperature higher than that at XTBG. For precipitation variables—annual precipitation (map), precipitation of driest month (pdm), and precipitation of wettest month (pwm)—we consistently calculated the proportion of occurrence records with precipitation lower than that at XTBG. This approach emphasizes climatic properties of the whole species distribution, as opposed to propagule provenance under the assumption of local adaptation, and may be useful when species’ climatic niches are largely determined by the tolerance of generalist genotypes.
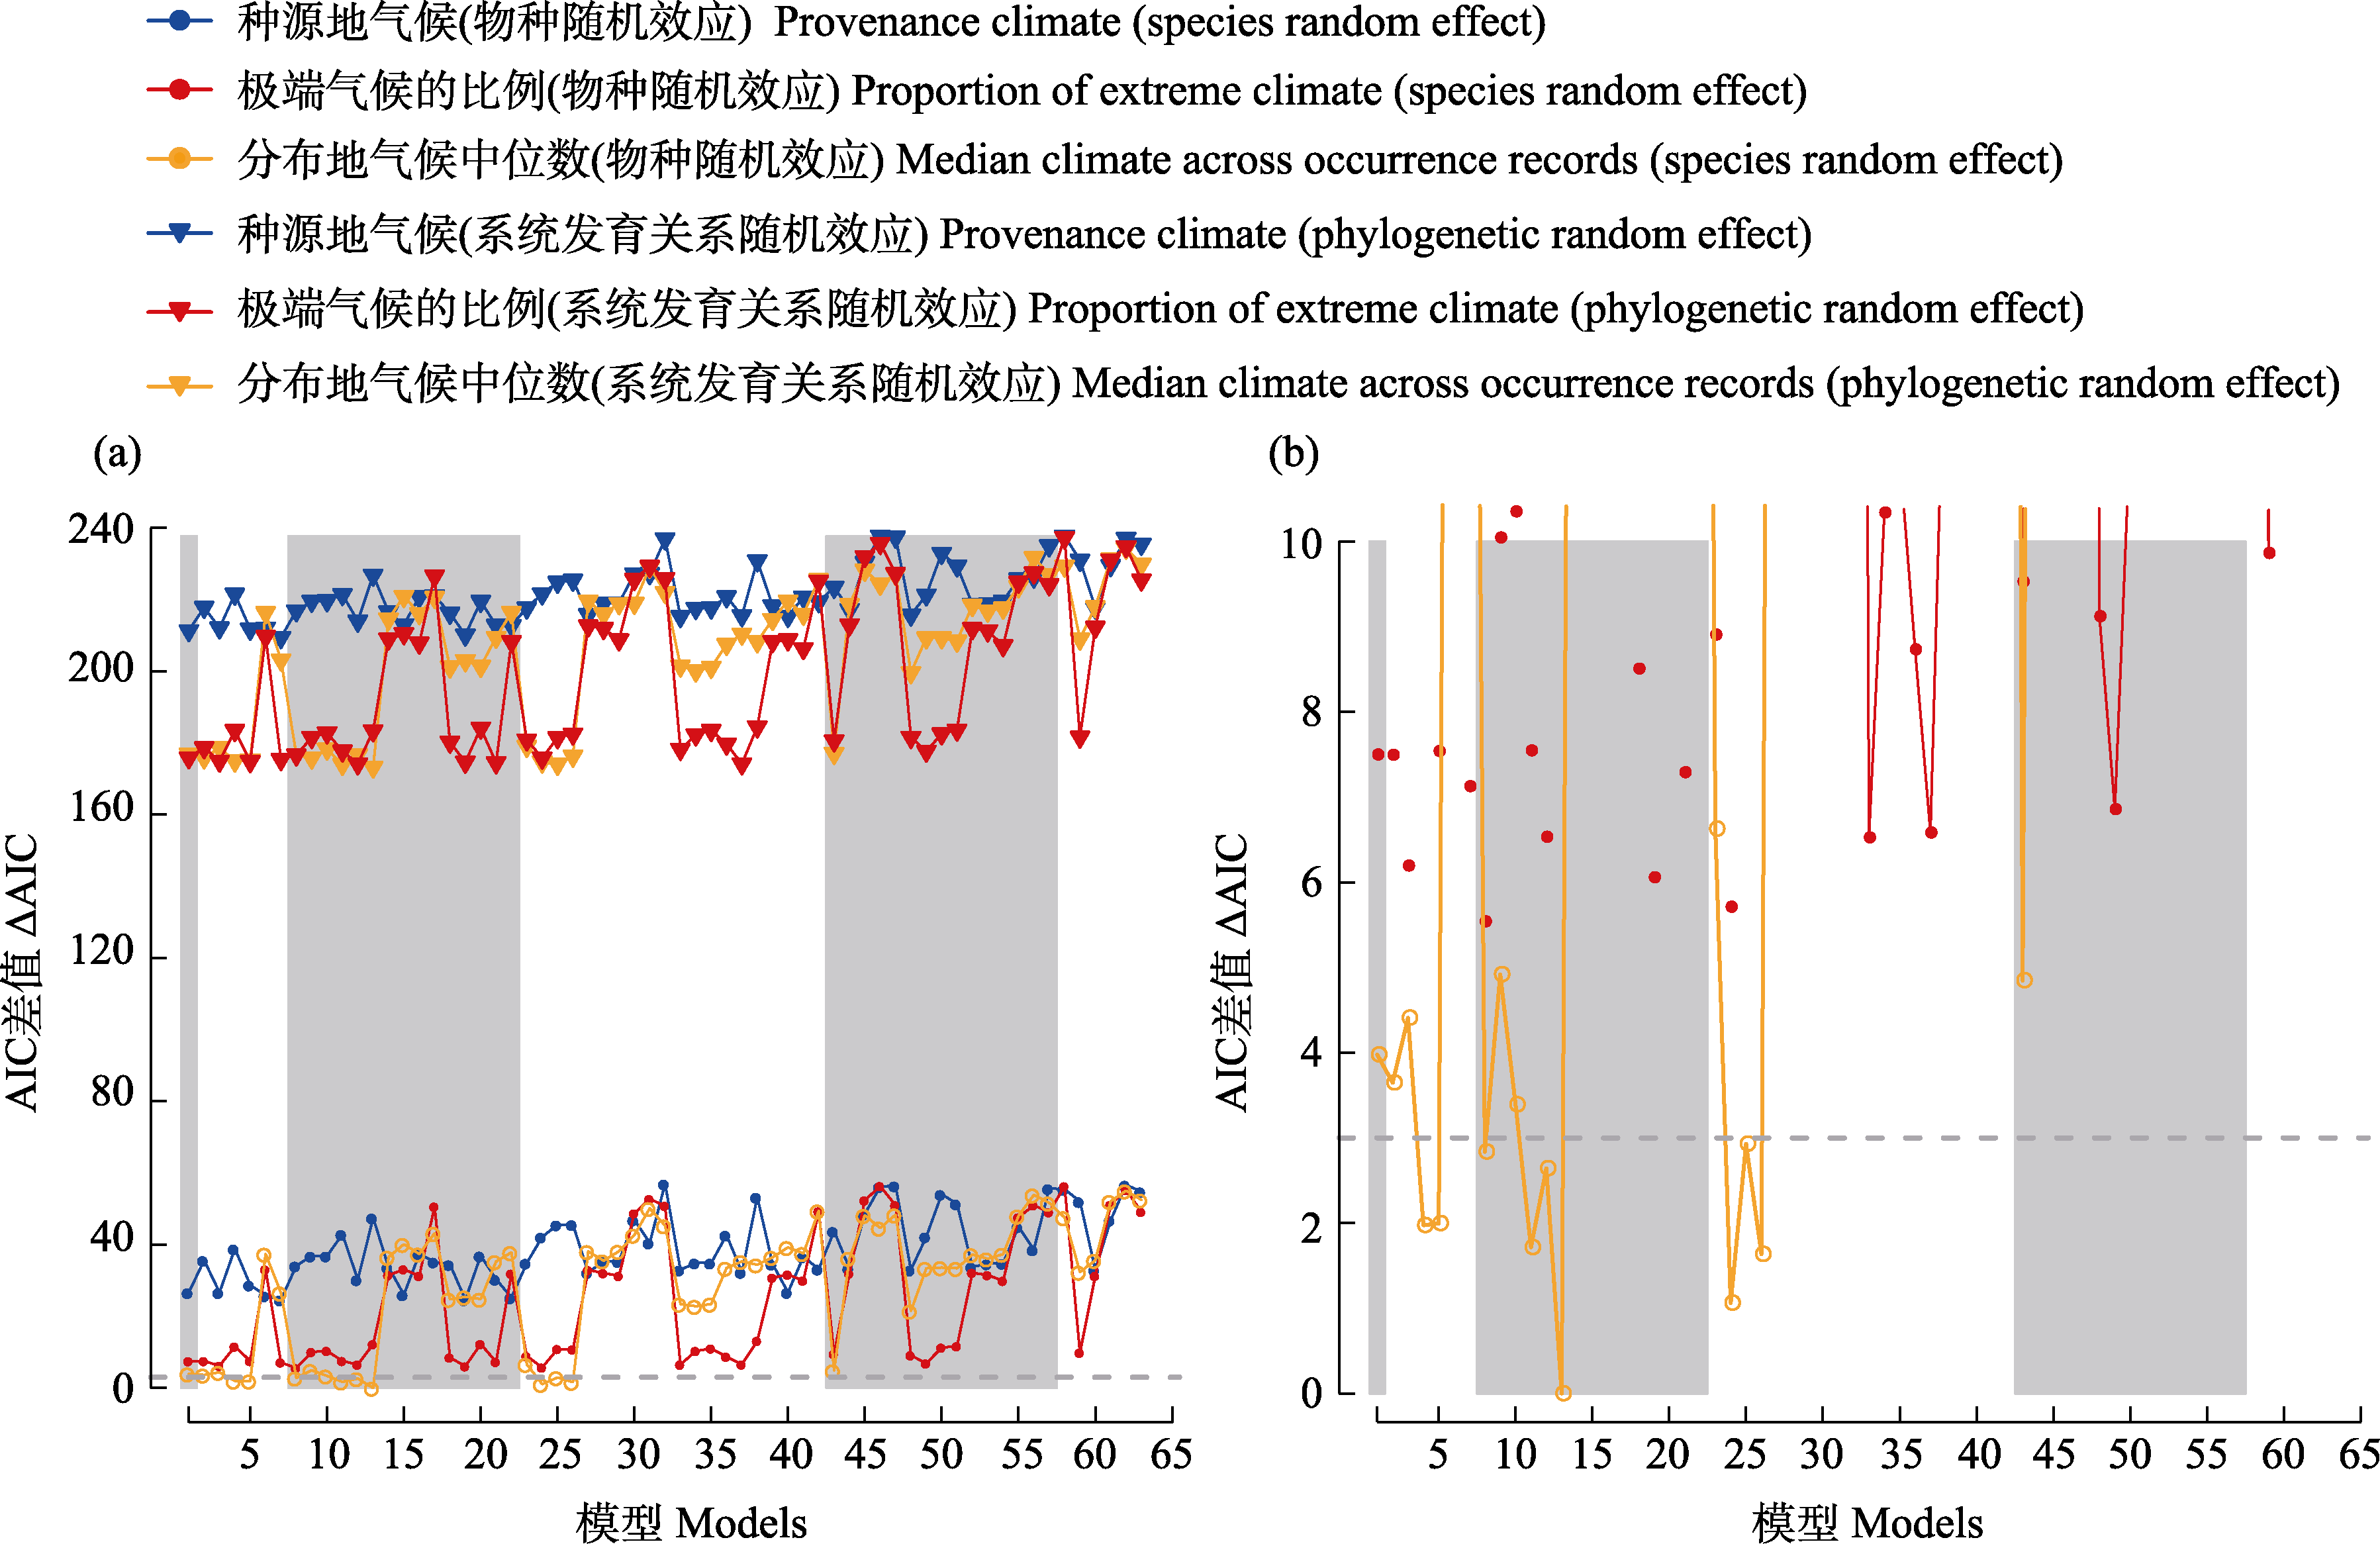
图3 气候差异度量与生长型对引种植物存活影响的混合效应Cox比例风险模型支持度比较。横坐标为模型编号(1-63), 按所含气候变量数量从6个递减至1个(由左至右, 灰白条带标识)分组; 纵坐标表示赤池信息准则差值(ΔAIC, 相对于最佳模型的AIC差异)。模型采用3种气候差异量化指标: 种源地气候(蓝色)、物种分布地气候中位数(橙色)以及极端气候比例(红色); 并结合两种随机效应结构: 物种独立随机效应(圆形)和系统发育相关随机效应(三角形)。灰色虚线表示ΔAIC = 3的阈值。图(b)为图(a)中ΔAIC ≤ 10区域的放大视图, 以清晰展示高支持度模型(ΔAIC ≤ 3)的分布。所有模型均以生长型作为固定效应。
Fig. 3 Comparison of empirical support for mixed-effects Cox proportional hazards models assessing effects of climatic difference metrics and growth form on survival of introduced plants. The x-axis indicates candidate model numbers (1-63) grouped by the number of climatic variables included (decreasing from 6 to 1 from left to right, indicated by alternating gray and white bands); the y-axis indicates Akaike information criterion differences (ΔAIC, relative to the best-supported model). Models incorporated three climatic difference metrics: difference from climate at provenance (blue), difference from median climate across occurrence records (orange), and proportion of extreme climat (red); and two random-effect structures: uncorrelated species random effects (circles) and phylogenetically correlated random effects (triangles). The gray dashed line indicates the ΔAIC = 3 threshold. Panel (b) provides a detailed view of the upper range (ΔAIC ≤ 10) in panel (a), highlighting models with highest support (ΔAIC ≤ 3). All models included growth form as a fixed effect.
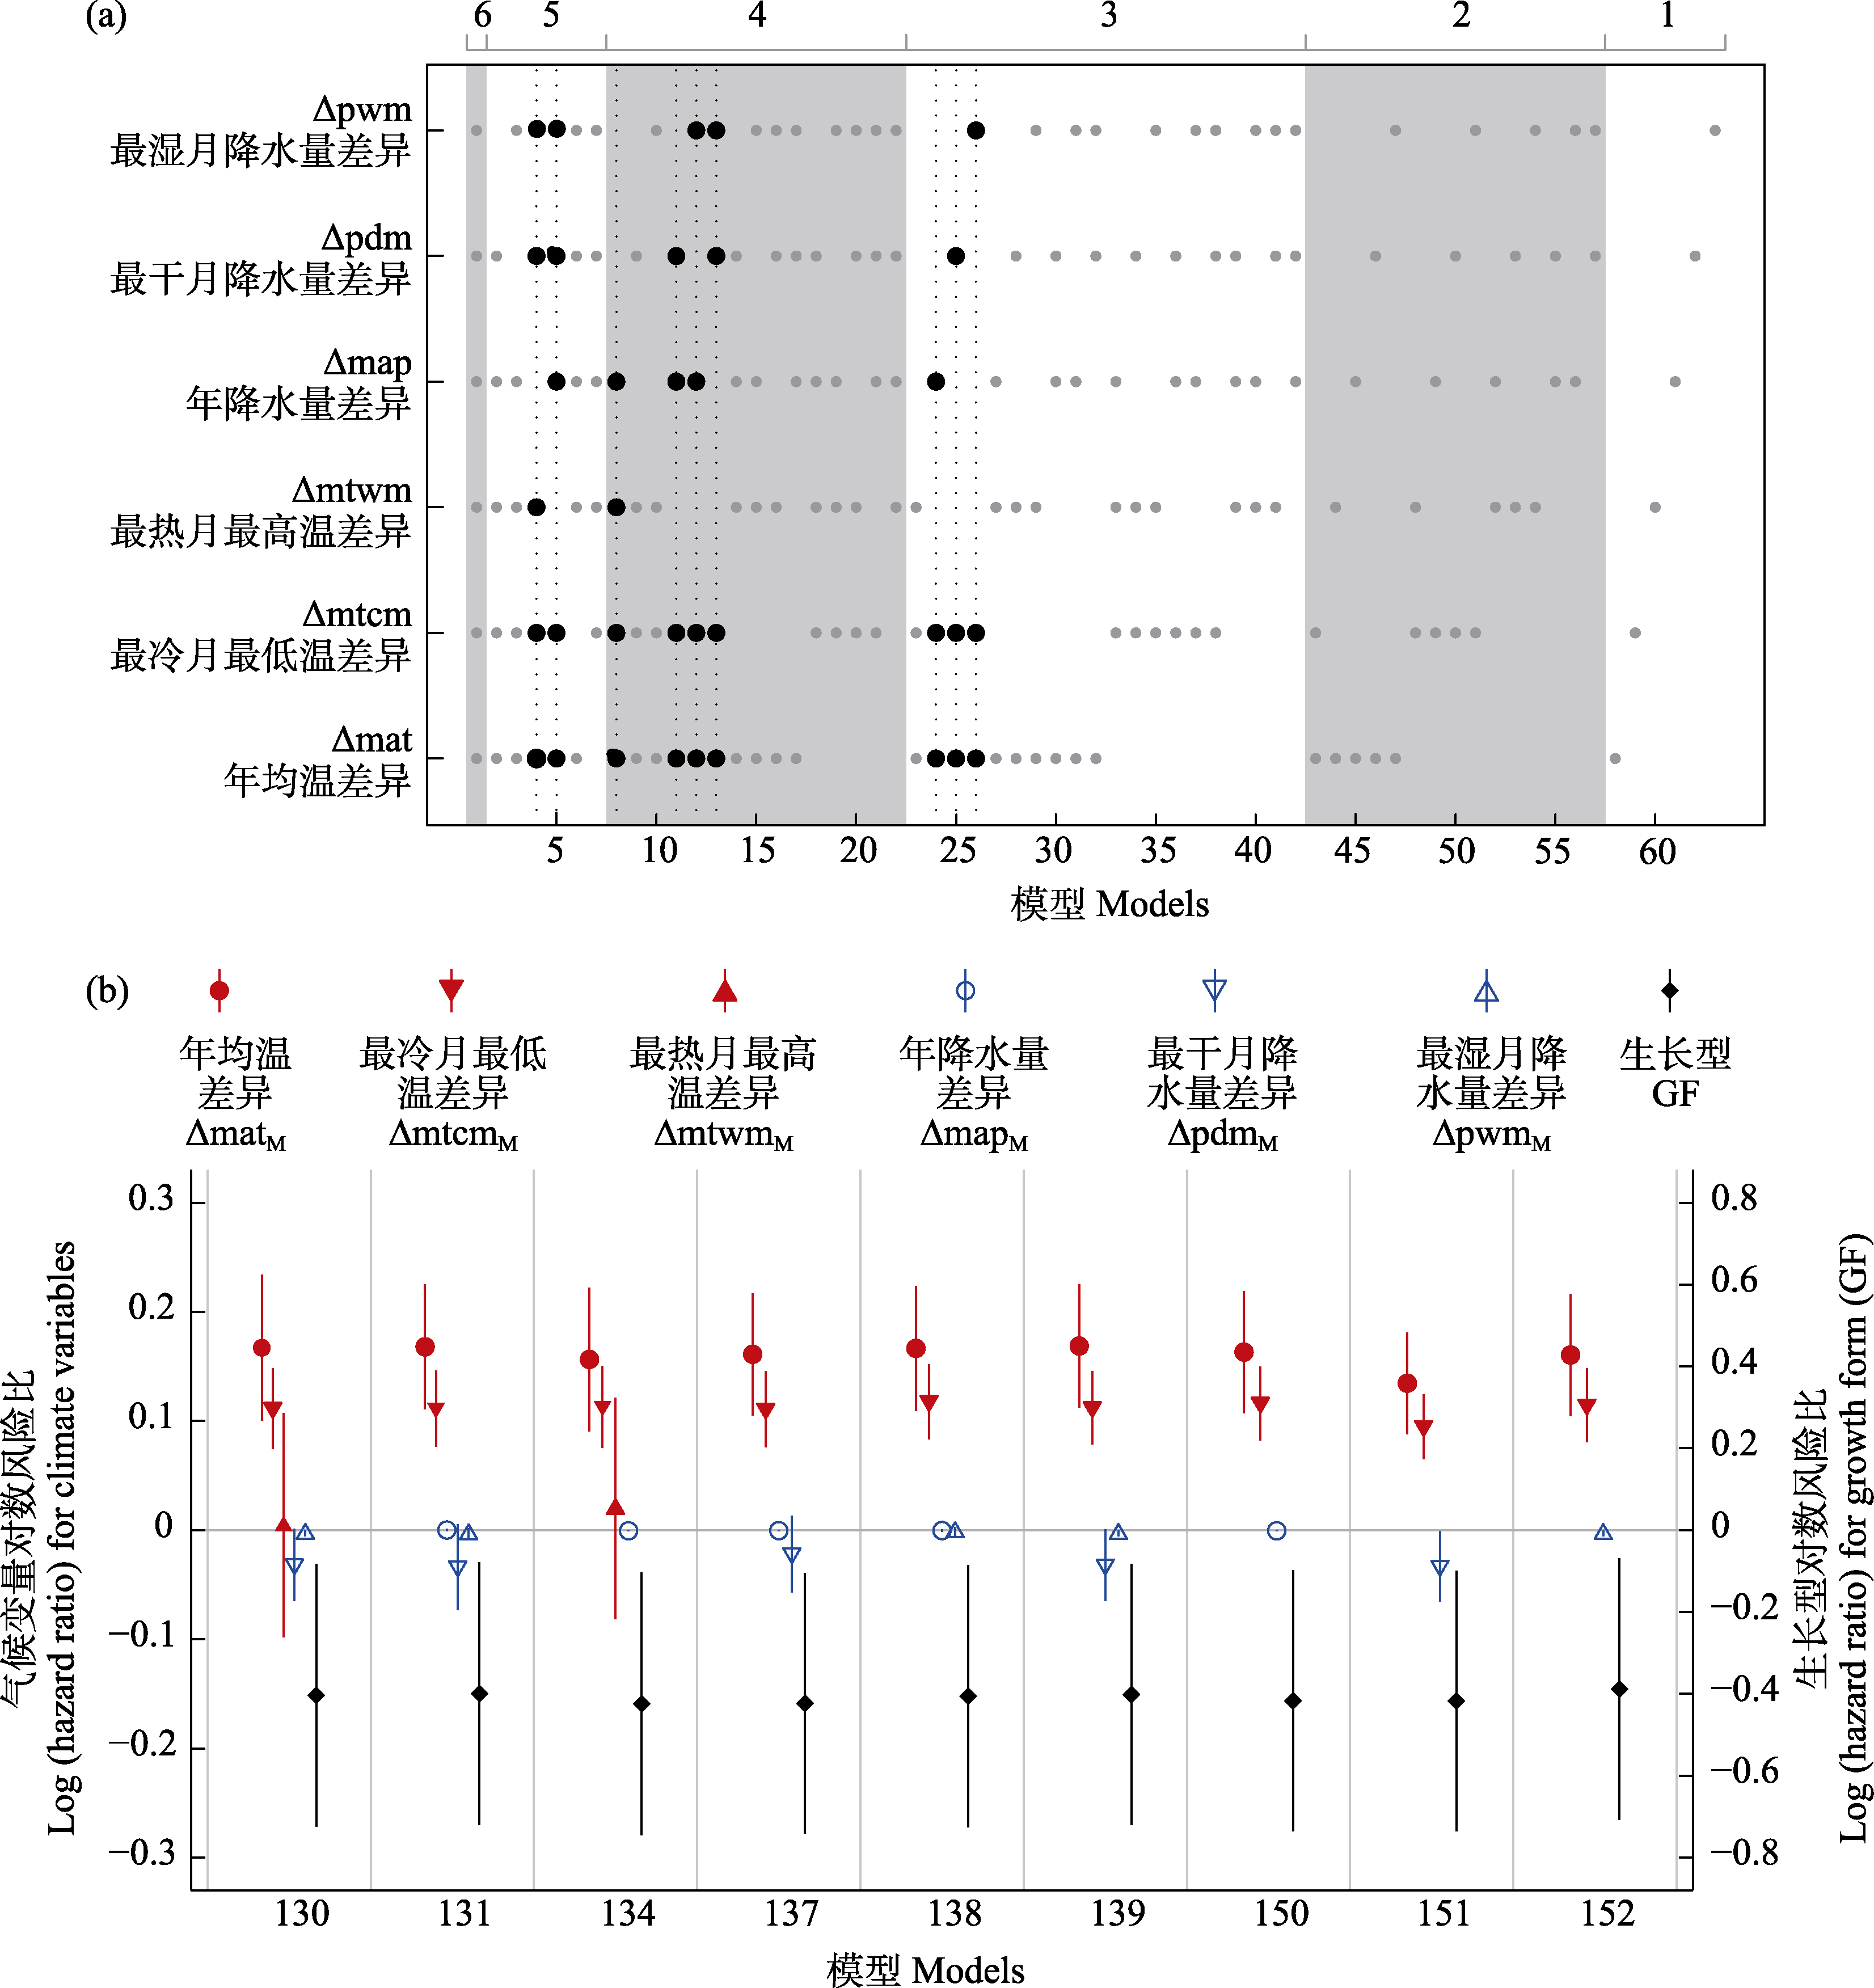
图4 气候差异与生长型对引种植物存活影响的混合效应Cox比例风险模型比较与效应估计。 (a)各模型包含的气候变量组合。纵坐标为6个气候差异变量: 年均温差异、最冷月最低温差异、最热月最高温差异、年降水量差异、最干月降水量差异以及最湿月降水量差异。横坐标为这6个气候差异变量的非空组合。灰色小圆点表示模型包含的变量, 垂直虚线标记具有最高经验支持度(ΔAIC ≤ 3)的模型, 这些模型所包含的变量以黑色大圆点突出显示。图顶部的数字及灰白相间的垂直条带用于视觉区隔不同模型组。所有模型均将生长型作为解释变量纳入分析。(b)最优模型(ΔAIC ≤ 3)中解释变量的效应估计。图中展示了9个高支持度模型(模型编号130-152)中各变量的回归系数(对数风险比)及其95%置信区间: 红色为温度变量(左轴), 蓝色为降水变量(左轴), 黑色菱形为生长型(右轴)。当95%置信区间不与0 (灰色水平线)重叠时, 认为效应在P = 0.05水平上具有统计学意义。对于气候变量, 回归系数 > 0表示气候差异每增加1个单位, 植株死亡风险相应增加; 对于生长型, 回归系数 < 0表示草本植物死亡风险低于木本植物。
Fig. 4 Comparison of mixed-effects Cox proportional hazards models for introduced plant survival in relation to climatic differences and growth form, and corresponding effect estimates. (a) Combinations of climatic variables included in each model. The ordinate shows six climatic difference variables: difference in mean annual temperature (Δmat), difference in minimum temperature of coldest month (Δmtcm), difference in maximum temperature of warmest month (Δmtwm), difference in annual precipitation (Δmap), difference in precipitation of driest month (Δpdm), difference in precipitation of wettest month (Δpwm). The abscissa shows all non-empty combinations of these variables. Gray dots indicate variable inclusion; vertical dotted lines mark models with the highest empirical support (ΔAIC ≤ 3), with variables in these models highlighted by large black dots. The numbers and alternating gray/white bands at the top serve as visual separators for model groups. All models included growth form as an explanatory variable in the analysis. (b) Effect estimates from the best-supported models (ΔAIC ≤ 3). Point estimates (red for temperature, blue down for precipitation, black diamonds for growth form) and 95% confidence intervals are shown for nine top-ranked models (Model IDs 130-152). Coefficients are log (hazard ratio); statistical significance at P = 0.05 is indicated when 95% confidence intervals do not overlap 0 (gray horizontal line). For climatic variables, regression coefficients > 0 indicate increased mortality risk per unit increase in climatic difference; for growth form, regression coefficients < 0 indicate lower mortality risk for herbal than for woody plants.
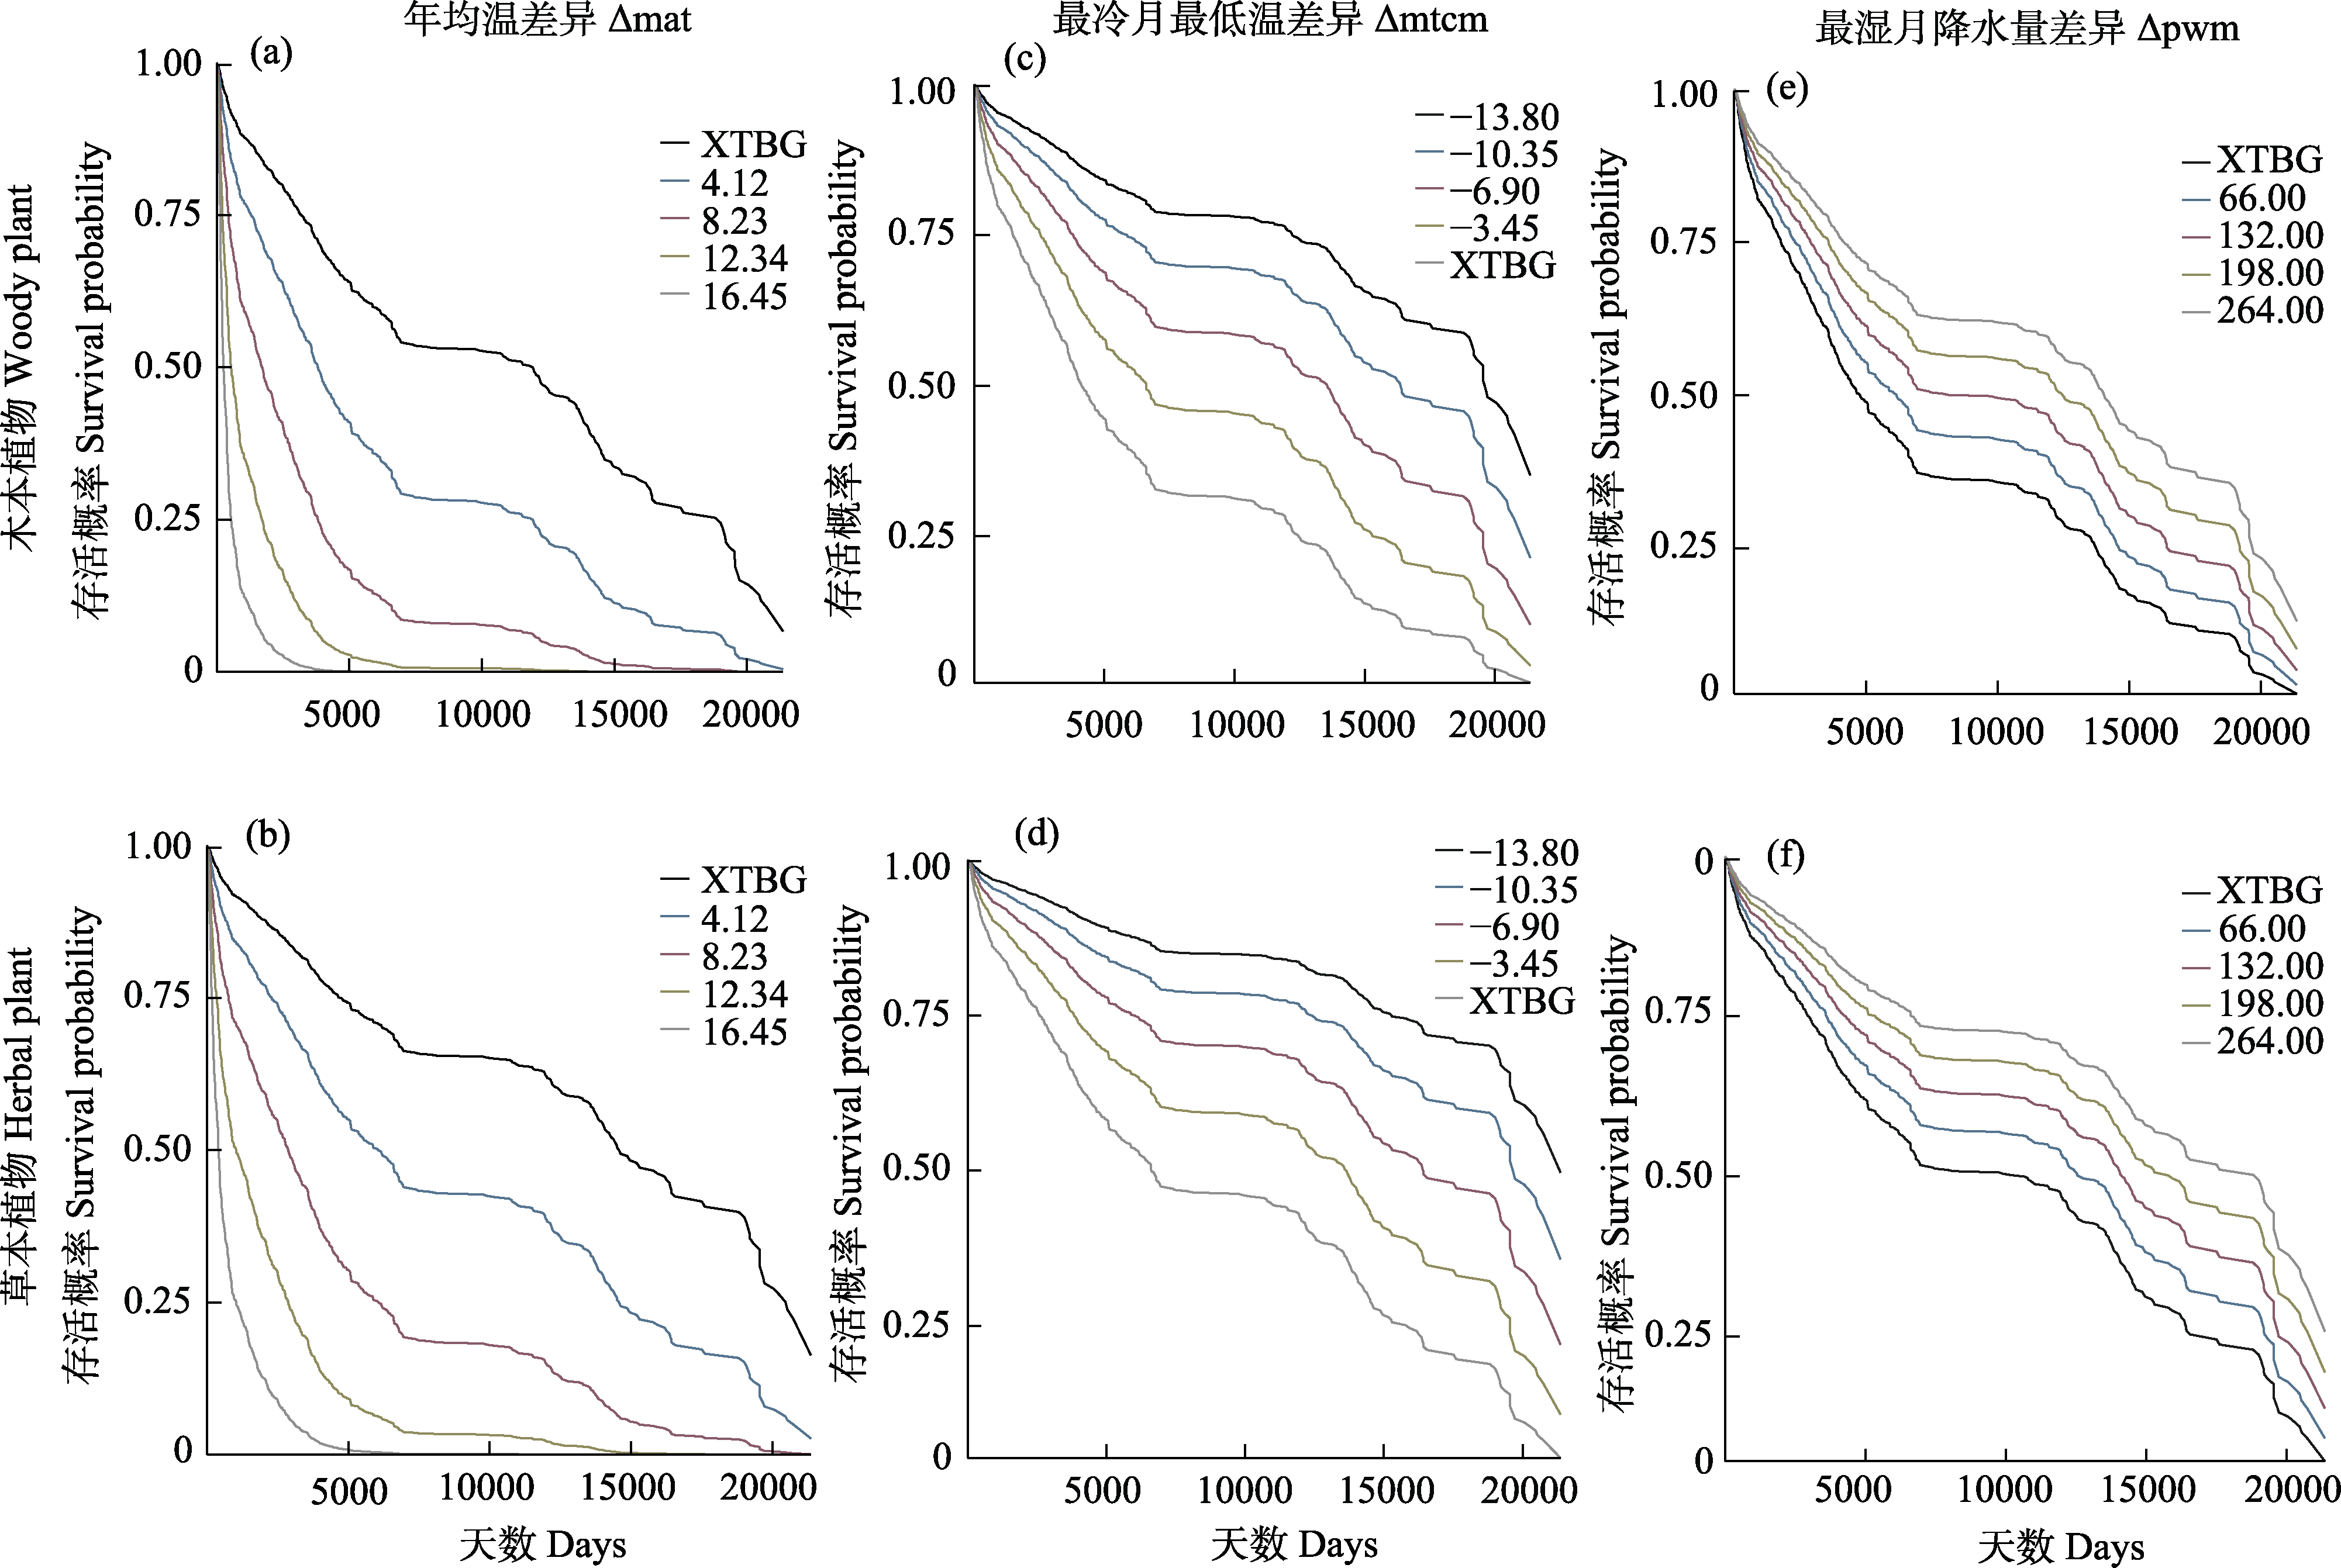
图5 基于具有最高经验支持的模型之一(ΔAIC = 0; 图3中的模型13, 图4中的模型139)解释气候变量对引种植物存活曲线的预测影响。该曲线将存活时间(横坐标)与植物在XTBG的存活概率(纵坐标)相关联。每幅图中, 标记为“XTBG”的曲线描述了物种分布地气候中位数与XTBG气候一致时的存活概率(即气候差异为0时的基线预测); 其余曲线分别对应该气候变量4个代表性取值下的存活状况: 该变量的最大观测差异值以及0与最大值之间3个等间距水平。存活曲线基于Nelson-Altschuler-Aalen风险估计器计算。图(a-b)显示年均温中位数差值(ΔmatM)的影响; 图(c-d)显示最冷月最低温中位数差值(ΔmtcmM)的影响; 图(e-f)显示最湿月降水量中位数差值(ΔpwmM)的影响。
Fig. 5 Effects of varying climatic values on predicted introduced plant survival, according to one of the models with highest empirical support (ΔAIC = 0; Model 13 in Fig. 3, Model 139 in Fig. 4). The curves relate survival time (abscissa) to probability of plant survival at XTBG (ordinate). In each panel, the curve labeled “XTBG” describes the predicted survival when the median climate of the species distribution is identical to the climate of XTBG (i.e., the baseline prediction when climatic difference equals zero); other curves correspond to survival conditions at four representative values: the maximum observed difference, and three equally spaced intermediate levels between zero and the maximum. Survival curves are based on the Nelson-Altschuler-Aalen estimator of the hazards. Panels (a-b) show the effect of differences in median mean annual temperature (ΔmatM); panels (c-d) show the effect of differences in median minimum temperature of coldest month (ΔmtcmM); while panels (e-f) show the effect of differences in median precipitation of wettest month (ΔpwmM).
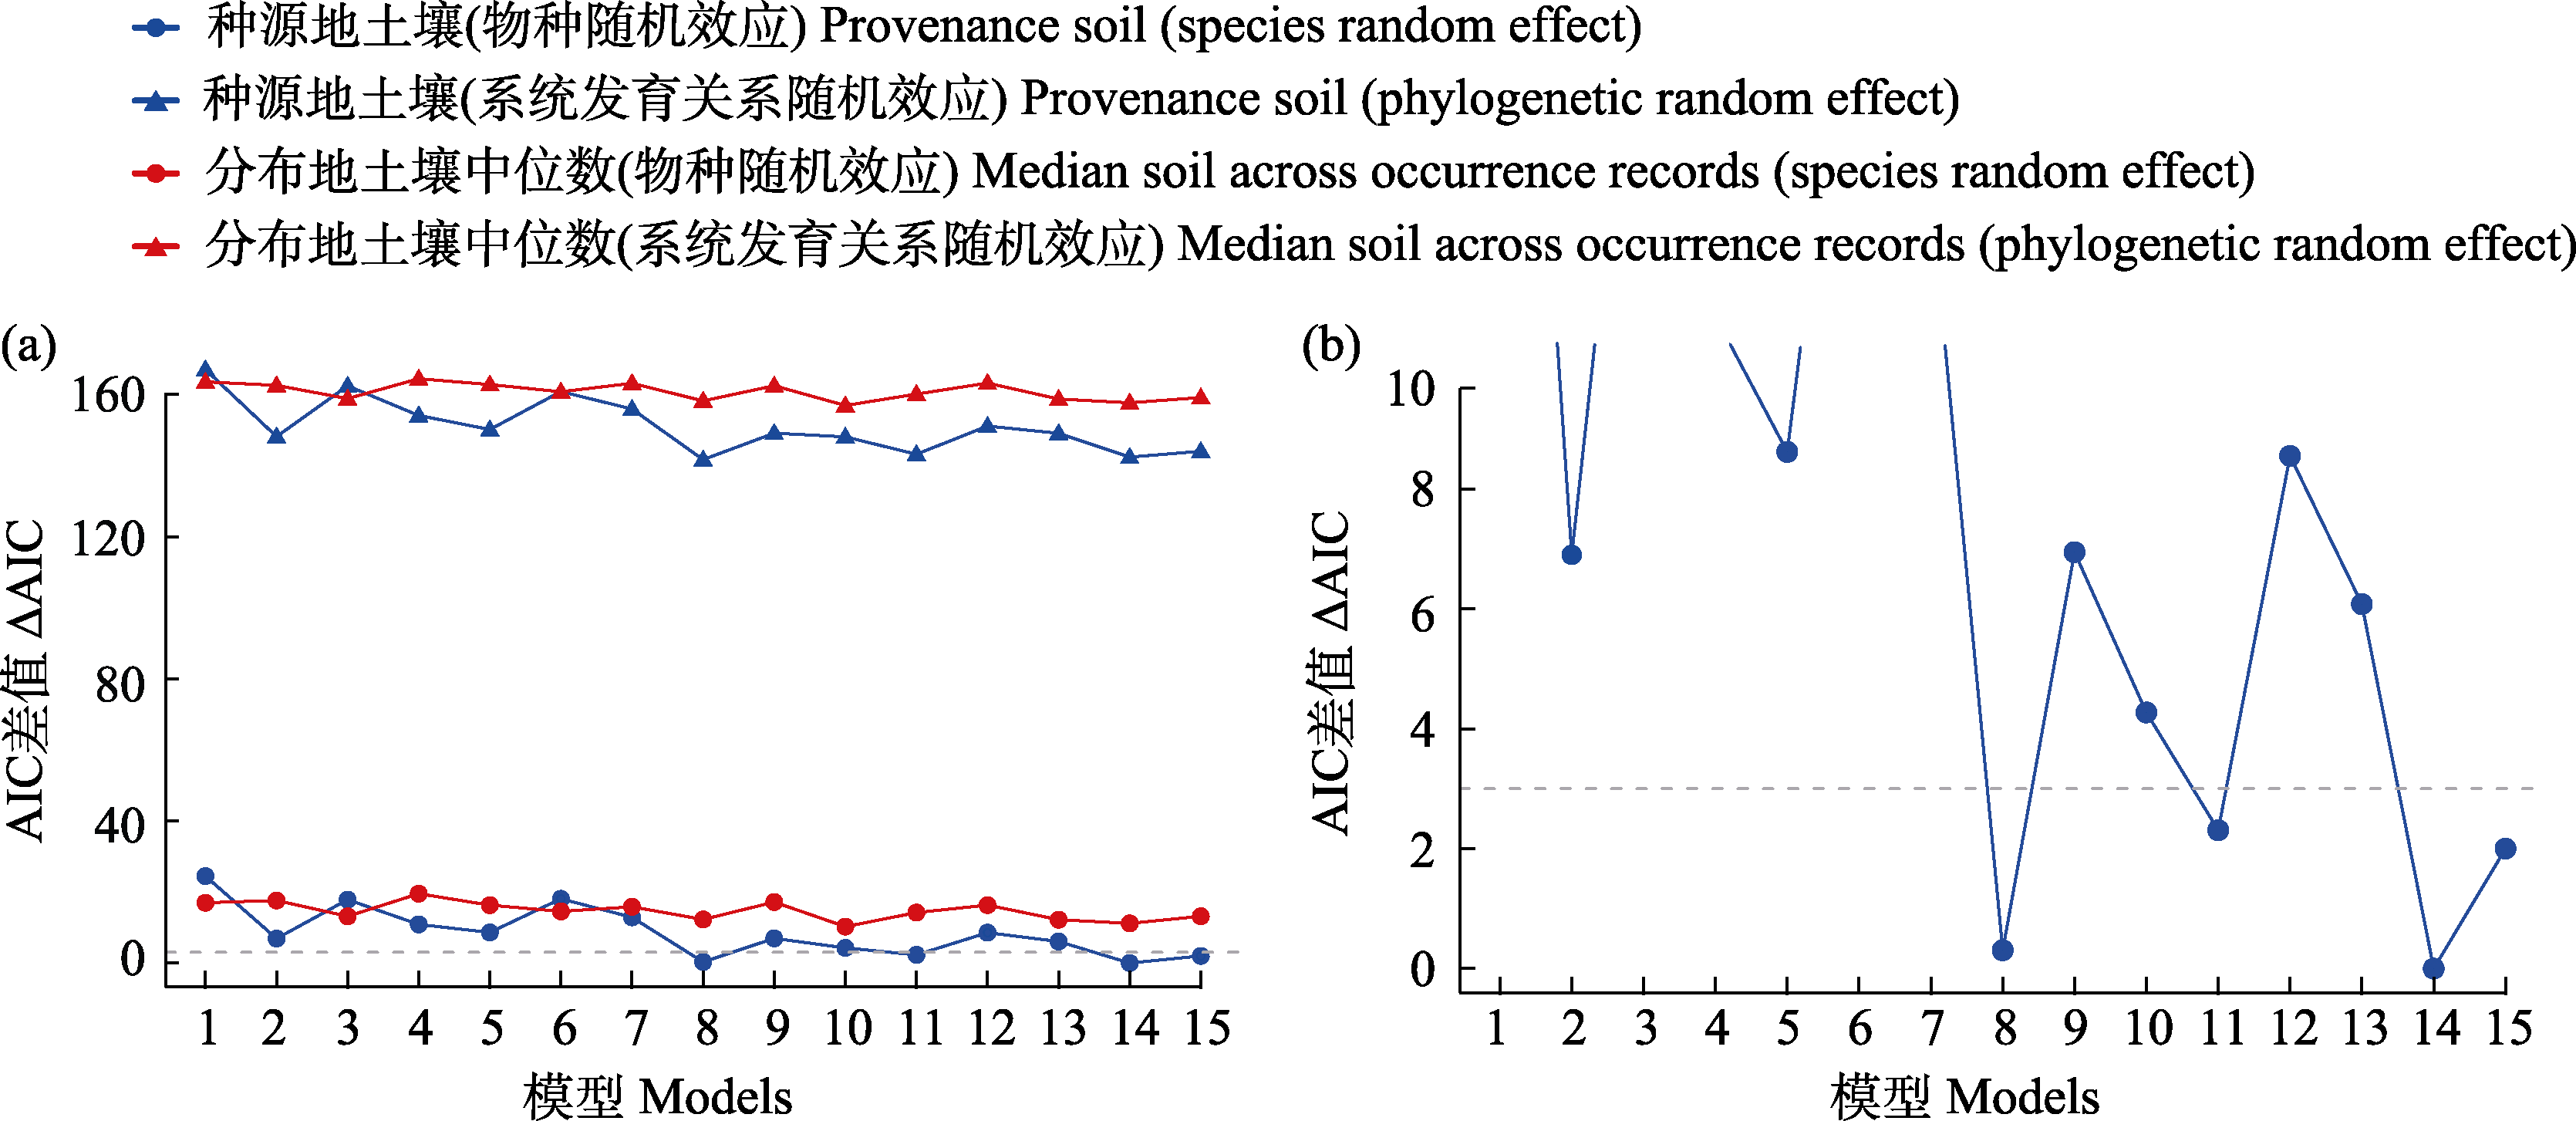
图6 土壤差异与生长型对引种植物存活影响的混合效应Cox比例风险模型比较。60个模型的经验支持度通过赤池信息准则差值(ΔAIC)衡量。模型通过两种方式量化了XTBG与植物物种分布地之间的土壤差异: XTBG与繁殖体采集地土壤条件的差异(标记为“种源地土壤”)和XTBG与物种所有分布点土壤中位数的差异(标记为“分布地土壤中位数”)。此外, 模型通过物种独立随机效应(标记为“物种随机效应”)或基于系统发育关系的相关随机效应(标记为“系统发育关系随机效应”)来考虑数据的非独立性。横坐标表示候选模型编号(1-15), 纵坐标表示ΔAIC值。不同颜色和形状的符号代表不同土壤差异量化方法与随机效应类型的组合: 蓝色圆形表示种源地土壤与物种独立随机效应, 红色圆形表示分布地土壤中位数与物种独立随机效应; 蓝色三角形表示种源地土壤与系统发育关系随机效应, 红色三角形表示分布地土壤中位数与系统发育关系随机效应。图中的灰色虚线均表示ΔAIC = 3, 用于界定经验支持度最高的模型(ΔAIC ≤ 3)。图(b)为图(a)纵坐标下半部分(0-10)的放大视图, 突出展示具有最高经验支持度(ΔAIC ≤ 3)的模型。所有模型均将生长型作为解释变量纳入分析。
Fig. 6 Comparison of empirical support for mixed-effects Cox proportional hazards models relating introduced plant survival to soil differences and growth form. Empirical support for 60 models was measured as differences in the Akaike information criterion (ΔAIC). Models quantified soil differences between XTBG and species’ wild distributions in two ways: difference from soil at provenances (labeled “Provenance soil”) and difference from the median soil across occurrence records of a species (labeled “Median soil across occurrence records”). Additionally, models accounted for evolutionary relationships among plantings using uncorrelated species random effects (labeled “species random effect”) or phylogenetically correlated species random effects (labeled “phylogenetic random effect”). The abscissa indicates candidate model numbers (1-15), and the ordinate indicates ΔAIC values. Blue circles represent provenance soil with uncorrelated species random effects (s), and red circles represent the median soil across occurrence records with uncorrelated species random effects (s); blue triangles represent provenance soil with phylogenetic random effect, and red triangles represent the median soil across occurrence records with phylogenetic random effect. Gray dashed lines in both panel (a) and panel (b) indicate ΔAIC = 3, serving as the threshold to identify models with highest empirical support (ΔAIC ≤ 3). Panel (b) Magnified view the lower part of the ordinate in panel (a) (0-10), highlighting the models with highest empirical support (ΔAIC ≤ 3). Growth form was included as an explanatory variable in all models.
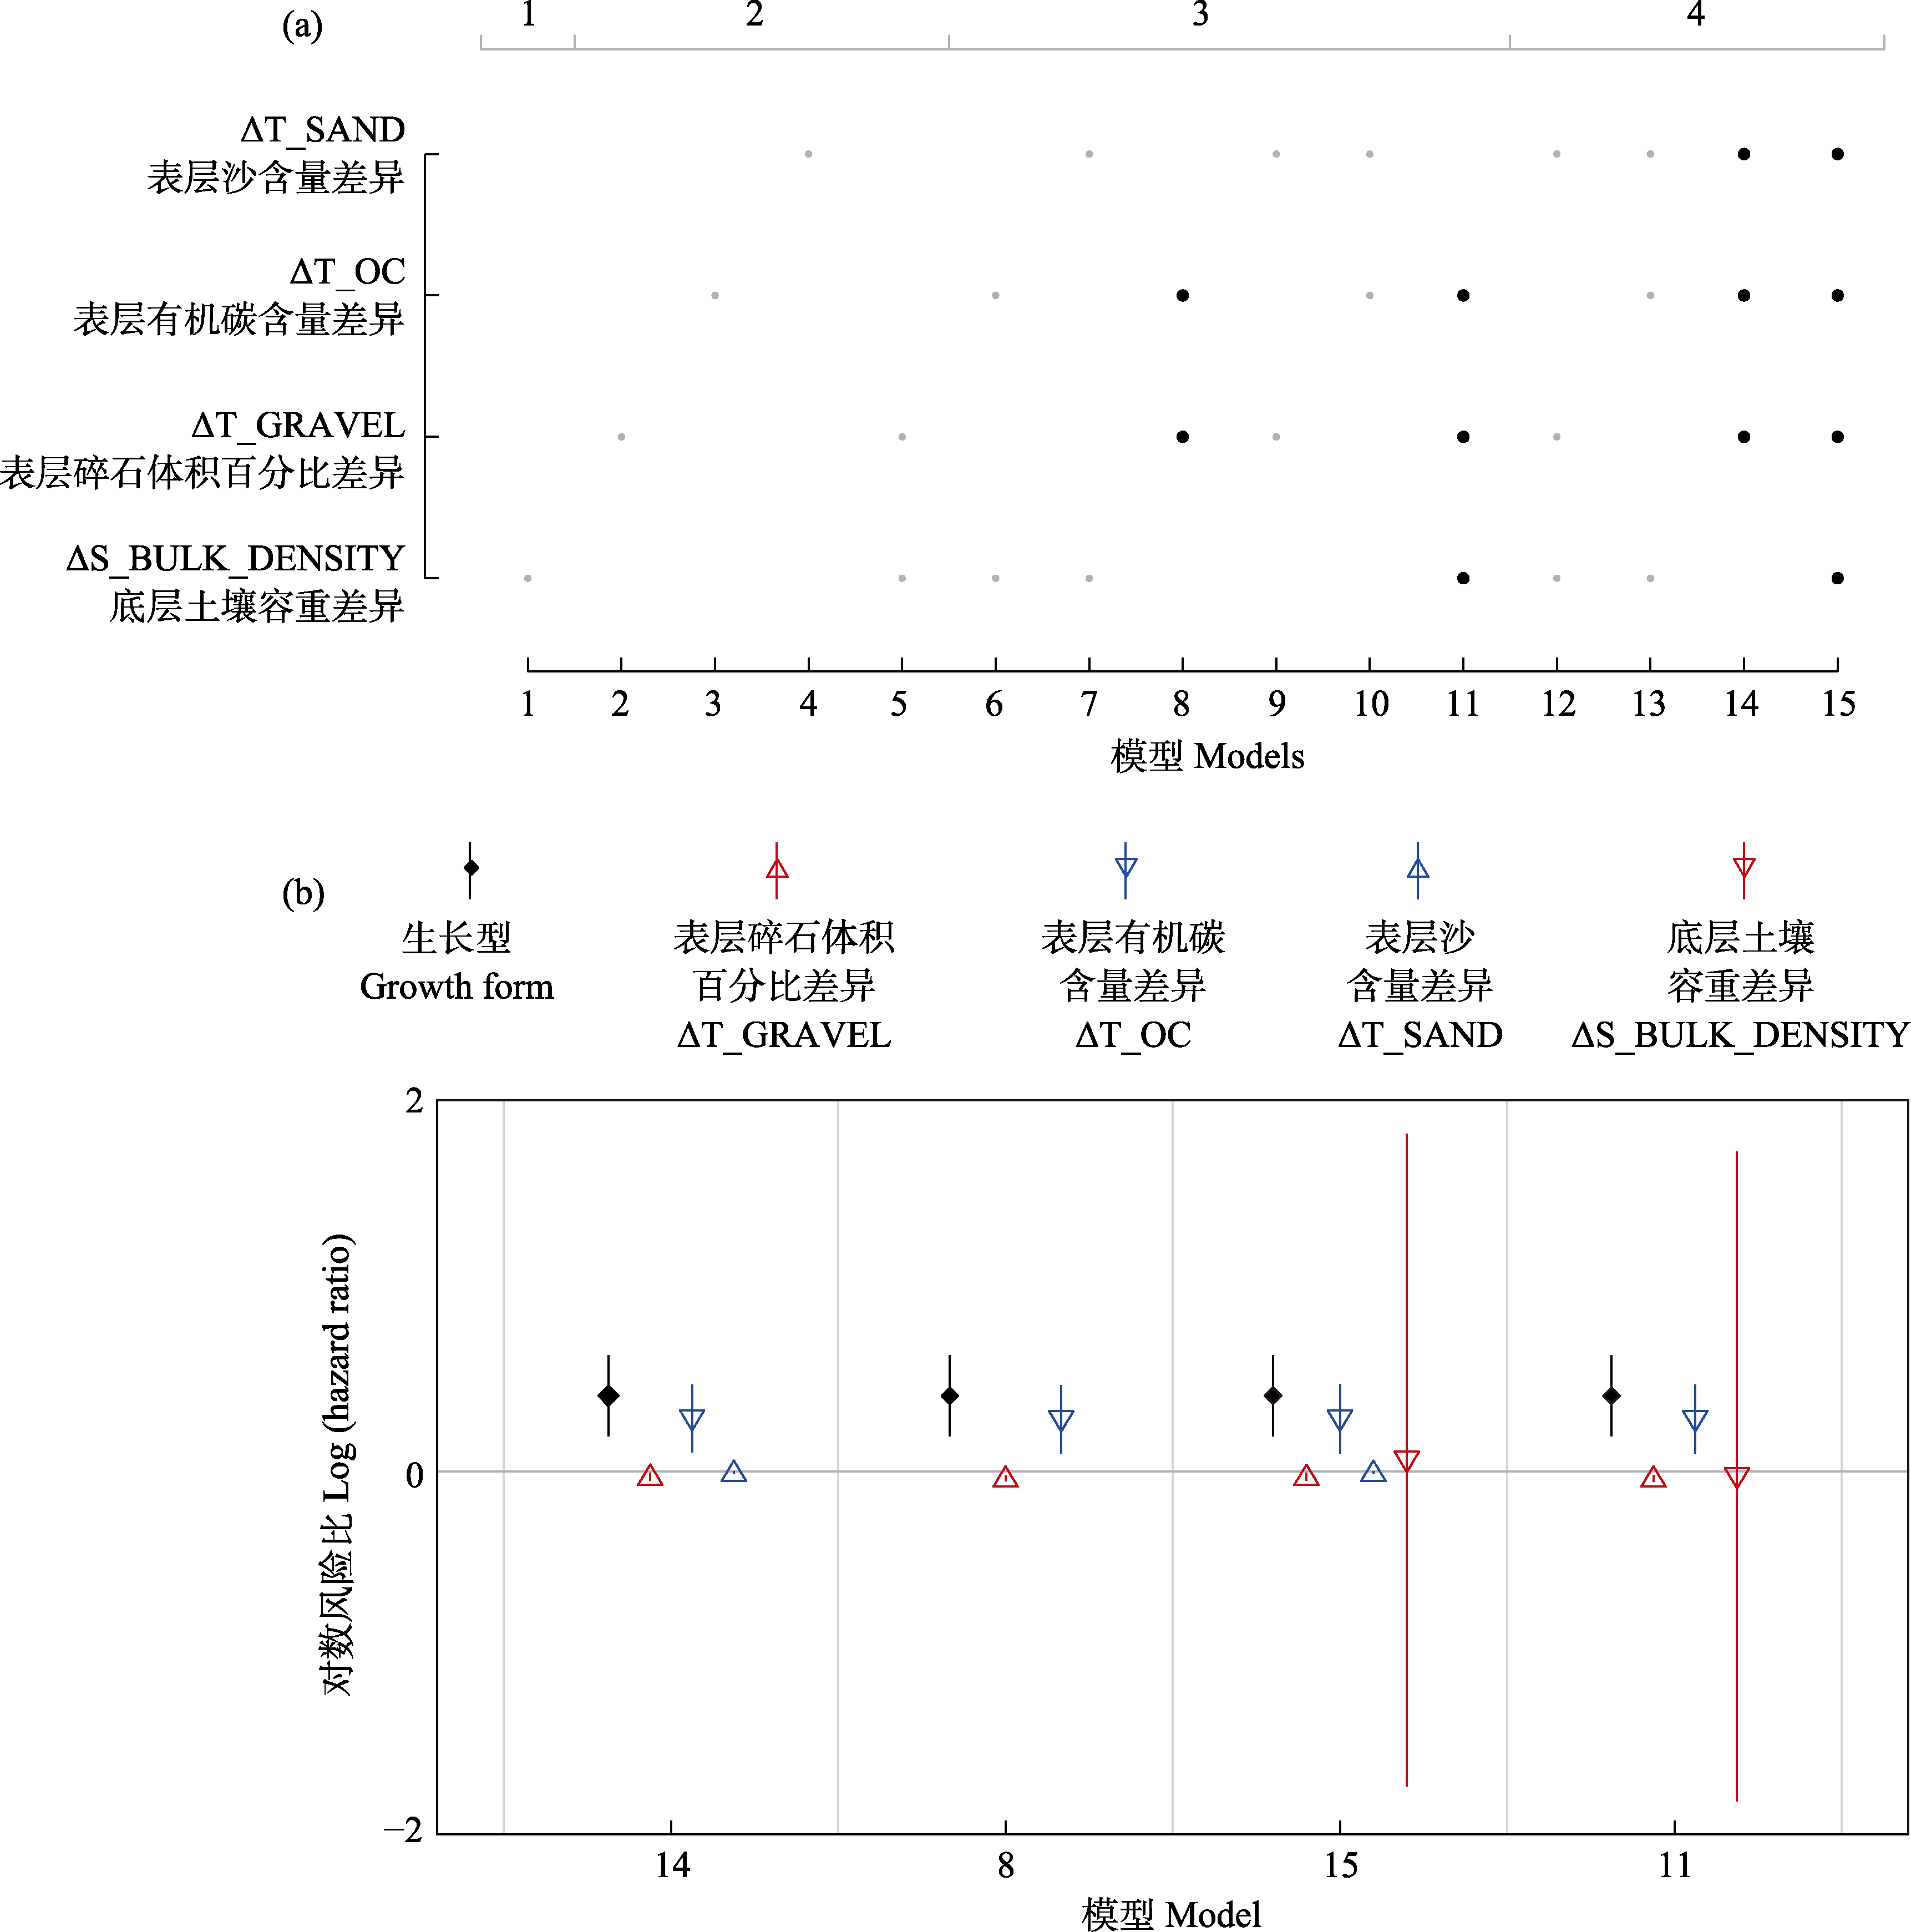
图7 土壤差异与生长型对引种植物存活影响的混合效应Cox比例风险模型比较与效应估计。(a)各模型包含的土壤变量组合。纵坐标为4个土壤差异变量: 表层沙含量差异(ΔT_SAND)、表层有机碳含量差异(ΔT_OC)、表层碎石体积百分比差异(ΔT_GRAVEL)和底层土壤容重差异(ΔS_BULK_DENSITY); 横坐标为15个备选模型(编号1-15), 代表上述变量的所有可能组合。圆点表示变量纳入情况, 黑色大圆点标识具有最强经验支持度的模型(ΔAIC ≤ 3, 垂直虚线所示)中包含的变量。图(a)顶部的数字表示各模型纳入的土壤变量数量(1-4个)。所有模型均将生长型作为解释变量纳入。图(b)表示最高经验支持模型(ΔAIC ≤ 3)中各解释变量的效应估计。横坐标为模型编号(14、8、15、11), 纵坐标为对数风险比。图中以点估计值和95%置信区间(垂线)展示各变量的回归系数。当95%置信区间不与0线(灰色水平线)重叠时, 效应具有统计学意义(P ≤ 0.05)。土壤变量回归系数 > 0表示该土壤差异每增加1个单位, 植株死亡风险增加; 生长型回归系数 > 0表示草本植物的死亡风险高于木本植物。
Fig. 7 Comparison of mixed-effects Cox proportional hazards models for introduced plant survival in relation to soil differences and growth form, with effect estimates. (a) Combinations of soil variables included in each model. The ordinate (y-axis) displays four soil difference variables: difference in topsoil sand content (ΔT_SAND), difference in topsoil organic carbon content (ΔT_OC), difference in topsoil gravel content (ΔT_GRAVEL), and difference in subsoil bulk density (ΔS_BULK_DENSITY); the abscissa (x-axis) shows 15 candidate models (numbered 1-15) representing all possible combinations of these variables. Dots indicate variable inclusion; large black dots mark variables present in models with the highest empirical support (ΔAIC ≤ 3, indicated by vertical dotted lines). Numbers at the top of panel (a) denote the number of soil variables included in each model (1-4). All models included growth form as an explanatory variable. (b) Effect estimates from the highest empirical support models (ΔAIC ≤ 3). The abscissa (x-axis) indicates model numbers (14, 8, 15, 11), and the ordinate (y-axis) represents the natural logarithm of the hazard ratio (log hazard ratio). Point estimates and 95% confidence intervals (vertical lines) show regression coefficients. Statistical significance (P ≤ 0.05) is indicated when confidence intervals do not overlap zero (gray horizontal line). regression coefficients > 0 for soil variables indicate increased mortality risk per unit increase in soil difference; for growth form, regression coefficients > 0 indicate higher mortality risk for herbal compared to woody plants.
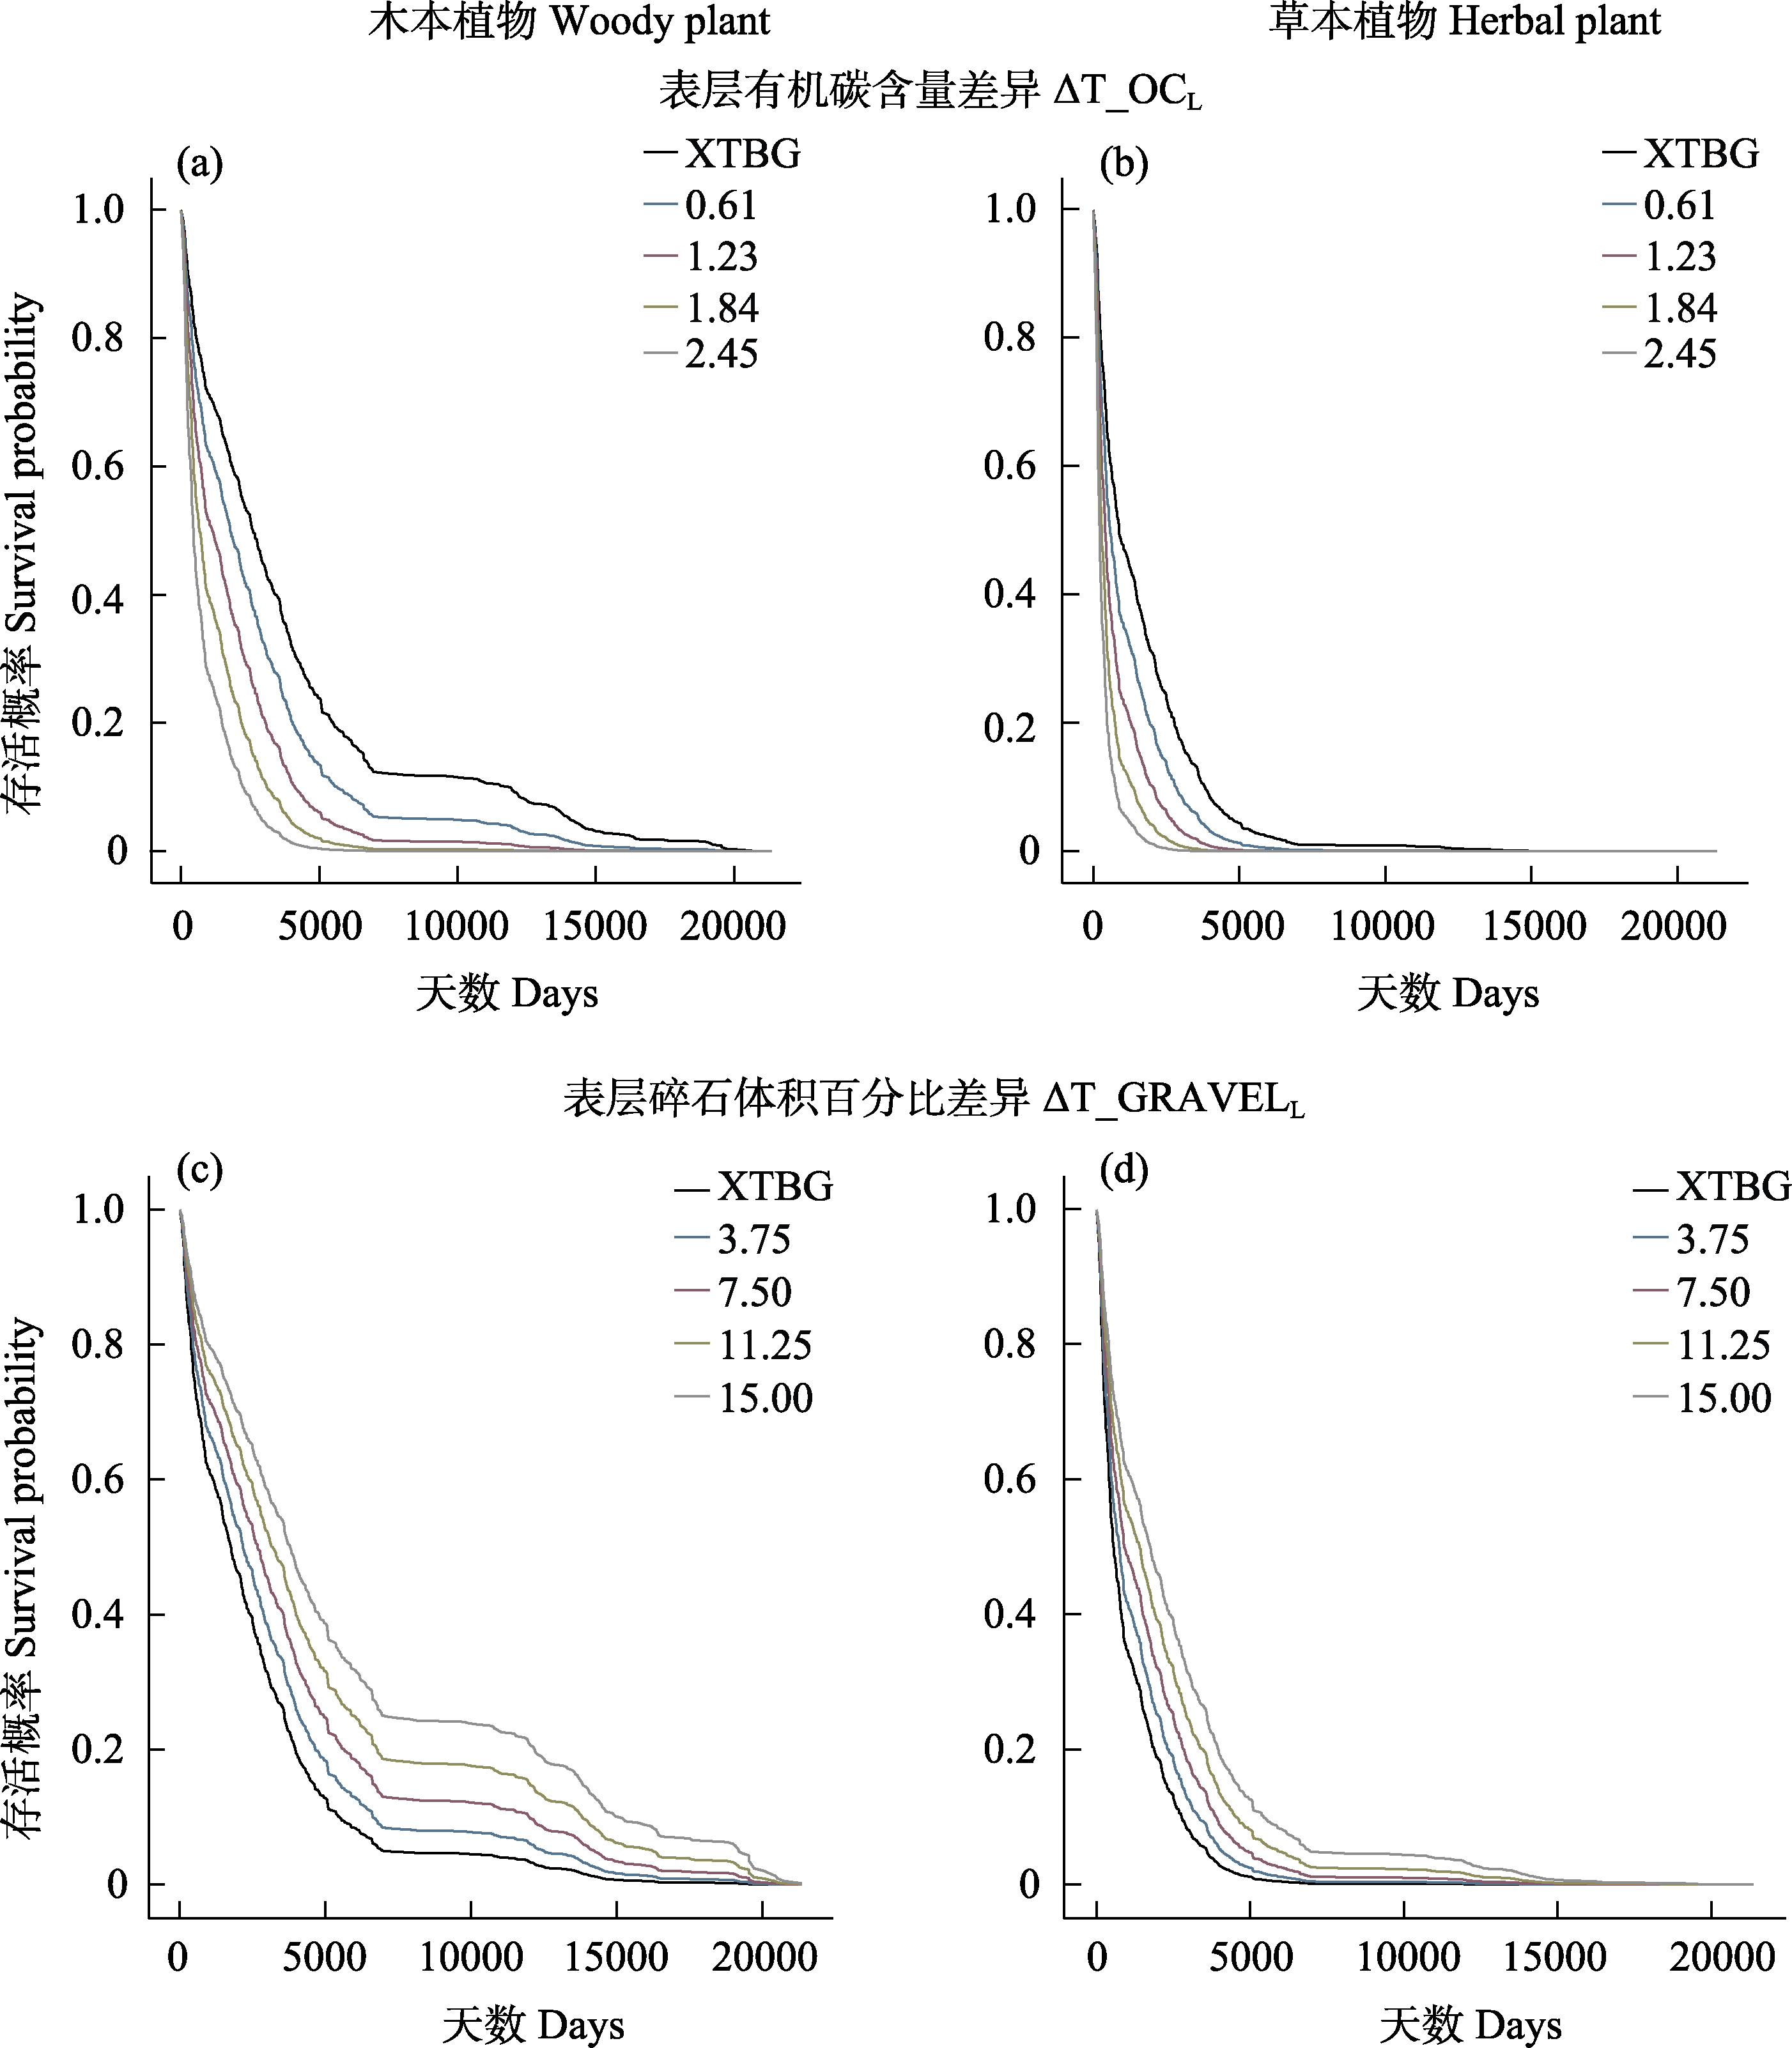
图8 基于具有最高经验支持度的土壤模型(图6中模型14)预测土壤变量对引种植物存活曲线的影响。图中显示存活概率(纵坐标)随存活天数(横坐标)的变化关系。左列为木本植物预测结果, 右列为草本植物预测结果; (a-b)展示表层有机碳含量差异(ΔT_OCL)的效应, (c-d)展示表层碎石体积百分比差异(ΔT_GRAVELL)的效应。每个小图中, 标注为“XTBG”的曲线代表种源地与版纳植物园土壤条件无差异(差异值 = 0)的参照情景; 其余4条曲线对应该土壤变量在0至最大观测差异范围内的4个等间距梯度水平(含最大值)。生存曲线基于Nelson-Aalen累积风险估计得出。
Fig. 8 Predicted effects of soil variable differences on introduced plant survival curves based on the model with the highest empirical support (Model 14 in Fig. 6). The panels display predicted survival probability (ordinate) over time since survival time (abscissa). The left column presents predictions for woody plants and the right column for herbal plants; the upper row (a-b) shows the effect of topsoil organic carbon content difference (ΔT_OCL), and the lower row (c-d) shows the effect of topsoil gravel volume percentage difference (ΔT_GRAVELL). In each panel, the curve labeled “XTBG” represents the reference scenario with zero soil difference from XTBG; the other four curves correspond to four equally-spaced gradient levels of that soil variable across the range from 0 to the maximum observed difference (including the maximum). Survival curves were derived from Nelson-Aalen cumulative hazard estimates.
| [1] |
Abeli T, Dalrymple S, Godefroid S, Mondoni A, Müller JV, Rossi G, Orsenigo S (2020) Ex situ collections and their potential for the restoration of extinct plants. Conservation Biology, 34, 303-313.
DOI URL |
| [2] | Anderson JV (2015) Advances in Plant Dormancy. Springer, Cham, Switzerland. |
| [3] | Barandun M, Paz A, van Tiel N, van den Hoogen J, Pellissier L, Crowther TW, Maynard DS (2025) Global patterns in plant environmental breadths. Ecography, 2025, e07637. |
| [4] | Bharti K (2021) Crop residues and their impact on crop production: A review. Journal of Emerging Technologies and Innovative Research, 8, 613-618. |
| [5] |
Briscoe Runquist RD, Gorton AJ, Yoder JB, Deacon NJ, Grossman JJ, Kothari S, Lyons MP, Sheth SN, Tiffin P, Moeller DA (2020) Context dependence of local adaptation to abiotic and biotic environments: A quantitative and qualitative synthesis. The American Naturalist, 195, 412-431.
DOI PMID |
| [6] | Burnham KP, Anderson DR (2002) Model Selection and Multimodel Inference: A practical information-theoretic approach. Springer, New York. |
| [7] |
Cayuela L, Granzow-de la Cerda Í, Albuquerque FS, Golicher DJ (2012) Taxonstand: An R package for species names standardisation in vegetation databases. Methods in Ecology and Evolution, 3, 1078-1083.
DOI URL |
| [8] |
Ceballos G, Ehrlich PR, Barnosky AD, García A, Pringle RM, Palmer TM (2015) Accelerated modern human-induced species losses: Entering the sixth mass extinction. Science Advances, 1, e1400253.
DOI URL |
| [9] | Chen PQ, Xue YG (2024) Relationship between functional characteristics of herbs and soil physical and chemical factors in Dashiwei Tiankeng Group, Guangxi. Seed Science and Technology, 42(12), 154-157. (in Chinese with English abstract) |
| [陈佩琦, 薛跃规 (2024) 广西大石围天坑群草本植物功能性状与土壤理化因子的关系. 种子科技, 42(12), 154-157.] | |
| [10] |
Deng B, Wang XF, Liao J (2024) Ecophysiological responses of herbaceous and woody plants to environmental stresses in the riparian zone of Three Gorges Reservoir: A meta-analysis. Chinese Journal of Plant Ecology, 48, 623-637. (in Chinese with English abstract)
DOI |
|
[邓蓓, 王晓锋, 廖君 (2024) 环境胁迫影响三峡库区消落带草本和木本植物生理生态特征的meta分析. 植物生态学报, 48, 623-637.]
DOI |
|
| [11] | Doughty CE, Goulden ML (2008) Are tropical forests near a high temperature threshold? Journal of Geophysical Research: Biogeosciences, 113, 2007JG000632. |
| [12] |
Drake JM, Wares JP, Byers JE, Anderson JT (2025) Two hypotheses about climate change and species distributions. Ecology Letters, 28, e70134.
DOI URL |
| [13] |
El Omari B (2022) Accumulation versus storage of total non-structural carbohydrates in woody plants. Trees, 36, 869-881.
DOI |
| [14] |
Fan ZF, Kabrick JM, Shifley SR (2006) Classification and regression tree based survival analysis in oak-dominated forests of Missouri’s Ozark Highlands. Canadian Journal of Forest Research, 36, 1740-1748.
DOI URL |
| [15] |
Feng C, Zhang J, Huang HW (2023) Parallel situ conservation: A new plant conservation strategy to integrate in situ and ex situ conservation of plants. Biodiversity Science, 31, 23184. (in Chinese with English abstract)
DOI URL |
|
[冯晨, 张洁, 黄宏文 (2023) 统筹植物就地保护与迁地保护的解决方案: 植物并地保护(parallel situ conservation). 生物多样性, 31, 23184.]
DOI |
|
| [16] | Feng Y, Wang YQ, Li YK, Han L, Wang HZ (2024) Relationship between leaf functional traits of Populus euphratica and soil factors. Acta Ecologica Sinica, 44, 1717-1726. (in Chinese with English abstract) |
| [冯宇, 王雨晴, 李沅楷, 韩路, 王海珍 (2024) 胡杨叶功能性状与土壤因子的关系. 生态学报, 44, 1717-1726.] | |
| [17] |
Fick SE, Hijmans RJ (2017) WorldClim 2: New 1-km spatial resolution climate surfaces for global land areas. International Journal of Climatology, 37, 4302-4315.
DOI URL |
| [18] | Harrell FE (2015) Regression Modeling Strategies: With Applications to Linear Models, Logistic and Ordinal Regression, and Survival Analysis. Springer, Cham, Switzerland. |
| [19] | Hijmans RJ (2025) raster: Geographic Data Analysis and Modeling. (accessed on 2025-04-12) |
| [20] |
Jin Y, Qian H (2019) V.PhyloMaker: An R package that can generate very large phylogenies for vascular plants. Ecography, 42, 1353-1359.
DOI |
| [21] |
Jhanji S, Chumber M, Kaur G, Kaur R, Goyal E, Dhingra M (2025) Nutrient driven stress resilience: Mechanisms of nutrient uptake, sensing and signaling in plants. Plant Physiology and Biochemistry, 229, 110456.
DOI URL |
| [22] |
Küpper FC, Kamenos NA (2018) The future of marine biodiversity and marine ecosystem functioning in UK coastal and territorial waters (including UK Overseas Territories) with an emphasis on marine macrophyte communities. Botanica Marina, 61, 521-535.
DOI URL |
| [23] |
Lee-Yaw JA, Kharouba HM, Bontrager M, Mahony C, Csergő AM, Noreen AME, Li Q, Schuster R, Angert AL (2016) A synthesis of transplant experiments and ecological niche models suggests that range limits are often niche limits. Ecology Letters, 19, 710-722.
DOI PMID |
| [24] | Li CM (2020) Mortality model of Larix olgensis-Abies nephrolepis-Picea jazoensis mixed stands based on Cox proportional hazard function and mixed effect model. Forest Research, 33(3), 92-98. (in Chinese with English abstract) |
| [李春明 (2020) 基于Cox比例风险函数及混合效应的落叶松云冷杉混交林林木枯损模型研究. 林业科学研究, 33(3), 92-98.] | |
| [25] |
Li WT, Migliavacca M, Forkel M, Denissen JMC, Reichstein M, Yang H, Duveiller G, Weber U, Orth R (2022) Widespread increasing vegetation sensitivity to soil moisture. Nature Communications, 13, 3959.
DOI PMID |
| [26] |
Lin YW, Xie T, Shan RX, Li XR (2025) Non-linear responses of life-history strategies to warming in arid desert herbaceous plants. Ecological Indicators, 176, 113742.
DOI URL |
| [27] |
Liu MX, Liang GL (2016) Research progress on leaf mass per area. Chinese Journal of Plant Ecology, 40, 847-860. (in Chinese with English abstract)
DOI URL |
|
[刘明秀, 梁国鲁 (2016) 植物比叶质量研究进展. 植物生态学报, 40, 847-860.]
DOI |
|
| [28] |
Lubbe FC, Klimešová J, Henry HAL (2021) Winter belowground: Changing winters and the perennating organs of herbaceous plants. Functional Ecology, 35, 1627-1639.
DOI URL |
| [29] |
Ma Z, Guo D, Xu X, Lu M, Bardgett RD, Eissenstat DM, McCormack ML, Hedin LO (2018) Evolutionary history resolves global organization of root functional traits. Nature, 555, 94-99.
DOI URL |
| [30] | Mao X, Jiang HC, Yang GF, Xu HY (2011) Preliminary study on spatial and temporal characteristics of palaeoclimate evolution in China during the last deglaciation. Quaternary Sciences, 31, 57-65. (in Chinese with English abstract) |
| [毛雪, 蒋汉朝, 杨桂芳, 徐红艳 (2011) 我国末次冰消期古气候时空演化特征初探. 第四纪研究, 31, 57-65.] | |
| [31] |
Mauget SA, Himanshu SK, Goebel TS, Ale S, Lascano RJ, Gitz DC III (2021) Soil and soil organic carbon effects on simulated Southern High Plains dryland cotton production. Soil and Tillage Research, 212, 105040.
DOI URL |
| [32] | Moore DF (2016) Applied Survival Analysis Using R. Springer, Cham, Switzerland. |
| [33] |
Nievola CC, Carvalho CP, Carvalho V, Rodrigues E (2017) Rapid responses of plants to temperature changes. Temperature, 4, 371-405.
DOI PMID |
| [34] |
Passioura JB (2002) Soil conditions and plant growth. Plant, Cell & Environment, 25, 311-318.
DOI URL |
| [35] |
Peng N, Wang Y, Wu HF, Hao HJ, Sailike A, Yu ZC, Li SC, Shi RH, Hao WF, Zhang W (2025) Phosphorus cycling dominates microbial regulation of synergistic carbon, nitrogen, and phosphorus gene dynamics during Robinia pseudoacacia restoration on the Loess Plateau. Agronomy, 15, 797.
DOI URL |
| [36] |
Penksza K, Szabó-Szöllősi T, Sipos L, Szentes S, Saláta-Falusi E, Takács A, Boros N, Sebők A, Dálnoki BA, Fuchs M, Micheli E, Gulyás M, Penksza P, Pintér O, Wagenhoffer Z, Kende Z, Csízi I, Tuba G, Zsembeli J (2025) Which soil type is optimal for Festuca wagneri, a species of the pannonian region adapted to drought? Land, 14, 2405.
DOI URL |
| [37] |
Reich PB (2014) The world-wide ‘fast-slow’ plant economics spectrum: A traits manifesto. Journal of Ecology, 102, 275-301.
DOI URL |
| [38] |
Ren XY, Cai LQ, Wu J, Ahmad MK, Haider FU (2025) Dynamics of soil organic carbon mineralization under straw addition: Evidence from a controlled incubation experiment. Agronomy, 15, 2642.
DOI URL |
| [39] |
Rosenblad KC, Perret DL, Sax DF (2019) Niche syndromes reveal climate-driven extinction threat to island endemic conifers. Nature Climate Change, 9, 627-631.
DOI |
| [40] |
Sáenz-Romero C, Mendoza-Maya E, Gómez-Pineda E, Blanco-García A, Endara-Agramont AR, Lindig-Cisneros R, López-Upton J, Trejo-Ramírez O, Wehenkel C, Cibrián-Tovar D, Flores-López C, Plascencia-González A, Vargas-Hernández JJ (2020) Recent evidence of Mexican temperate forest decline and the need for ex situ conservation, assisted migration, and translocation of species ensembles as adaptive management to face projected climatic change impacts in a megadiverse country. Canadian Journal of Forest Research, 50, 843-854.
DOI URL |
| [41] |
Shi FX, Zhao CZ, Ren H, Zhou W, Gao FY, Sheng YP, Li LL (2012) Plant functional types and their impact environmental factors in a naturally recovered poplar-birch woodland on the north slope of Qilian Mountains, China. Chinese Journal of Applied and Environmental Biology, 18, 546-552. (in Chinese with English abstract)
DOI URL |
| [石福习, 赵成章, 任珩, 周伟, 高福元, 盛亚萍, 李丽丽 (2012) 祁连山北坡自然恢复杨桦林地植物功能型组成及其影响因素. 应用与环境生物学报, 18, 546-552.] | |
| [42] |
Smith SA, Donoghue MJ (2008) Rates of molecular evolution are linked to life history in flowering plants. Science, 322, 86-89.
DOI PMID |
| [43] | Therneau TM (2024) Coxme: Mixed Effects Cox Models. . (accessed on 2025-06-20) |
| [44] | Therneau TM, Grambsch PM (2000) The Cox model. In: Modeling Survival Data: Extending the Cox Model (eds Dietz K, Gail M, Krickeberg K, Samet J, Tsiatis A), pp.39-77. Springer, New York. |
| [45] |
Thomas G, Sucher R, Wyatt A, Jiménez I (2022) Ex situ species conservation: Predicting plant survival in botanic gardens based on climatic provenance. Biological Conservation, 265, 109410.
DOI URL |
| [46] | Vincent H, Bornand CN, Kempel A, Fischer M (2020) Rare species perform worse than widespread species under changed climate. Biological Conservation, 246, 108586. |
| [47] |
Volaire F, Norton M (2006) Summer dormancy in perennial temperate grasses. Annals of Botany, 98, 927-933.
DOI PMID |
| [48] | Wang N, Zhao MM, Li Q, Liu X, Song HJ, Peng XQ, Wang H, Yang N, Fan PX, Wang RQ, Du N (2020) Effects of defoliation modalities on plant growth, leaf traits, and carbohydrate allocation in Amorpha fruticosa L. and Robinia pseudoacacia L. seedlings. Annals of Forest Science, 77, 53. |
| [49] |
Wang TT, Huang L, Zhang X, Wang M, Tan DY (2022) Root morphology and biomass allocation of 50 annual ephemeral species in relation to two soil conditions. Plants, 11, 2495.
DOI URL |
| [50] |
Weigel R, Werner A, Würzberg L, Zembold K, Angulo K, Bach W, Hémonnet-Dal C, Nähring T, Hiebenga M, Muffler L (2025) Root and shoot traits of two common herbs respond differently to drought and fertilization in a multifactorial global change experiment. Plant and Soil, 514, 2975-2990.
DOI |
| [51] |
Woodall CW, Grambsch PL, Thomas W (2005) Applying survival analysis to a large-scale forest inventory for assessment of tree mortality in Minnesota. Ecological Modelling, 189, 199-208.
DOI URL |
| [52] | Woodward FI (1987) Climate and Plant Distribution. Cambridge University Press, Cambridge. |
| [53] | Wu JZ, Sun F, Cui Y, He JW, Liu Y, Li J, Lin YM, Wang DJ (2020) Relationship between vegetation biomass and soil bulk density on unstable slopes in different climatic regions: A case study of Jiangjiagou Watershed in Dongchuan District of Kunming City, Yunnan Province of southwestern China. Journal of Beijing Forestry University, 42(3), 24-35. (in Chinese with English abstract) |
| [吴建召, 孙凡, 崔羽, 贺静雯, 刘颖, 李键, 林勇明, 王道杰 (2020) 不同气候区失稳性坡面植被生物量与土壤密度的关系——以云南省昆明市东川区蒋家沟流域为例. 北京林业大学学报, 42(3), 24-35.] | |
| [54] | Xi LL, Gou QQ, Wang GH, Song B (2021) The responses of typical annual herbaceous plants to drought stress in a desert-oasis ecotone. Acta Ecologica Sinica, 41, 5425-5434. (in Chinese with English abstract) |
| [席璐璐, 缑倩倩, 王国华, 宋冰 (2021) 荒漠绿洲过渡带一年生草本植物对干旱胁迫的响应. 生态学报, 41, 5425-5434.] | |
| [55] | Xing YJ, Chen MH, Dao JC, Lin LX, Chen CY, Chen YL, Wang ZT (2024) Fine-root morphology of woody and herbaceous plants responds differently to altered precipitation: A meta-analysis. Forest Ecology and Management, 552, 121570. |
| [56] | Xu LM, Cao Y, Tang SW, Lu YH, Luo SS, Ma YS (2020) Effects of drought stress and rewatering on physiological characteristics of Arundo donax var. versicolor. Science of Soil and Water Conservation, 18(3), 59-66. (in Chinese with English abstract) |
| [许令明, 曹昀, 汤思文, 陆远鸿, 罗姗姗, 马银山 (2020) 干旱胁迫及复水对花叶芦竹生理特性的影响. 中国水土保持科学(中英文), 18(3), 59-66.] | |
| [57] | Yang ZB, Tao JC, Huang ZY, Zong SX, Hao RM (2000) Ex situ conservation of rare and endangered plants of subtropical distribution in China. Journal of Nanjing Forestry University (Natural Sciences Edition), 24(S1), 43-46. (in Chinese with English abstract) |
|
[杨志斌, 陶金川, 黄致远, 宗世贤, 郝日明 (2000) 中国亚热带稀有濒危活植物的迁地保育. 南京林业大学学报(自然科学版), 24(S1), 43-46.]
DOI |
|
| [58] | Zhang JL, Cao KF (2003) The effects of night chilling on chlorophyll fluorescence in seedlings of two tropical rain forest tree species. Journal of Wuhan Botanical Research, 21, 356-360. (in Chinese with English abstract) |
| [张教林, 曹坤芳 (2003) 夜间低温对2种热带雨林树种幼苗叶绿素荧光的影响. 武汉植物学研究, 21, 356-360.] | |
| [59] | Zhang JQ, Zhang JY, Wang YR, Han TW (2014) Adaptability of introduced species for improvement of degraded alpine grassland in Gannan areas, China. Pratacultural Science, 31, 744-753. (in Chinese with English abstract) |
| [张建全, 张吉宇, 王彦荣, 韩天文 (2014) 高寒草甸退化草地引种适应性. 草业科学, 31, 744-753.] | |
| [60] | Zhang XP, Luo ZR, Li X, Chen J, Wan LX (2016) Evaluation on the adaptability of the introduction of 36 species of rare and endangered plants. Journal of Green Science and Technology, (15), 33-35, 37. (in Chinese with English abstract) |
| [张学平, 罗昭润, 李鑫, 陈杰, 万利鑫 (2016) 36种珍稀濒危植物引种适应性评价. 绿色科技, (15), 33-35, 37.] | |
| [61] |
Zhang Z, Wang SJ, Chen MK, Cao R, Li SH (2019) Temporal characteristics of soil N2O emission of different succession stages in Xishuangbanna tropical forests. Ecology and Environment Sciences, 28, 702-708. (in Chinese with English abstract)
DOI |
|
[张哲, 王邵军, 陈闽昆, 曹润, 李少辉 (2019) 西双版纳不同演替阶段热带森林土壤N2O排放的时间特征. 生态环境学报, 28, 702-708.]
DOI |
|
| [62] | Zhao DD, Ma HY, Li Y, Wei JP, Wang ZC (2019) Effects of water and nutrient additions on functional traits and aboveground biomass of Leymus chinensis. Chinese Journal of Plant Ecology, 43, 501-511. (in Chinese with English abstract) |
|
[赵丹丹, 马红媛, 李阳, 魏继平, 王志春 (2019) 水分和养分添加对羊草功能性状和地上生物量的影响. 植物生态学报, 43, 501-511.]
DOI |
|
| [63] |
Zhao JB, Zhang YP, Song FQ, Xu ZF, Xiao YL (2009) A comparison of the phenological characteristics of introduced plant species in the Xishuangbanna Tropical Botanical Garden. Bulletin of Botany, 44, 464-472. (in Chinese with English abstract)
DOI |
|
[赵俊斌, 张一平, 宋富强, 许再富, 肖云来 (2009) 西双版纳热带植物园引种植物物候特征比较. 植物学报, 44, 464-472.]
DOI |
|
| [64] |
Zhao JB, Zhang YP, Song FQ, Xu ZF, Xiao LY (2010) Spring phenology of introduced species in response to extreme chilliness in Xishuangbanna Tropical Botanical Garden. Bulletin of Botany, 45, 435-443. (in Chinese with English abstract)
DOI |
|
[赵俊斌, 张一平, 宋富强, 许再富, 肖来云 (2010) 引种保护植物对西双版纳极端冷年的春季物候响应. 植物学报, 45, 435-443.]
DOI |
|
| [65] | Zhao XQ, Pan XZ, Ma HY, Dong XY, Che J, Wang C, Shi Y, Liu KL, Shen RF (2023) Scientific issues and strategies of acid soil use in China. Acta Pedologica Sinica, 60, 1248-1263. (in Chinese with English abstract) |
| [赵学强, 潘贤章, 马海艺, 董晓英, 车景, 王超, 时玉, 柳开楼, 沈仁芳 (2023) 中国酸性土壤利用的科学问题与策略. 土壤学报, 60, 1248-1263.] | |
| [66] | Zheng ZM, Kong LL, He Y (2025) TCN-GRU model with SMA-IQR and attention mechanism for ultra-short term wind power prediction. Journal of Yunnan University of Nationalities (Natural Sciences Edition), 34, 480-486. (in Chinese with English abstract) |
| [郑哲明, 孔玲玲, 何印 (2025) 引入SMA-IQR和注意力机制的TCN-GRU模型超短期风电功率预测. 云南民族大学学报(自然科学版), 34, 480-486.] | |
| [67] | Zhou YH, Liu H, Zhang SK, Liu FY, Liu N (2023) Adaptation strategies of 29 species to tropical coral islands based on leaf anatomical traits. Journal of Tropical and Subtropical Botany, 31, 747-756. (in Chinese with English abstract) |
| [周雨珩, 刘慧, 张世柯, 刘芳延, 刘楠 (2023) 基于叶片解剖性状探究29种植物对热带珊瑚岛的适应策略. 热带亚热带植物学报, 31, 747-756.] | |
| [68] | Zhu H, Wang H, Li BG, Xu ZF (1999) The urgency of protection for tropical vegetation and its diversity in Xishuangbanna. Tropical Plant Research, (44), 1-10. (in Chinese) |
| [朱华, 王洪, 李保贵, 许再富 (1999) 西双版纳热带植被及其多样性保护的迫切性. 热带植物研究, (44), 1-10.] | |
| [69] | Zhu H (2007) On the classification of forest vegetation in Xishuangbanna, Southern Yunnan. Acta Bontanica Yunnanica, 29, 377-387. (in Chinese with English abstract) |
| [朱华 (2007) 论滇南西双版纳的森林植被分类. 云南植物研究, 29, 377-387.] | |
| [70] |
Zizka A, Silvestro D, Andermann T, Azevedo J, Duarte Ritter C, Edler D, Farooq H, Herdean A, Ariza M, Scharn R, Svantesson S, Wengström N, Zizka V, Antonelli A (2019) CoordinateCleaner: Standardized cleaning of occurrence records from biological collection databases. Methods in Ecology and Evolution, 10, 744-751.
DOI URL |
| [1] | 浦瑀璐, 周仕顺, 李仁. 中国、缅甸、老挝热带香料植物的民族植物学[J]. 生物多样性, 2026, 34(5): 25041-. |
| [2] | 黄语卓, 王梓潆, 周伟龙, 莫佳瑶, 张敏华, 郝春晖, 兰荣光, 叶沛阳, 刘宇. 浙江省百山祖25 ha亚热带森林动态监测样地木本植物叶片虫食强度分布格局及其影响因素[J]. 生物多样性, 2026, 34(4): 25406-. |
| [3] | 黄莉, 刘志发, 龚粤宁, 李步杭, 张健. 广东南岭16个1 ha森林动态监测样地植物群落组成与结构[J]. 生物多样性, 2026, 34(3): 25357-. |
| [4] | 高雅, 刘绮, 刘民峰, 马瑞霞, 黄甫昭, 李冬兴, 向悟生, 丁涛, 王斌, 李先琨, 郭屹立. 广西防城季节性雨林凋落物量时空动态及驱动因素[J]. 生物多样性, 2026, 34(1): 25326-. |
| [5] | 范平, 王欢, 温知新, 宋刚, 雷富民. 气候因子对鸟类遗传多样性与物种分布面积关系的影响[J]. 生物多样性, 2025, 33(8): 25072-. |
| [6] | 吴晓晴, 张美惠, 葛苏婷, 李漫淑, 达良俊, 宋坤, 沈国春, 张健. 上海近自然林重建过程中木本植物物种多样性与地上生物量的时空动态: 以闵行区生态岛为例[J]. 生物多样性, 2025, 33(5): 24444-. |
| [7] | 刘咏华, 童光蓉, 余航远, 王宁宁, 任海保, 陈磊, 马克平, 米湘成. 钱江源-百山祖国家公园候选区钱江源园区冠层三维结构及光谱特征对人为干扰的响应[J]. 生物多样性, 2025, 33(4): 24174-. |
| [8] | 廖之锴, 白皓天, 张修瀚, 余上, 凌嘉乐, 刘阳. 海南热带雨林国家公园常见鸟类鸣声数据集[J]. 生物多样性, 2025, 33(11): 25194-. |
| [9] | 靳川, 张子嘉, 底凯, 张卫荣, 乔栋, 程思源, 胡中民. 海南热带雨林植物光合荧光气体交换和叶功能性状数据集[J]. 生物多样性, 2024, 32(9): 24139-. |
| [10] | 艾妍雨, 胡海霞, 沈婷, 莫雨轩, 杞金华, 宋亮. 附生维管植物多样性及其与宿主特征的相关性: 以哀牢山中山湿性常绿阔叶林为例[J]. 生物多样性, 2024, 32(5): 24072-. |
| [11] | 魏嘉欣, 姜治国, 杨林森, 熊欢欢, 金胶胶, 罗方林, 李杰华, 吴浩, 徐耀粘, 乔秀娟, 魏新增, 姚辉, 余辉亮, 杨敬元, 江明喜. 湖北神农架中亚热带山地落叶阔叶林25 ha动态监测样地群落物种组成与结构特征[J]. 生物多样性, 2024, 32(3): 23338-. |
| [12] | 孟敬慈, 王国栋, 曹光兰, 胡楠林, 赵美玲, 赵延彤, 薛振山, 刘波, 朴文华, 姜明. 中国芦苇沼泽植物物种丰富度分布格局及其驱动因素[J]. 生物多样性, 2024, 32(2): 23194-. |
| [13] | 徐凯伦, 陈小荣, 张敏华, 于婉婉, 吴素美, 朱志成, 陈定云, 兰荣光, 董舒, 刘宇. 演替和地形共同影响浙江百山祖森林群落的性系统多样性[J]. 生物多样性, 2024, 32(12): 24338-. |
| [14] | 张楚然, 李生发, 李逢昌, 唐志忠, 刘辉燕, 王丽红, 顾荣, 邓云, 张志明, 林露湘. 云南鸡足山亚热带半湿润常绿阔叶林20 ha动态监测样地木本植物生境关联与群落数量分类[J]. 生物多样性, 2024, 32(1): 23393-. |
| [15] | 吴春玲, 罗竹慧, 李意德, 许涵, 陈德祥, 丁琼. 热带山地雨林木本豆科和樟科植物叶内生细菌群落: 物种与功能群多样性及驱动因子[J]. 生物多样性, 2023, 31(8): 23146-. |
| 阅读次数 | ||||||
|
全文 |
|
|||||
|
摘要 |
|
|||||
备案号:京ICP备16067583号-7
Copyright © 2026 版权所有 《生物多样性》编辑部
地址: 北京香山南辛村20号, 邮编:100093
电话: 010-62836137, 62836665 E-mail: biodiversity@ibcas.ac.cn
