
生物多样性 ›› 2022, Vol. 30 ›› Issue (2): 21115. DOI: 10.17520/biods.2021115 cstr: 32101.14.biods.2021115
所属专题: 土壤生物与土壤健康
陈胜仙1, 张喜亭1, 佘丹琦1, 张衷华1, 周志强1, 王慧梅1, 王文杰1,2,*( )
)
收稿日期:2021-03-29
接受日期:2021-11-18
出版日期:2022-02-20
发布日期:2022-02-28
通讯作者:
王文杰
作者简介:*E-mail: wangwenjie@iga.ac.cn基金资助:
Shengxian Chen1, Xiting Zhang1, Danqi She1, Zhonghua Zhang1, Zhiqiang Zhou1, Huimei Wang1, Wenjie Wang1,2,*()
Received:2021-03-29
Accepted:2021-11-18
Online:2022-02-20
Published:2022-02-28
Contact:
Wenjie Wang
摘要:
球囊霉素相关土壤蛋白(glomalin-related soil protein, GRSP)在土壤物理结构调节和土壤碳库稳定性中发挥着重要作用,但植物多样性和优势种如何影响GRSP还缺乏系统性研究。本研究依托东北林业大学哈尔滨实验林场的72块样地, 对1 m深土壤剖面分5层采样, 测定土壤易提取球囊霉素(easily extractable GRSP, EEG)、总提取球囊霉素(total GRSP, TG)及土壤理化性质, 并同时计算植物多样性指数及优势种重要值(importance value, IV), 进一步通过相关分析和冗余排序分析判断影响GRSP的主要因素与贡献。结果表明: (1)在整个土壤剖面上均表现为TG和EEG与土壤有机碳(SOC)正相关, 在部分土层深度与全氮(total nitrogen, TN)和含水量(moisture content, MC)正相关, 而与电导率(electrical conductivity, EC)和pH值负相关。(2)部分土层TG和EEG与黑皮油松(Pinus tabuliformis var. mukdensis)、樟子松(P. sylvestris var. mongolica)、胡桃楸(Juglans mandshurica)、黄檗(Phellodendron amurense)、榆树(Ulmus pumila)优势种重要值显著相关, 表现为黑皮油松重要值越高, 而黄檗、榆树重要值越小, 越有利于EEG的积累, 并且伴随EEG-C/SOC (EEG中C占SOC比例)增加、EEG/TG增大; 群落中胡桃楸、黄檗、榆树更有利于TG积累, 黑皮油松、落叶松(Larix gmelinii)、樟子松不利于TG的积累。(3)植物Simpson指数、Shannon-Wiener指数、物种丰富度与EEG、TG、EEG/TG无显著相关性, 而与EEG-C/SOC、EEG-N/TN (EEG中N占TN的比例)、TG-C/SOC (TG中C占SOC比例)、TG-N/TN (TG中N占TN的比例)显著负相关; 土壤EEG/TG和EEG-N/TN与植物均匀度指数显著正相关, 在1 m土壤不同土层趋势类似。(4)方差分解分析表明: 生物因子对GRSP变化的解释率是20.2%, 土壤理化因子解释率为7.8%, 而生物因子中植物优势种重要值的解释率最大(16.4%), 而植物物种多样性指数解释率仅为0.4%。冗余排序发现常绿针叶树种(黑皮油松和樟子松)越多且阔叶树种越少时, GRSP含量和GRSP对土壤碳氮的贡献越高(P < 0.01), 其机制可能与树种菌根类型有关: 外生菌根树种重要值与TG显著负相关, 丛枝菌根树种重要值与TG显著正相关。本研究解析了植物物种多样性对GRSP含量的重要影响, 并强调未来土壤管理和评估可以通过调整优势物种而不是树种多样性来促进GRSP积累。
陈胜仙, 张喜亭, 佘丹琦, 张衷华, 周志强, 王慧梅, 王文杰 (2022) 森林植物多样性、树种重要值与土壤理化性质对球囊霉素相关土壤蛋白的影响. 生物多样性, 30, 21115. DOI: 10.17520/biods.2021115.
Shengxian Chen, Xiting Zhang, Danqi She, Zhonghua Zhang, Zhiqiang Zhou, Huimei Wang, Wenjie Wang (2022) Effects of plant species diversity, dominant species importance, and soil properties on glomalin-related soil protein. Biodiversity Science, 30, 21115. DOI: 10.17520/biods.2021115.
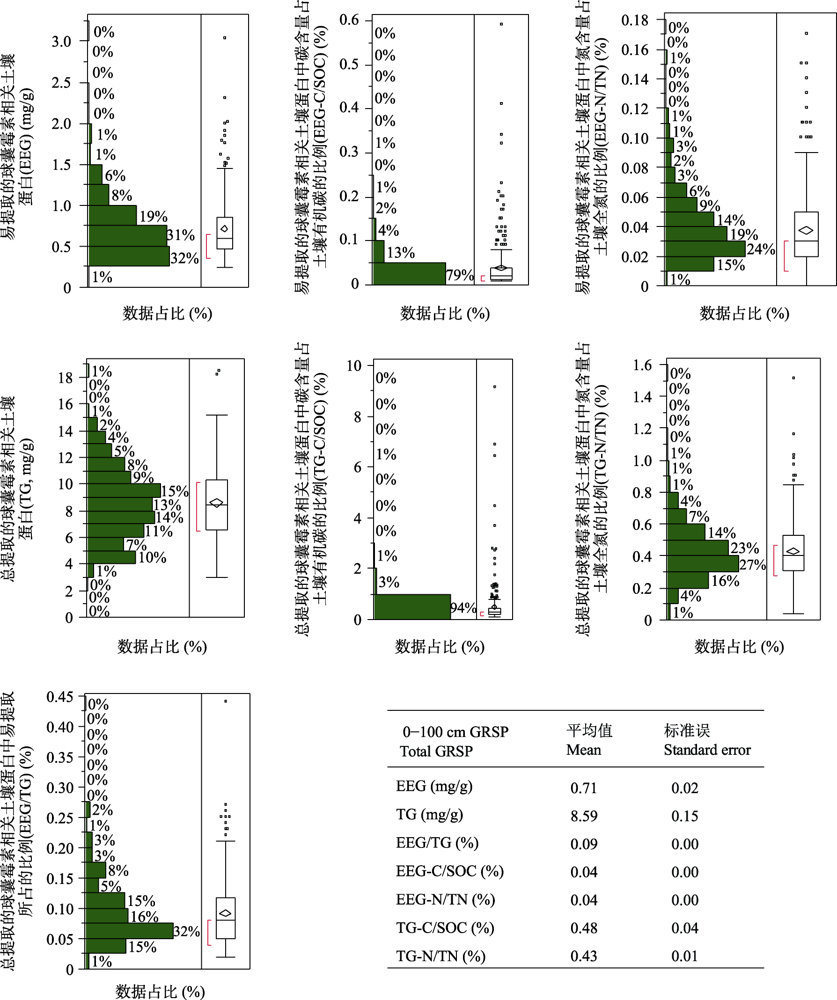
图1 0-100 cm土层GRSP相关指标频率分布箱线图。中括号代表最密集的50%数据分布区间。
Fig. 1 Frequency distribution of GRSP feature parameters at 0-100 cm soil depth. The bracket represents for the densest 50% data distribution interval. EEG, Easy to extract GRSP; TG, Total extracted GRSP; EEG/TG, EEG proportion to TG; EEG-C/SOC, Proportion of carbon in EEG to organic carbon; EEG-N/TN, Proportion of nitrogen content in EEG to total nitrogen; TG-C/SOC, Proportion of carbon in TG to organic carbon; TG-N/TN, Proportion of nitrogen content in TG to total nitrogen.
| GRSP指标 GRSP index | 土层深度 Soil depth (cm) | 有机碳 SOC | 全氮 TN | 电导率 EC | 酸碱度 pH | 含水量 MC | 容重 BD |
|---|---|---|---|---|---|---|---|
| 易提取GRSP | 0-20 | 0.279* | 0.157 | -0.139 | -0.163 | -0.030 | -0.114 |
| EEG | 20-40 | 0.269* | 0.288* | -0.220 | -0.328** | 0.161 | 0.011 |
| 40-60 | 0.288* | -0.053 | -0.139 | -0.104 | 0.175 | -0.027 | |
| 60-80 | 0.264* | 0.145 | -0.039 | -0.331** | 0.152 | 0.151 | |
| 80-100 | 0.112 | -0.046 | -0.023 | -0.063 | 0.050 | 0.072 | |
| 0-100 | 0.385** | 0.177** | -0.171** | -0.261* | 0.191** | -0.025 | |
| 总提取GRSP | 0-20 | 0.497** | 0.141 | -0.185 | -0.025 | 0.222 | -0.023 |
| TG | 20-40 | 0.593** | 0.380** | -0.365** | -0.177 | 0.375** | -0.180 |
| 40-60 | 0.347** | 0.170 | -0.252* | -0.003 | 0.152 | 0.077 | |
| 60-80 | 0.337** | 0.286* | -0.274* | -0.146 | 0.203 | 0.185 | |
| 80-100 | 0.437** | 0.170 | -0.200 | 0.017 | 0.146 | -0.246* | |
| 0-100 | 0.532** | 0.266** | -0.283** | -0.135* | 0.302** | -0.066 | |
| TG中EEG比例 | 0-20 | -0.106 | 0.033 | 0.059 | -0.050 | -0.141 | -0.081 |
| EEG/TG | 20-40 | -0.221 | -0.093 | 0.145 | -0.094 | -0.083 | 0.118 |
| 40-60 | 0.010 | -0.133 | 0.001 | -0.038 | 0.085 | -0.056 | |
| 60-80 | 0.043 | -0.083 | 0.149 | -0.115 | 0.111 | -0.017 | |
| 80-100 | -0.211 | -0.156 | 0.025 | -0.026 | -0.043 | 0.202 | |
| 0-100 | -0.012 | -0.037 | 0.019 | -0.101 | 0.011 | 0.010 |
表1 土壤理化性质与不同深度土壤GRSP的相关性
Table 1 Correlation of soil physico-chemical properties and GRSP in different soil depths
| GRSP指标 GRSP index | 土层深度 Soil depth (cm) | 有机碳 SOC | 全氮 TN | 电导率 EC | 酸碱度 pH | 含水量 MC | 容重 BD |
|---|---|---|---|---|---|---|---|
| 易提取GRSP | 0-20 | 0.279* | 0.157 | -0.139 | -0.163 | -0.030 | -0.114 |
| EEG | 20-40 | 0.269* | 0.288* | -0.220 | -0.328** | 0.161 | 0.011 |
| 40-60 | 0.288* | -0.053 | -0.139 | -0.104 | 0.175 | -0.027 | |
| 60-80 | 0.264* | 0.145 | -0.039 | -0.331** | 0.152 | 0.151 | |
| 80-100 | 0.112 | -0.046 | -0.023 | -0.063 | 0.050 | 0.072 | |
| 0-100 | 0.385** | 0.177** | -0.171** | -0.261* | 0.191** | -0.025 | |
| 总提取GRSP | 0-20 | 0.497** | 0.141 | -0.185 | -0.025 | 0.222 | -0.023 |
| TG | 20-40 | 0.593** | 0.380** | -0.365** | -0.177 | 0.375** | -0.180 |
| 40-60 | 0.347** | 0.170 | -0.252* | -0.003 | 0.152 | 0.077 | |
| 60-80 | 0.337** | 0.286* | -0.274* | -0.146 | 0.203 | 0.185 | |
| 80-100 | 0.437** | 0.170 | -0.200 | 0.017 | 0.146 | -0.246* | |
| 0-100 | 0.532** | 0.266** | -0.283** | -0.135* | 0.302** | -0.066 | |
| TG中EEG比例 | 0-20 | -0.106 | 0.033 | 0.059 | -0.050 | -0.141 | -0.081 |
| EEG/TG | 20-40 | -0.221 | -0.093 | 0.145 | -0.094 | -0.083 | 0.118 |
| 40-60 | 0.010 | -0.133 | 0.001 | -0.038 | 0.085 | -0.056 | |
| 60-80 | 0.043 | -0.083 | 0.149 | -0.115 | 0.111 | -0.017 | |
| 80-100 | -0.211 | -0.156 | 0.025 | -0.026 | -0.043 | 0.202 | |
| 0-100 | -0.012 | -0.037 | 0.019 | -0.101 | 0.011 | 0.010 |
| GRSP指标 GRSP index | 土层深度 Soil depth (cm) | Simpson指数 Simpson index | Shannon-Wiener指数 Shannon-Wiener index | 均匀度指数 Pielou index | 丰富度指数 Species richness | |||
|---|---|---|---|---|---|---|---|---|
| 易提取GRSP | 0-20 | -0.046 | -0.027 | 0.080 | 0.003 | |||
| EEG | 20-40 | 0.115 | 0.129 | -0.025 | 0.188 | |||
| 40-60 | 0.059 | 0.030 | 0.024 | -0.028 | ||||
| 60-80 | -0.065 | -0.067 | 0.201 | -0.097 | ||||
| 80-100 | 0.000 | -0.024 | 0.113 | -0.058 | ||||
| 0-100 | 0.004 | 0.005 | 0.064 | 0.007 | ||||
| 总提取GRSP | 0-20 | 0.022 | 0.062 | -0.140 | 0.150 | |||
| TG | 20-40 | 0.040 | 0.091 | -0.104 | 0.179 | |||
| 40-60 | -0.06 | 0.013 | -0.155 | 0.136 | ||||
| 60-80 | 0.128 | 0.179 | -0.035 | 0.201 | ||||
| 80-100 | 0.101 | 0.137 | -0.069 | 0.132 | ||||
| 0-100 | 0.042 | 0.087 | -0.039 | 0.147** | ||||
| TG中EEG比例 | 0-20 | 0.023 | 0.018 | 0.139 | -0.011 | |||
| EEG/TG | 20-40 | 0.016 | -0.025 | 0.054 | -0.048 | |||
| 40-60 | 0.129 | 0.066 | 0.114 | -0.060 | ||||
| 60-80 | -0.075 | -0.104 | 0.188 | -0.136 | ||||
| 80-100 | -0.065 | -0.097 | 0.134 | -0.111 | ||||
| 0-100 | 0.006 | -0.024 | 0.123* | -0.066 | ||||
| EEG中C占SOC比例 | 0-20 | -0.248* | -0.244* | -0.012 | -0.221 | |||
| EEG-C/SOC | 20-40 | -0.044 | -0.067 | 0.101 | -0.110 | |||
| 40-60 | -0.279* | -0.299* | 0.133 | -0.305* | ||||
| 60-80 | -0.197 | -0.207 | 0.085 | -0.211 | ||||
| 80-100 | -0.072 | -0.117 | -0.005 | -0.156 | ||||
| 0-100 | -0.173** | -0.190** | 0.073 | -0.202** | ||||
| EEG中N占TN比例 | 0-20 | -0.336** | -0.360** | 0.192 | -0.374** | |||
| EEG-N/TN | 20-40 | -0.200 | -0.230 | 0.076 | -0.227 | |||
| 40-60 | -0.218 | -0.247* | 0.121 | -0.292* | ||||
| 60-80 | -0.244* | -0.257* | 0.220 | -0.275* | ||||
| 80-100 | -0.307* | -0.334** | 0.185 | -0.344** | ||||
| 0-100 | -0.254** | -0.278** | 0.158** | -0.293** | ||||
| TG中C占SOC比例 | 0-20 | -0.294* | -0.282* | -0.158 | -0.233 | |||
| TG-C/SOC | 20-40 | -0.052 | -0.037 | 0.045 | -0.059 | |||
| 40-60 | -0.297* | -0.311** | 0.131 | -0.296* | ||||
| 60-80 | -0.094 | -0.117 | 0.043 | -0.138 | ||||
| 80-100 | -0.097 | -0.121 | -0.107 | -0.139 | ||||
| 0-100 | -0.146* | -0.158** | 0.030 | -0.162** | ||||
| TG中N占TN比例 | 0-20 | -0.241* | -0.265* | 0.068 | -0.288* | |||
| TG-N/TN | 20-40 | -0.369** | -0.336** | -0.086 | -0.263* | |||
| 40-60 | -0.488** | -0.465** | 0.087 | -0.392** | ||||
| 60-80 | -0.286* | -0.283* | 0.171 | -0.298* | ||||
| 80-100 | -0.400** | -0.384** | 0.121 | -0.368** | ||||
| 0-100 | -0.340** | -0.332** | 0.074 | -0.313** | ||||
表2 植物多样性指数与不同土层深度GRSP相关性比较
Table 2 Correlation of plant diversity index and GRSP in different soil depths
| GRSP指标 GRSP index | 土层深度 Soil depth (cm) | Simpson指数 Simpson index | Shannon-Wiener指数 Shannon-Wiener index | 均匀度指数 Pielou index | 丰富度指数 Species richness | |||
|---|---|---|---|---|---|---|---|---|
| 易提取GRSP | 0-20 | -0.046 | -0.027 | 0.080 | 0.003 | |||
| EEG | 20-40 | 0.115 | 0.129 | -0.025 | 0.188 | |||
| 40-60 | 0.059 | 0.030 | 0.024 | -0.028 | ||||
| 60-80 | -0.065 | -0.067 | 0.201 | -0.097 | ||||
| 80-100 | 0.000 | -0.024 | 0.113 | -0.058 | ||||
| 0-100 | 0.004 | 0.005 | 0.064 | 0.007 | ||||
| 总提取GRSP | 0-20 | 0.022 | 0.062 | -0.140 | 0.150 | |||
| TG | 20-40 | 0.040 | 0.091 | -0.104 | 0.179 | |||
| 40-60 | -0.06 | 0.013 | -0.155 | 0.136 | ||||
| 60-80 | 0.128 | 0.179 | -0.035 | 0.201 | ||||
| 80-100 | 0.101 | 0.137 | -0.069 | 0.132 | ||||
| 0-100 | 0.042 | 0.087 | -0.039 | 0.147** | ||||
| TG中EEG比例 | 0-20 | 0.023 | 0.018 | 0.139 | -0.011 | |||
| EEG/TG | 20-40 | 0.016 | -0.025 | 0.054 | -0.048 | |||
| 40-60 | 0.129 | 0.066 | 0.114 | -0.060 | ||||
| 60-80 | -0.075 | -0.104 | 0.188 | -0.136 | ||||
| 80-100 | -0.065 | -0.097 | 0.134 | -0.111 | ||||
| 0-100 | 0.006 | -0.024 | 0.123* | -0.066 | ||||
| EEG中C占SOC比例 | 0-20 | -0.248* | -0.244* | -0.012 | -0.221 | |||
| EEG-C/SOC | 20-40 | -0.044 | -0.067 | 0.101 | -0.110 | |||
| 40-60 | -0.279* | -0.299* | 0.133 | -0.305* | ||||
| 60-80 | -0.197 | -0.207 | 0.085 | -0.211 | ||||
| 80-100 | -0.072 | -0.117 | -0.005 | -0.156 | ||||
| 0-100 | -0.173** | -0.190** | 0.073 | -0.202** | ||||
| EEG中N占TN比例 | 0-20 | -0.336** | -0.360** | 0.192 | -0.374** | |||
| EEG-N/TN | 20-40 | -0.200 | -0.230 | 0.076 | -0.227 | |||
| 40-60 | -0.218 | -0.247* | 0.121 | -0.292* | ||||
| 60-80 | -0.244* | -0.257* | 0.220 | -0.275* | ||||
| 80-100 | -0.307* | -0.334** | 0.185 | -0.344** | ||||
| 0-100 | -0.254** | -0.278** | 0.158** | -0.293** | ||||
| TG中C占SOC比例 | 0-20 | -0.294* | -0.282* | -0.158 | -0.233 | |||
| TG-C/SOC | 20-40 | -0.052 | -0.037 | 0.045 | -0.059 | |||
| 40-60 | -0.297* | -0.311** | 0.131 | -0.296* | ||||
| 60-80 | -0.094 | -0.117 | 0.043 | -0.138 | ||||
| 80-100 | -0.097 | -0.121 | -0.107 | -0.139 | ||||
| 0-100 | -0.146* | -0.158** | 0.030 | -0.162** | ||||
| TG中N占TN比例 | 0-20 | -0.241* | -0.265* | 0.068 | -0.288* | |||
| TG-N/TN | 20-40 | -0.369** | -0.336** | -0.086 | -0.263* | |||
| 40-60 | -0.488** | -0.465** | 0.087 | -0.392** | ||||
| 60-80 | -0.286* | -0.283* | 0.171 | -0.298* | ||||
| 80-100 | -0.400** | -0.384** | 0.121 | -0.368** | ||||
| 0-100 | -0.340** | -0.332** | 0.074 | -0.313** | ||||
| GRSP指标 GRSP index | 土层深度 Soil depth (cm) | 分类学种重要值 Importance value of taxonomic species | 共生型种重要值 Importance value of symbiosis type | ||||||||
|---|---|---|---|---|---|---|---|---|---|---|---|
| 黑皮油松 P. tab | 胡桃楸 J. man | 黄檗 P. amu | 落叶松 L. gme | 蒙古栎 Q. mon | 水曲柳 F. man | 榆树 U. pum | 樟子松 P. syl | 外生菌根型 EcM | 丛枝菌根型 AM | ||
| 易提取GRSP EEG | 0-100 | 0.129** | -0.147** | -0.035 | 0.084 | -0.055 | -0.022 | -0.058 | 0.120* | 0.210 | -0.201 |
| 0-20 | 0.178 | -0.235 | 0.000 | 0.017 | -0.118 | 0.032 | 0.004 | 0.198 | 0.131 | -0.103 | |
| 20-40 | 0.026 | -0.159 | 0.027 | -0.002 | -0.035 | -0.060 | -0.098 | 0.246* | 0.096 | -0.125 | |
| 40-60 | -0.007 | -0.169 | 0.045 | 0.126 | 0.018 | 0.027 | -0.105 | 0.167 | 0.133 | -0.090 | |
| 60-80 | 0.342** | -0.100 | -0.186 | 0.256* | -0.076 | -0.171 | -0.051 | -0.025 | 0.183 | -0.215 | |
| 80-100 | 0.228 | -0.188 | -0.164 | 0.225 | -0.071 | 0.023 | -0.207 | 0.077 | 0.231 | -0.214 | |
| 总提取GRSP TG | 0-100 | -0.168** | 0.220** | 0.222** | -0.190** | -0.024 | -0.038 | 0.174** | -0.280** | -0.376** | 0.287** |
| 0-20 | -0.233 | 0.173 | 0.207 | -0.220 | -0.031 | -0.027 | 0.209 | -0.093 | -0.315** | 0.271* | |
| 20-40 | -0.203 | 0.255* | 0.175 | -0.239 | -0.048 | 0.017 | 0.208 | -0.249* | -0.414** | 0.342** | |
| 40-60 | -0.032 | 0.189 | 0.156 | -0.202 | 0.005 | -0.082 | 0.164 | -0.435** | -0.364** | 0.205 | |
| 60-80 | -0.169 | 0.283* | 0.372** | -0.227 | 0.007 | -0.169 | 0.169 | -0.397** | -0.440** | 0.304* | |
| 80-100 | -0.253* | 0.313** | 0.332** | -0.157 | -0.053 | 0.027 | 0.190 | -0.441** | -0.546** | 0.444** | |
| TG中EEG比例 EEG/TG | 0-100 | 0.221** | -0.230** | -0.160** | 0.194** | -0.077 | 0.008 | -0.150** | 0.281** | 0.336** | -0.280** |
| 0-20 | 0.189 | -0.245* | -0.110 | 0.200 | -0.123 | 0.089 | -0.096 | 0.203 | 0.232 | -0.193 | |
| 20-40 | 0.289* | -0.283* | -0.145 | 0.130 | -0.050 | -0.090 | -0.221 | 0.390** | 0.450** | -0.403** | |
| 40-60 | -0.073 | -0.208 | -0.053 | 0.233 | -0.031 | 0.086 | -0.154 | 0.437** | 0.285* | -0.170 | |
| 60-80 | 0.389** | -0.221 | -0.258* | 0.298* | -0.099 | -0.061 | -0.116 | 0.175 | 0.400** | -0.344** | |
| 80-100 | 0.383** | -0.266* | -0.280* | 0.127 | -0.076 | -0.010 | -0.268* | 0.330** | 0.455** | -0.413** | |
| EEG中 C占SOC 比例 EEG-C/ SOC | 0-100 | 0.401** | -0.142** | -0.150** | -0.032 | -0.032 | -0.085 | -0.180** | 0.119* | 0.312** | -0.288** |
| 0-20 | 0.490** | -0.250* | -0.170 | -0.015 | 0.086 | -0.035 | -0.261* | 0.080 | 0.442** | -0.370** | |
| 20-40 | 0.312** | -0.169 | -0.101 | -0.078 | -0.002 | -0.182 | -0.132 | 0.239* | 0.334** | -0.330** | |
| 40-60 | 0.495** | -0.194 | -0.202 | 0.041 | -0.039 | -0.007 | -0.250* | 0.044 | 0.347** | -0.323** | |
| 60-80 | 0.585** | -0.149 | -0.138 | -0.116 | -0.107 | -0.175 | -0.146 | 0.146 | 0.368** | -0.334** | |
| 80-100 | 0.223 | 0.013 | -0.162 | -0.086 | -0.057 | -0.160 | -0.191 | 0.268* | 0.249* | -0.242* | |
| EEG中N 占TN 比例 EEG- N/TN | 0-100 | 0.519** | -0.274** | -0.236** | -0.007 | 0.078 | -0.105 | -0.237** | 0.228** | 0.552** | -0.450** |
| 0-20 | 0.542** | -0.286* | -0.263* | -0.078 | 0.170 | -0.029 | -0.275* | 0.129 | 0.551** | -0.435** | |
| 20-40 | 0.469** | -0.320** | -0.192 | -0.054 | 0.105 | -0.159 | -0.245* | 0.293* | 0.564** | -0.503** | |
| 40-60 | 0.294* | -0.310** | -0.132 | 0.017 | 0.134 | -0.084 | -0.241* | 0.416** | 0.570** | -0.421** | |
| 60-80 | 0.654** | -0.203 | -0.278* | 0.058 | -0.015 | -0.159 | -0.180 | 0.110 | 0.520** | -0.431** | |
| 80-100 | 0.654** | -0.309* | -0.337** | 0.019 | 0.018 | -0.084 | -0.296* | 0.298* | 0.651** | -0.526** | |
| TG中C占SOC比例 TG-C/ SOC | 0-100 | 0.322** | -0.035 | -0.075 | -0.077 | -0.021 | -0.102 | -0.122* | -0.024 | 0.160** | -0.172** |
| 0-20 | 0.388** | -0.127 | -0.078 | -0.110 | 0.258* | -0.122 | -0.318** | -0.056 | 0.383** | -0.329** | |
| 20-40 | 0.151 | -0.067 | -0.010 | -0.125 | 0.014 | -0.145 | -0.002 | 0.043 | 0.097 | -0.146 | |
| 40-60 | 0.554** | -0.147 | -0.170 | -0.026 | -0.037 | -0.044 | -0.214 | -0.075 | 0.290* | -0.288* | |
| 60-80 | 0.439** | -0.053 | -0.066 | -0.122 | -0.066 | -0.159 | -0.107 | -0.016 | 0.195 | -0.212 | |
| 80-100 | 0.022 | 0.242* | -0.015 | -0.121 | -0.048 | -0.167 | -0.091 | 0.006 | -0.059 | 0.011 | |
| TG中N占TN比例 TG-N/ TN | 0-100 | 0.438** | -0.085 | -0.135** | -0.193** | 0.226** | -0.152** | -0.155** | -0.005 | 0.388** | -0.277* |
| 0-20 | 0.326** | 0.006 | -0.134 | -0.230 | 0.351** | -0.109 | -0.183 | -0.091 | 0.349** | -0.197 | |
| 20-40 | 0.327** | -0.189 | -0.148 | -0.202 | 0.245* | -0.211 | -0.057 | 0.018 | 0.348** | -0.352** | |
| 40-60 | 0.588** | -0.158 | -0.153 | -0.205 | 0.208 | -0.205 | -0.228 | 0.015 | 0.494** | -0.399** | |
| 60-80 | 0.542** | -0.020 | -0.127 | -0.190 | 0.178 | -0.185 | -0.221 | -0.004 | 0.433** | -0.278* | |
| 80-100 | 0.493** | -0.120 | -0.133 | -0.152 | 0.137 | -0.097 | -0.097 | 0.066 | 0.427** | -0.240* | |
表3 研究样地8树种重要值与不同土层GRSP指标相关性比较
Table 3 Correlation between importance value of 8 tree species and GRSP in different soil depths
| GRSP指标 GRSP index | 土层深度 Soil depth (cm) | 分类学种重要值 Importance value of taxonomic species | 共生型种重要值 Importance value of symbiosis type | ||||||||
|---|---|---|---|---|---|---|---|---|---|---|---|
| 黑皮油松 P. tab | 胡桃楸 J. man | 黄檗 P. amu | 落叶松 L. gme | 蒙古栎 Q. mon | 水曲柳 F. man | 榆树 U. pum | 樟子松 P. syl | 外生菌根型 EcM | 丛枝菌根型 AM | ||
| 易提取GRSP EEG | 0-100 | 0.129** | -0.147** | -0.035 | 0.084 | -0.055 | -0.022 | -0.058 | 0.120* | 0.210 | -0.201 |
| 0-20 | 0.178 | -0.235 | 0.000 | 0.017 | -0.118 | 0.032 | 0.004 | 0.198 | 0.131 | -0.103 | |
| 20-40 | 0.026 | -0.159 | 0.027 | -0.002 | -0.035 | -0.060 | -0.098 | 0.246* | 0.096 | -0.125 | |
| 40-60 | -0.007 | -0.169 | 0.045 | 0.126 | 0.018 | 0.027 | -0.105 | 0.167 | 0.133 | -0.090 | |
| 60-80 | 0.342** | -0.100 | -0.186 | 0.256* | -0.076 | -0.171 | -0.051 | -0.025 | 0.183 | -0.215 | |
| 80-100 | 0.228 | -0.188 | -0.164 | 0.225 | -0.071 | 0.023 | -0.207 | 0.077 | 0.231 | -0.214 | |
| 总提取GRSP TG | 0-100 | -0.168** | 0.220** | 0.222** | -0.190** | -0.024 | -0.038 | 0.174** | -0.280** | -0.376** | 0.287** |
| 0-20 | -0.233 | 0.173 | 0.207 | -0.220 | -0.031 | -0.027 | 0.209 | -0.093 | -0.315** | 0.271* | |
| 20-40 | -0.203 | 0.255* | 0.175 | -0.239 | -0.048 | 0.017 | 0.208 | -0.249* | -0.414** | 0.342** | |
| 40-60 | -0.032 | 0.189 | 0.156 | -0.202 | 0.005 | -0.082 | 0.164 | -0.435** | -0.364** | 0.205 | |
| 60-80 | -0.169 | 0.283* | 0.372** | -0.227 | 0.007 | -0.169 | 0.169 | -0.397** | -0.440** | 0.304* | |
| 80-100 | -0.253* | 0.313** | 0.332** | -0.157 | -0.053 | 0.027 | 0.190 | -0.441** | -0.546** | 0.444** | |
| TG中EEG比例 EEG/TG | 0-100 | 0.221** | -0.230** | -0.160** | 0.194** | -0.077 | 0.008 | -0.150** | 0.281** | 0.336** | -0.280** |
| 0-20 | 0.189 | -0.245* | -0.110 | 0.200 | -0.123 | 0.089 | -0.096 | 0.203 | 0.232 | -0.193 | |
| 20-40 | 0.289* | -0.283* | -0.145 | 0.130 | -0.050 | -0.090 | -0.221 | 0.390** | 0.450** | -0.403** | |
| 40-60 | -0.073 | -0.208 | -0.053 | 0.233 | -0.031 | 0.086 | -0.154 | 0.437** | 0.285* | -0.170 | |
| 60-80 | 0.389** | -0.221 | -0.258* | 0.298* | -0.099 | -0.061 | -0.116 | 0.175 | 0.400** | -0.344** | |
| 80-100 | 0.383** | -0.266* | -0.280* | 0.127 | -0.076 | -0.010 | -0.268* | 0.330** | 0.455** | -0.413** | |
| EEG中 C占SOC 比例 EEG-C/ SOC | 0-100 | 0.401** | -0.142** | -0.150** | -0.032 | -0.032 | -0.085 | -0.180** | 0.119* | 0.312** | -0.288** |
| 0-20 | 0.490** | -0.250* | -0.170 | -0.015 | 0.086 | -0.035 | -0.261* | 0.080 | 0.442** | -0.370** | |
| 20-40 | 0.312** | -0.169 | -0.101 | -0.078 | -0.002 | -0.182 | -0.132 | 0.239* | 0.334** | -0.330** | |
| 40-60 | 0.495** | -0.194 | -0.202 | 0.041 | -0.039 | -0.007 | -0.250* | 0.044 | 0.347** | -0.323** | |
| 60-80 | 0.585** | -0.149 | -0.138 | -0.116 | -0.107 | -0.175 | -0.146 | 0.146 | 0.368** | -0.334** | |
| 80-100 | 0.223 | 0.013 | -0.162 | -0.086 | -0.057 | -0.160 | -0.191 | 0.268* | 0.249* | -0.242* | |
| EEG中N 占TN 比例 EEG- N/TN | 0-100 | 0.519** | -0.274** | -0.236** | -0.007 | 0.078 | -0.105 | -0.237** | 0.228** | 0.552** | -0.450** |
| 0-20 | 0.542** | -0.286* | -0.263* | -0.078 | 0.170 | -0.029 | -0.275* | 0.129 | 0.551** | -0.435** | |
| 20-40 | 0.469** | -0.320** | -0.192 | -0.054 | 0.105 | -0.159 | -0.245* | 0.293* | 0.564** | -0.503** | |
| 40-60 | 0.294* | -0.310** | -0.132 | 0.017 | 0.134 | -0.084 | -0.241* | 0.416** | 0.570** | -0.421** | |
| 60-80 | 0.654** | -0.203 | -0.278* | 0.058 | -0.015 | -0.159 | -0.180 | 0.110 | 0.520** | -0.431** | |
| 80-100 | 0.654** | -0.309* | -0.337** | 0.019 | 0.018 | -0.084 | -0.296* | 0.298* | 0.651** | -0.526** | |
| TG中C占SOC比例 TG-C/ SOC | 0-100 | 0.322** | -0.035 | -0.075 | -0.077 | -0.021 | -0.102 | -0.122* | -0.024 | 0.160** | -0.172** |
| 0-20 | 0.388** | -0.127 | -0.078 | -0.110 | 0.258* | -0.122 | -0.318** | -0.056 | 0.383** | -0.329** | |
| 20-40 | 0.151 | -0.067 | -0.010 | -0.125 | 0.014 | -0.145 | -0.002 | 0.043 | 0.097 | -0.146 | |
| 40-60 | 0.554** | -0.147 | -0.170 | -0.026 | -0.037 | -0.044 | -0.214 | -0.075 | 0.290* | -0.288* | |
| 60-80 | 0.439** | -0.053 | -0.066 | -0.122 | -0.066 | -0.159 | -0.107 | -0.016 | 0.195 | -0.212 | |
| 80-100 | 0.022 | 0.242* | -0.015 | -0.121 | -0.048 | -0.167 | -0.091 | 0.006 | -0.059 | 0.011 | |
| TG中N占TN比例 TG-N/ TN | 0-100 | 0.438** | -0.085 | -0.135** | -0.193** | 0.226** | -0.152** | -0.155** | -0.005 | 0.388** | -0.277* |
| 0-20 | 0.326** | 0.006 | -0.134 | -0.230 | 0.351** | -0.109 | -0.183 | -0.091 | 0.349** | -0.197 | |
| 20-40 | 0.327** | -0.189 | -0.148 | -0.202 | 0.245* | -0.211 | -0.057 | 0.018 | 0.348** | -0.352** | |
| 40-60 | 0.588** | -0.158 | -0.153 | -0.205 | 0.208 | -0.205 | -0.228 | 0.015 | 0.494** | -0.399** | |
| 60-80 | 0.542** | -0.020 | -0.127 | -0.190 | 0.178 | -0.185 | -0.221 | -0.004 | 0.433** | -0.278* | |
| 80-100 | 0.493** | -0.120 | -0.133 | -0.152 | 0.137 | -0.097 | -0.097 | 0.066 | 0.427** | -0.240* | |
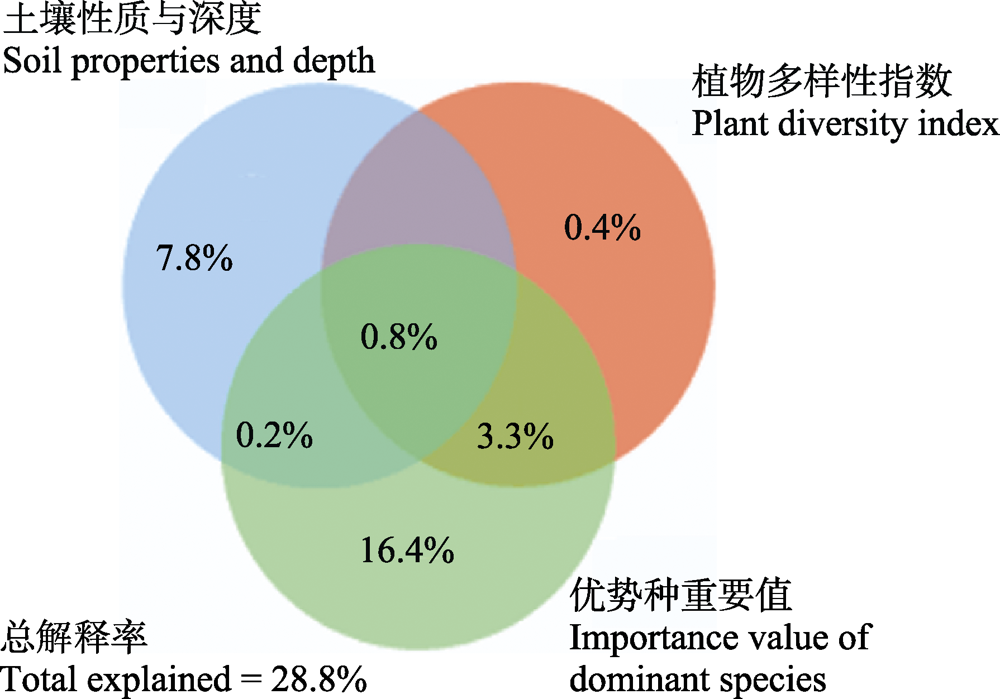
图2 GRSP 指标差异的三组因素方差分解。土壤理化性质和土层深度与植物物种多样性存在-0.1%的解释率。
Fig. 2 Variance partitioning analysis of GRSP in 3 groups of soil properties and depth, dominant species and species diversity. Soil physico-chemical properties, soil depth with plant species diversity have an interpretation rate of - 0.1%.
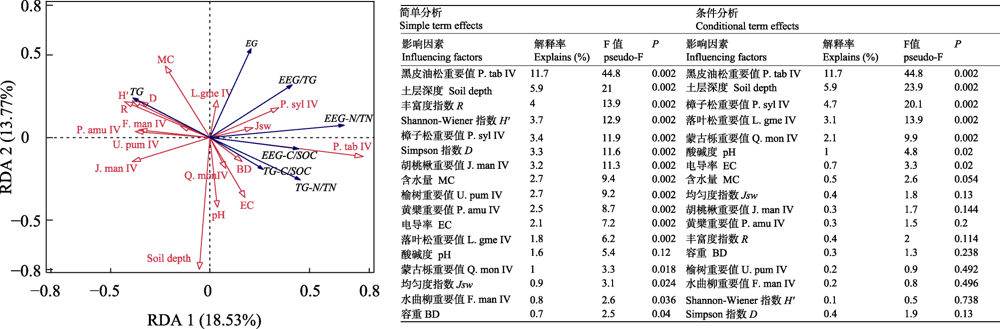
图3 GRSP指标与土壤理化性质、优势种重要值、植物多样性的RDA排序分析(左)及基于简单分析和条件分析的解释因子显著性分析(右)。左图中, 红色空心箭头表示解释变量, 蓝色实心箭头表示被解释变量, 箭头长短及夹角表示相关性大小。IV: 重要值。树种缩写见表3。
Fig. 3 RDA ordination between GRSP parameters and soils, species dominance and species diversity (left), and explaining factor statistical significance under simple term and conditional term effects (right). In the left figure, the red hollow arrow: the explanatory variable, the blue solid arrow: the explained variable, and the length and included angle of the arrow represent the correlation. IV: Importance value; Abbreviations of plant species see Table 3.
| [1] | Bao SD (2000) Soil Agrochemical Analysis, 3rd edn. China Agriculture Press, Beijing. (in Chinese) |
| [ 鲍士旦 (2000) 土壤农化分析 (第三版). 中国农业出版社, 北京.] | |
| [2] |
Barbosa MV, Pedroso DF, Curi N, CarCo MAC (2019) Do different arbuscular mycorrhizal fungi affect the formation and stability of soil aggregates? Ciência e Agrotecnologia, 43, e003519.
DOI URL |
| [3] |
Bueno CG, Davison J, Leon D, Meng YM, Öpik M, Zobel M, Moora M (2021) Towards a consistent benchmark for plant mycorrhizal association databases. New Phytologist. 231, 913-916.
DOI URL |
| [4] | Cao M, Tang ZH, Zhao L, Zhang ZH (2018) Soil pH effect on glomalin-related soil protein in aggregates in sodic-saline soil. Soils, 50, 319-325. (in Chinese with English abstract) |
| [ 曹梦, 唐中华, 赵龙, 张衷华 (2018) 苏打盐碱化土壤pH与团聚体中球囊霉素相关土壤蛋白含量的关系. 土壤, 50, 319-325.] | |
| [5] |
Cissé G, Oort F, Chenu C, Essi M, Staunton S (2020) Is the operationally defined fraction of soil organic matter, “GRSP” (glomalin-related soil protein), stable in soils? Evidence from trends in long-term bare fallow soil. European Journal of Soil Science, 72, 1101-1112.
DOI URL |
| [6] |
Hausmann NT, Hawkes CV (2009) Plant neighborhood control of arbuscular mycorrhizal community composition. New Phytologist, 183, 1188-1200.
DOI PMID |
| [7] |
Holátko J, Brtnický M, Kučerík J, Kotianová M, Elbl J, Kintl A, Kynický J, Benada O, Datta R, Jansa J (2020) Glomalin-Truths, myths, and the future of this elusive soil glycoprotein. Soil Biology and Biochemistry, 153, 108116.
DOI URL |
| [8] |
Huang YY, Chen YX, Castro-Izaguirre N, Baruffol M, Brezzi M, Lang A, Li Y, Härdtle W, Oheimb G, Yang XF, Liu XJ, Pei KQ, Both S, Yang B, Eichenberg D, Assmann T, Bauhus J, Behrens T, Buscot F, Chen XY, Chesters D, Ding BY, Durka W, Erfmeier A, Fang JY, Fischer M, Guo LD, Guo DL, Gutknecht JLM, He JS, He CL, Hector A, Hönig L, Hu RY, Klein AM, Kühn P, Liang Y, Li S, Michalski S, Scherer-Lorenzen M, Schmidt K, Scholten T, Schuldt A, Shi XZ, Tan MZ, Tang ZY, Trogisch S, Wang ZW, Welk E, Wirth C, Wubet T, Xiang WH, Yu MJ, Yu XD, Zhang JY, Zhang SR, Zhang NL, Zhou HZ, Zhu CD, Zhu L, Bruelheide H, Ma KP, Niklaus PA, Schmid B (2018) Impacts of species richness on productivity in a large-scale subtropical forest experiment. Science, 362, 80-83.
DOI |
| [9] | Li YH, Wang HM, Wang WJ, Yang L, Zu YG (2013) Ectomycorrhizal influence on particle size, surface structure, mineral crystallinity, functional groups, and elemental composition of soil colloids from different soil origins. Scientific World Journal, 2013, 698752. |
| [10] | Liu T (2014) Influences of arbuscular mycorrhizal fungi (AMF) inoculation on the poplar growth and drought resistance. PhD dissertation, Northwest A & F University, Yangling, Shaanxi. (in Chinese with English abstract) |
| [ 刘婷 (2014) 丛枝菌根真菌(AMF)调控杨树生长及干旱响应机制的研究. 博士学位论文, 西北农林科技大学, 陕西杨凌] | |
| [11] | Lu JL, Shen G, Wang Q, Ren ML, Pei ZX, Wei CH, Wang WJ (2016) Effect of urban tree species on soil physicochemical properties in Harbin, northeastern China, and afforestation implications. Bulletin of Botanical Research, 36, 549-555. (in Chinese with English abstract) |
| [ 路嘉丽, 沈光, 王琼, 任蔓莉, 裴忠雪, 魏晨辉, 王文杰 (2016) 树种差异对哈尔滨市土壤理化性质影响及造林启示. 植物研究, 36, 549-555.] | |
| [12] | Ma KP, Huang JH, Yu SL, Chen LZ (1995) Plant community diversity in Dongling Mountain, Beijing, China. II. Species richness, evenness and species diversities. Acta Ecologica Sinica, 15, 268-277. (in Chinese with English abstract) |
| [ 马克平, 黄建辉, 于顺利, 陈灵芝 (1995) 北京东灵山地区植物群落多样性的研究. Ⅱ. 丰富度、均匀度和物种多样性指数. 生态学报, 15, 268-277.] | |
| [13] | Quan CX, Ma LL, Lin ZK, Tang XL (2020) Patterns and influence factors of glomalin-related soil protein in Guangdong forests. Ecology and Environmental Sciences, 29, 240-249. (in Chinese with English abstract) |
| [ 权常欣, 马玲玲, 林钊凯, 唐旭利 (2020) 广东省森林球囊霉素相关土壤蛋白含量及影响因素. 生态环境学报, 29, 240-249.] | |
| [14] |
Rillig MC (2004) Arbuscular mycorrhizae, glomalin, and soil aggregation. Canadian Journal of Soil Science, 84, 355-363.
DOI URL |
| [15] | Rillig MC, Ramsey PW, Morris S, Paul EA (2003) Glomalin, an arbuscular-mycorrhizal fungal soil protein, responds to land-use change. Plant & Soil, 253, 293-299. |
| [16] | Schulze ED, Beck E, Buchmann N, Clemens S, Müller- Hohenstein K, Scherer-Lorenzen M (2019) Plant Ecology. Springer, Berlin. |
| [17] | Shi GB, Liu F, Chen D, Deng Y, Lin LX (2021) Species composition and community classification of the 20-ha tropical seasonal rainforest dynamics monitoring plot in the Naban River,Yunnan. Biodiversity Science, 29, 10-20. (in Chinese with English abstract) |
| [ 施国杉, 刘峰, 陈典, 邓云, 林露湘 云南纳板河热带季节雨林20 ha动态监测样地的树种组成与群落分类. 生物多样性, 2021, 29, 10-20.] | |
| [18] | Soudzilovskaia NA, Vaessen S, Barcelo M, He JH, Rahimlou S, Abarenkov K, Brundrett MC, Gomes SIF, Merckx V, Tedersoo L (2020) FungalRoot: Global online database of plant mycorrhizal associations. New Phytologist, 227, 955-966. |
| [19] | Su SF, Lin ZP, Wang XY, Chen ZL, Xue Y (2020) Vegetation survey and species diversity analysis of waste titanium mining area in Wenchang. Chinese Journal of Tropical Agriculture, 40(01), 59-66. (in Chinese with English abstract) |
| [ 宿少锋, 林之盼, 王小燕, 陈珠琳, 薛杨 (2020) 海南文昌废弃钛矿区植被调查与物种多样性分析. 热带农业科学, 40(01), 59-66.] | |
| [20] |
Tang HL, Liu L, Wang L, Ba CJ (2009) Effect of land use type on profile distribution of glomalin. Chinese Journal of Eco-Agriculture, 17, 1137-1142. (in Chinese with English abstract)
DOI URL |
| [ 唐宏亮, 刘龙, 王莉, 巴超杰 (2009) 土地利用方式对球囊霉素土层分布的影响. 中国生态农业学报, 17, 1137-1142.] | |
| [21] |
Wang Q, Wang WJ, He XY, Zhang WT, Song KS, Han SJ (2015) Role and variation of the amount and composition of glomalin in soil properties in farmland and adjacent plantations with reference to a primary forest in North-Eastern China. PLoS ONE, 10, e0139623.
DOI URL |
| [22] |
Wang Q, Wang WJ, He XY, Zhou W, Zhai C, Wang PJ, Tang Z, Wei CH, Zhang B, Xiao L, Wang HY (2019) Urbanization-induced glomalin changes and their associations with land-use configuration, forest characteristics, and soil properties in Changchun, Northeast China. Journal of Soils and Sediments, 19, 2433-2444.
DOI URL |
| [23] |
Wang Q, Wang WJ, Zhong ZL, Wang HM, Fu YJ (2020b) Variation in glomalin in soil profiles and its association with climatic conditions, shelterbelt characteristics, and soil properties in poplar shelterbelts of Northeast China. Journal of Forestry Research, 31, 279-290.
DOI URL |
| [24] | Wang Q, Zhang D, Zhou W, He XY, Wang WJ (2020a) Urbanization led to a decline in glomalin-soil-carbon sequestration and responsible factors examination in Changchun, Northeastern China. Urban Forestry & Urban Greening, 48, 126506. |
| [25] |
Wang WJ, Lu JL, Du HJ, Wei CH, Wang HM, Fu YJ, He XY (2017a) Ranking thirteen tree species based on their impact on soil physiochemical properties, soil fertility, and carbon sequestration in Northeastern China. Forest Ecology and Management, 404, 214-229.
DOI URL |
| [26] |
Wang WJ, Wang Q, Zhou W, Xiao L, Wang HM, He XY (2018) Glomalin changes in urban-rural gradients and their possible associations with forest characteristics and soil properties in Harbin City, Northeastern China. Journal of Environmental Management, 224, 225-234.
DOI URL |
| [27] |
Wang WJ, Zhong ZL, Wang Q, Wang HM, Fu YJ, He XY (2017b) Glomalin contributed more to carbon, nutrients in deeper soils, and differently associated with climates and soil properties in vertical profiles. Scientific Reports, 7, 13003.
DOI URL |
| [28] |
Wang YY, Wen H, Wang K, Sun JX, Yu JH, Wang QG, Wang WJ (2021) Forest plant and macrofungal differences in the Greater and Lesser Khingan Mountains in Northeast China: A regional-historical comparison and its implications. Journal of Forestry Research. Doi: 10.1007/s11676-021-01313-z.
DOI |
| [29] |
Wei CH, Wang Q, Ren ML, Pei ZX, Lu JL, Wang HM, Wang WJ (2020) Soil aggregation accounts for the mineral soil organic carbon and nitrogen accrual in broadleaved forests as compared to that of coniferous forests in Northeast China: Cross-sites and multiple species comparisons. Land Degradation & Development, 32, 296-309.
DOI URL |
| [30] | Wen M, Shi SM, Luo X, He XH, Xu YF, Xu X (2020) Relationships between spatial distribution of arbuscular mycorrhizal colonization, glomalin-related soil protein, and rhizhospheric soil chemical properties under different aged mulberry orchards. Chinese Journal of Applied and Environmental Biology, 26, 1138-1146. (in Chinese with English abstract) |
| [ 温苗, 施松梅, 罗协, 何新华, 徐云飞, 胥晓 (2020) 不同树龄桑园丛枝菌根侵染、球囊霉素土层分布及与土壤因子的关系. 应用与环境生物学报, 26, 1138-1146.] | |
| [31] |
Wright SF, Upadhyaya A (1996) Extraction of an abundant and unusual protein from soil and comparison with hyphal protein of arbuscular mycorrhizal fungi. Soil Science, 161, 575-586.
DOI URL |
| [32] |
Wright SF, Upadhyaya A, Buyer JS (1998) Comparison of N-linked oligosaccharides of glomalin from arbuscular mycorrhizal fungi and soils by capillary electrophoresis. Soil Biology and Biochemistry, 30, 1853-1857.
DOI URL |
| [33] | Xiang KX, Zhang X, Liu JM, Xue JH, Cui YC, Wu YB (2019) The correlation between plant diversity indexes and soil physical and chemical indicators of Cupressus funebris Endl forest of desertification area. Journal of Southern Agriculture, 50, 1771-1778. (in Chinese with English abstract) |
| [ 向凯旋, 张喜, 刘济明, 薛建辉, 崔迎春, 吴永波 (2019) 石漠区柏木林植物多样性指数与土壤理化指标的相关性. 南方农业学报, 50, 1771-1778.] | |
| [34] | Yang MY, Yang N, Liu HJ, Huang W (2020) Effect of different land use type on distribution of glomalin-related soil protein on hilly slope with purple soils in Hengyang of Hunan Province, China. Acta Agrestia Sinica, 28, 1260-1265. (in Chinese with English abstract) |
| [ 杨满元, 杨宁, 刘慧娟, 黄雯 (2020) 衡阳紫色土丘陵坡地不同土地利用方式对球囊霉素相关土壤蛋白分布的影响. 草地学报, 28, 1260-1265.] | |
| [35] |
Zhang J, Tang XL, He XH, Liu JX (2015) Glomalin-related soil protein responses to elevated CO2 and nitrogen addition in a subtropical forest: Potential consequences for soil carbon accumulation. Soil Biology and Biochemistry, 83, 142-149.
DOI URL |
| [36] | Zhang JY, He LR, Li YZ, Qiao LL, Xue S, Liu GB (2019) Distribution characteristics of glomalin-related soil protein in different slope aspects of the Loess Hilly region. Research of Soil and Water Conservation, 26, 65-70, 79. (in Chinese with English abstract) |
| [ 张娇阳, 何俐蓉, 李袁泽, 乔磊磊, 薛萐, 刘国彬 (2019) 黄土丘陵区不同坡向土壤球囊霉素类相关土壤蛋白的分布特征. 水土保持研究, 26, 65-70, 79.] | |
| [37] | Zhang MG, Shi ZY, Yang M, Lu SC, Wang XG, Xu XF (2020) Elevational distribution of glomalin-rated soil proteins in a tropical montane rain forest. Ecology and Environmental Sciences, 29, 457-463. (in Chinese with English abstract) |
| [ 张梦歌, 石兆勇, 杨梅, 卢世川, 王旭刚, 徐晓峰 (2020) 热带山地雨林土壤球囊霉素的分布特征. 生态环境学报, 29, 457-463.] | |
| [38] | Zhong ZL, Wang WJ, Wang Q, Wu Y, Wang HM, Pei ZX, Ren J (2015) Correlation between soil physicochemical properties and fungi-derived glomalin-related soil proteins in agricultural region of Songnen Plain. Chinese Journal of Ecology, 34, 2274-2280. (in Chinese with English abstract) |
| [ 仲召亮, 王文杰, 王琼, 武燕, 王慧梅, 裴忠雪, 任洁 (2015) 松嫩平原农业区土壤理化性质与真菌代谢产物--球囊霉素相关土壤蛋白的关系. 生态学杂志, 34, 2274-2280.] | |
| [39] | Zhong ZL, Wang WJ, Zhang WT, Wang Q (2016) Compositional variation of glomalin-related soil protein in different forest stands and farmland. Journal of Beijing Forestry University, 38, 107-115. (in Chinese with English abstract) |
| [ 仲召亮, 王文杰, 张文天, 王琼 (2016) 不同林分及农田土壤中球囊霉素蛋白组成特征差异研究. 北京林业大学学报, 38, 107-115.] | |
| [40] | Zhu XF, Liu XF, Zhao YG, Liu XC, Gao R, Li WY (2018) Effects of representative artificial vegetation types on glomalin-related soil protein and aggregate stability on loess plateau in western Shanxi Province. Bulletin of Soil and Water Conservation, 38, 80-87. (in Chinese with English abstract) |
| [ 朱兴菲, 刘小芳, 赵勇钢, 刘新春, 高冉, 栗文玉 (2018) 晋西黄土区典型人工植被对土壤球囊霉素和团聚体稳定性的影响. 水土保持通报, 38, 80-87.] | |
| [41] |
Zou YN, Srivastava AK, Wu QS (2016) Glomalin: A potential soil conditioner for perennial fruits. International Journal of Agriculture and Biology, 18, 293-297.
DOI URL |
| [1] | 黄薇, 刘一凡, 方涛, 赵微, 吴婷, 靳瑜, 王荣, 罗芳丽, 郭允倩, 朱耀军. 刈割后互花米草残体与覆膜对滨海湿地土壤理化性质及细菌群落结构的影响[J]. 生物多样性, 2026, 34(5): 25468-. |
| [2] | 梁健超, 陈淑甜, 何文祥, 熊春妮, 许镇洲, 黄源欣, 刘源志弘, 张浪, 胡慧建. 广州市陆生野生脊椎动物资源——编目、分布与保护[J]. 生物多样性, 2026, 34(5): 25422-. |
| [3] | 黄莉, 刘志发, 龚粤宁, 李步杭, 张健. 广东南岭16个1 ha森林动态监测样地植物群落组成与结构[J]. 生物多样性, 2026, 34(3): 25357-. |
| [4] | 夏东坡, 李静, 田军东, 黄中豪, 伍乘风, 陈仕望, 李进华. 中国野生猕猴属动物的研究进展[J]. 生物多样性, 2026, 34(3): 25460-. |
| [5] | 罗熙, 王啟芳, 王建佳, 杨倩曦, 方鸿飞, 洪淼, 张琦, 蔡灵, 周曦杰, 黄丁勇, 郑新庆. 福建东山海域新记录种揭示我国北缘造礁石珊瑚群落多样性[J]. 生物多样性, 2026, 34(2): 25335-. |
| [6] | 周婷婷, 张浩淼, 王浩杰, 廖健, 陈晓丹, 杨楠, 韩博平, 刘振元. 广东省蜻蜓目物种多样性空间格局及关键影响因素[J]. 生物多样性, 2026, 34(2): 25337-. |
| [7] | 刘振元, 周婷婷, 王伟民, 韩博平, 谢志才. 城市化对深圳地区河流大型底栖无脊椎动物群落物种多样性和功能多样性的影响机制[J]. 生物多样性, 2025, 33(9): 25135-. |
| [8] | 冯缨, 宋凤, 金光照, Komiljon Tojibaev, 葛学军. 中亚荒漠区沙拐枣属的分布格局与物种多样性[J]. 生物多样性, 2025, 33(8): 25086-. |
| [9] | 杨洋, 邹睿, 谯娅琴, 孟想, 涂飞云. 海南省陆生哺乳动物物种多样性[J]. 生物多样性, 2025, 33(8): 25044-. |
| [10] | 章洋, 王彦平. SLOSS争论研究进展: 分析方法、理论机制及保护实践[J]. 生物多样性, 2025, 33(7): 25081-. |
| [11] | 潘正东, 林熙戎, 薛华, 胡治颖, 郭弘艺, 张亚, 吴阿娜, 唐文乔. 上海主要内陆水体鱼类物种多样性本底及群落结构[J]. 生物多样性, 2025, 33(6): 24290-. |
| [12] | 彭文, 邓泽帅, 郑文宝, 龚凌轩, 曾玉枫, 孟昊, 陈军, 杨道德. eDNA技术在两栖动物调查中的应用: 以湖南莽山国家级自然保护区为例[J]. 生物多样性, 2025, 33(6): 24552-. |
| [13] | 张璐璐, 任昭杰, 于宁宁, 赵奉熙, 赵遵田. 甘肃省苔藓植物名录[J]. 生物多样性, 2025, 33(6): 24451-. |
| [14] | 吴晓晴, 张美惠, 葛苏婷, 李漫淑, 达良俊, 宋坤, 沈国春, 张健. 上海近自然林重建过程中木本植物物种多样性与地上生物量的时空动态: 以闵行区生态岛为例[J]. 生物多样性, 2025, 33(5): 24444-. |
| [15] | 张晶晶, 黄文彬, 陈奕廷, 杨泽鹏, 柯伟业, 彭昭杰, 魏世超, 张志伟, 胡怡思, 余文华, 周文良. 广东南澎列岛海洋生态国家级自然保护区造礁石珊瑚多样性及分布特征[J]. 生物多样性, 2025, 33(4): 24424-. |
| 阅读次数 | ||||||
|
全文 |
|
|||||
|
摘要 |
|
|||||
备案号:京ICP备16067583号-7
Copyright © 2026 版权所有 《生物多样性》编辑部
地址: 北京香山南辛村20号, 邮编:100093
电话: 010-62836137, 62836665 E-mail: biodiversity@ibcas.ac.cn
![]()