
Biodiv Sci ›› 2026, Vol. 34 ›› Issue (4): 25330. DOI: 10.17520/biods.2025330 cstr: 32101.14.biods.2025330
• Original Paper: Biosafety and Nature Conservation • Previous Articles Next Articles
Boyao Li1( ), Tiancheng Sheng2(), Xiaoyun Xing2,*()(
 )
)
Received:2025-08-18
Accepted:2026-03-17
Online:2026-04-20
Published:2026-05-27
Contact:
*E-mail: xyxing@bjfu.edu.cn
Supported by:Boyao Li, Tiancheng Sheng, Xiaoyun Xing. Impact of biodiversity risk on corporate financial performance: Evidence from listed companies in China[J]. Biodiv Sci, 2026, 34(4): 25330.
| 变量类型 | 变量名称 | 英文全称 | 变量符号 | 变量度量 |
| 被解释变量 | 资产回报率 | Return on assets | ROA | 净利润/总资产 |
| 解释变量 | 生物多样性风险暴露指数 | Biodiversity Exposure Index | BE | 由关键词词频赋值 |
| 生物多样性关注指数 | Biodiversity Concern Index | BC | 关键词词频占比 | |
| 控制变量 | 企业规模 | Firm size | Size | 总资产取对数 |
| 资产负债率 | Leverage ratio | Lev | 总负债/总资产 | |
| 营收增长率 | Revenue growth rate | Growth | 本年营业收入总额/上一年营业收入总额 |
| 变量 Variables | 观测值 Observations | 平均值 Mean | 标准差 Standard deviation | 最小值 Minimum | 最大值 Maximum |
|---|---|---|---|---|---|
| ROA | 40,932 | 0.041 | 0.061 | -0.223 | 0.208 |
| BE | 40,932 | 0.436 | 0.496 | 0.000 | 1.000 |
| BC | 40,932 | 0.000 | 0.000 | 0.000 | 0.010 |
| Size | 40,931 | 22.115 | 1.333 | 14.158 | 28.636 |
| Lev | 40,932 | 0.417 | 0.205 | 0.051 | 0.888 |
| Growth | 40,901 | 0.171 | 0.372 | -0.527 | 2.213 |
Table 1 Descriptive statistics of the main financial and biodiversity risk-related variables
| 变量 Variables | 观测值 Observations | 平均值 Mean | 标准差 Standard deviation | 最小值 Minimum | 最大值 Maximum |
|---|---|---|---|---|---|
| ROA | 40,932 | 0.041 | 0.061 | -0.223 | 0.208 |
| BE | 40,932 | 0.436 | 0.496 | 0.000 | 1.000 |
| BC | 40,932 | 0.000 | 0.000 | 0.000 | 0.010 |
| Size | 40,931 | 22.115 | 1.333 | 14.158 | 28.636 |
| Lev | 40,932 | 0.417 | 0.205 | 0.051 | 0.888 |
| Growth | 40,901 | 0.171 | 0.372 | -0.527 | 2.213 |
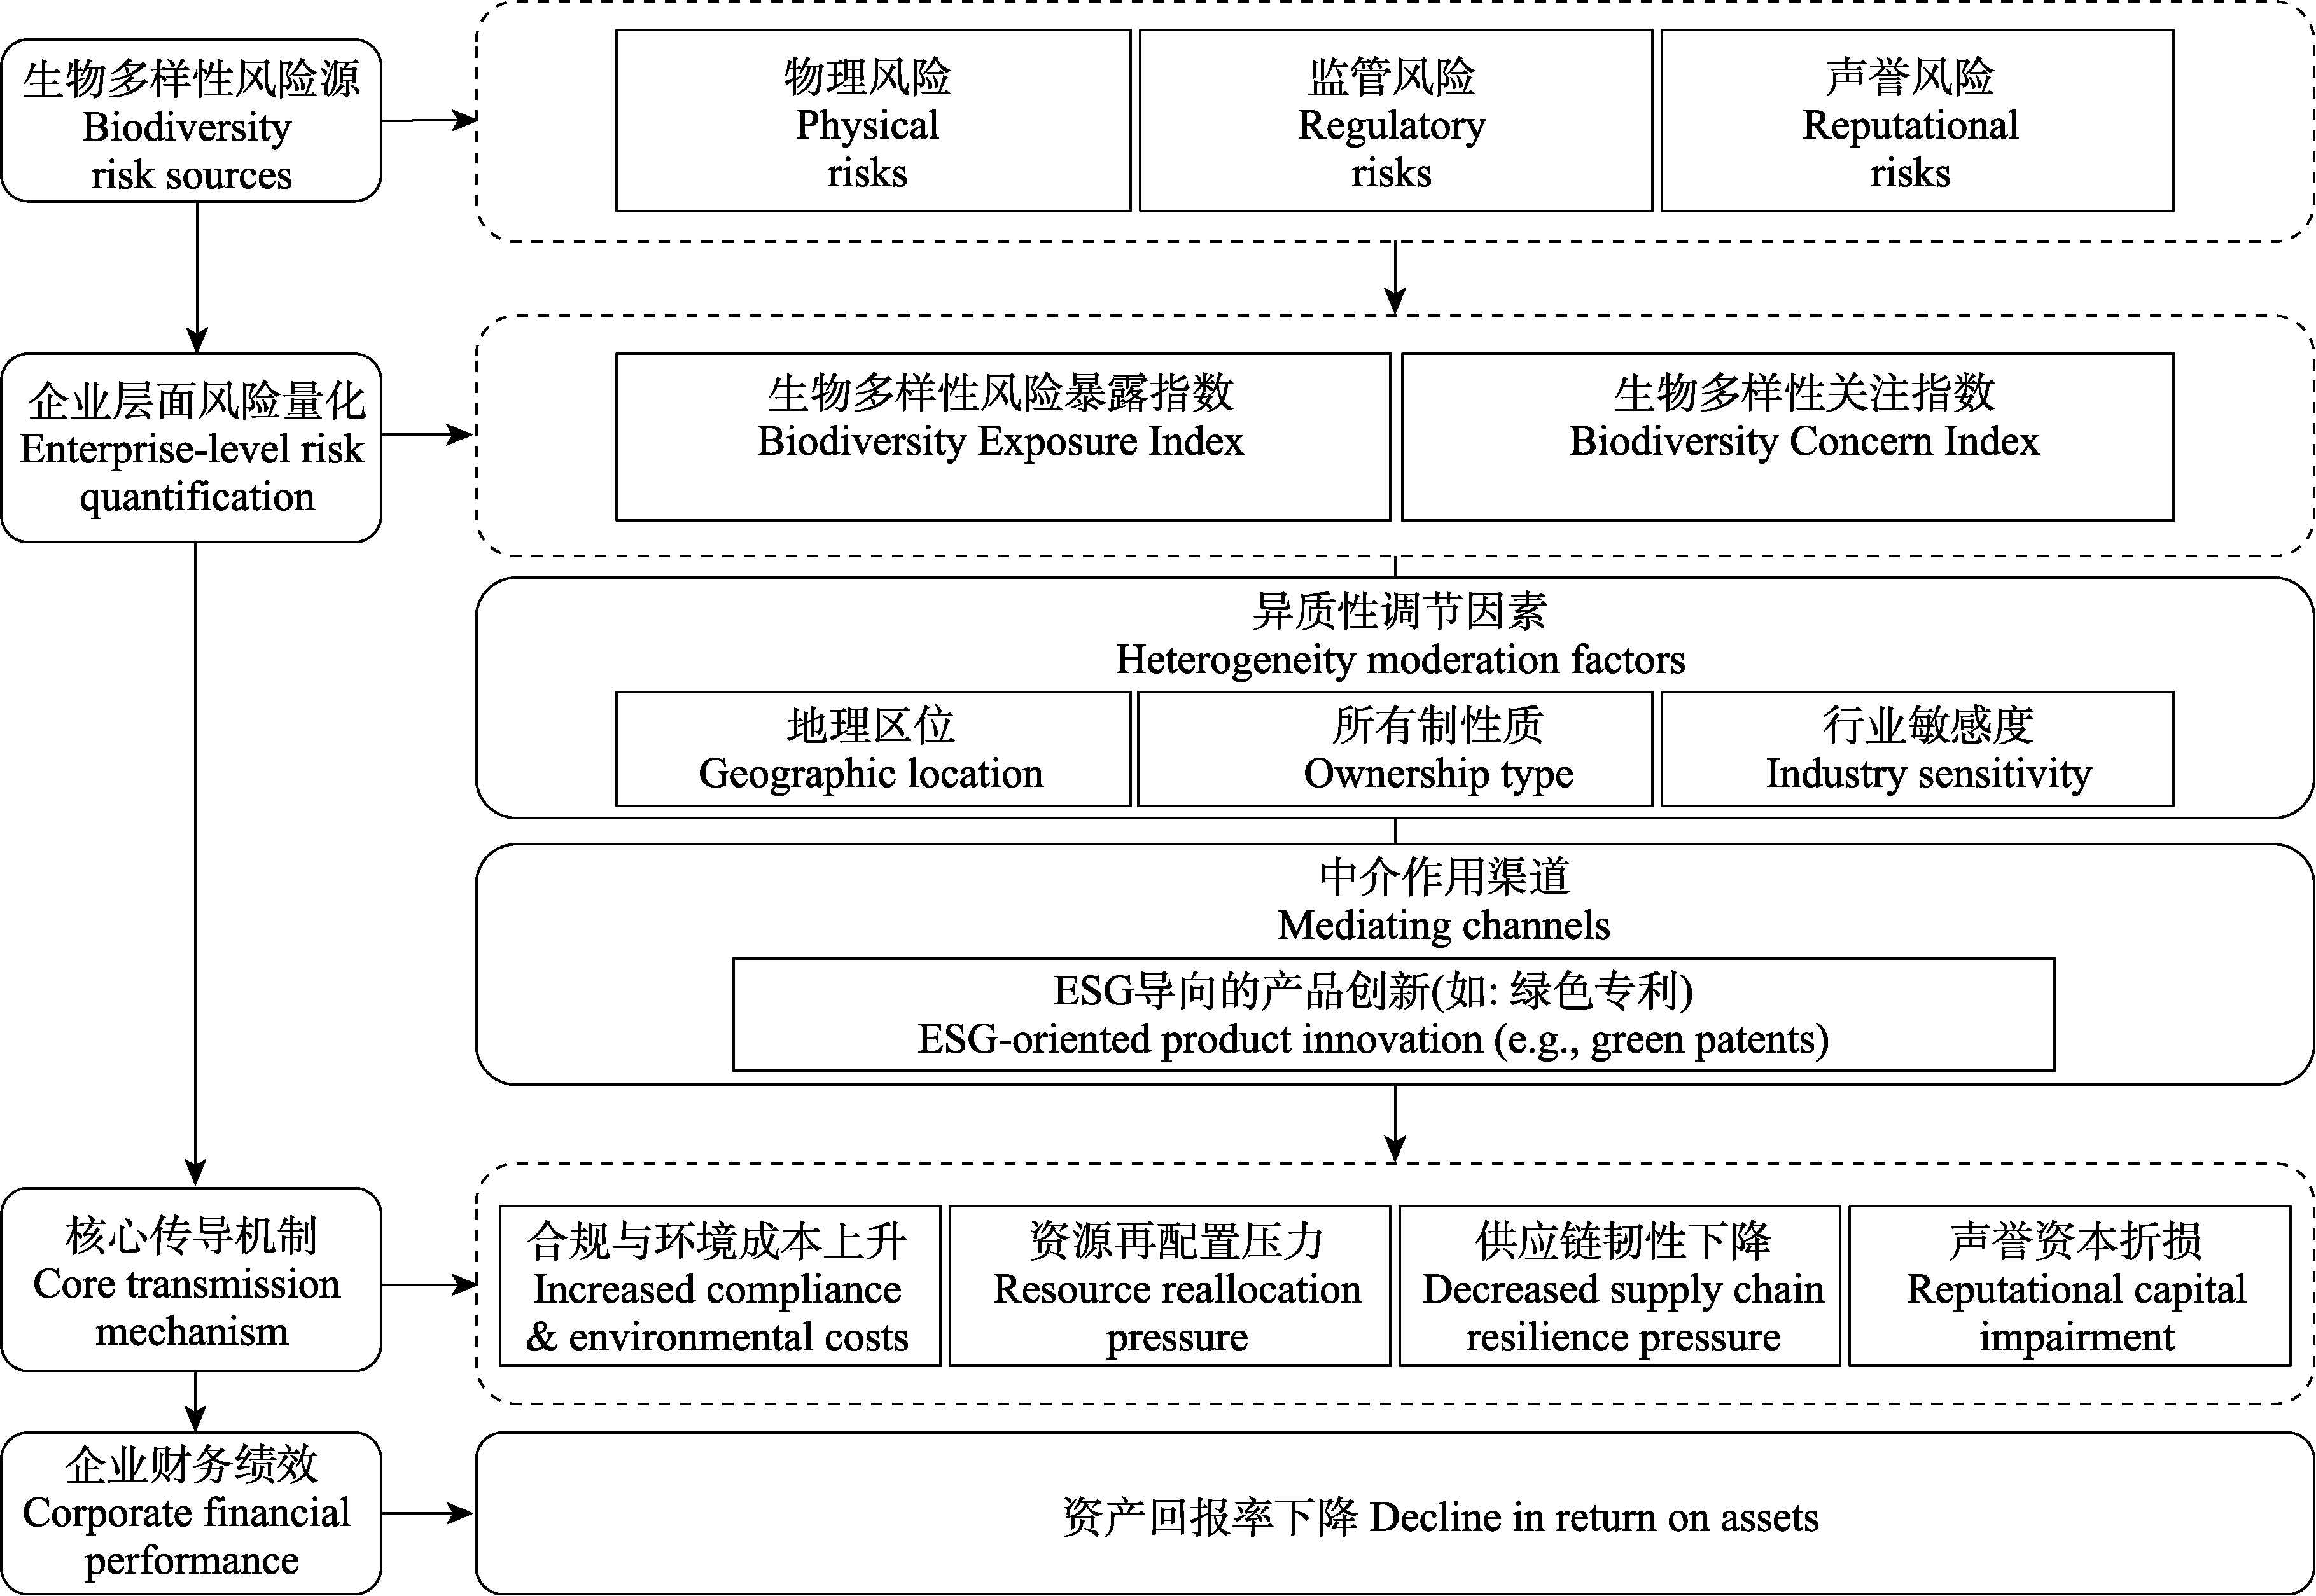
Fig. 1 Conceptual framework of the relationship between biodiversity risk and corporate financial performance. ESG, Environmental, social and governance.
| 变量 Variables | BE模型 BE model | BC模型 BC model |
|---|---|---|
| 被解释变量 DV | ROA | ROA |
| BE | -0.002345*** | |
| (0.000605) | ||
| BC | -2.018842*** | |
| (0.656294) | ||
| Size | 0.009733*** | 0.009573*** |
| (0.000279) | (0.000274) | |
| Lev | -0.147774*** | -0.147735*** |
| (0.001890) | (0.001890) | |
| Growth | 0.040498*** | 0.040458*** |
| (0.001009) | (0.001009) | |
| 常数项 Constant | -0.118338*** | -0.115637*** |
| (0.005741) | (0.005676) | |
| 固定效应 Fixed effects | 是 Yes | 是 Yes |
| 观测值 Observations | 40,900 | 40,900 |
| 调整后R2 Adjusted R2 | 0.252565 | 0.252408 |
Table 2 Benchmark regression results of the impact of biodiversity risk on corporate financial performance
| 变量 Variables | BE模型 BE model | BC模型 BC model |
|---|---|---|
| 被解释变量 DV | ROA | ROA |
| BE | -0.002345*** | |
| (0.000605) | ||
| BC | -2.018842*** | |
| (0.656294) | ||
| Size | 0.009733*** | 0.009573*** |
| (0.000279) | (0.000274) | |
| Lev | -0.147774*** | -0.147735*** |
| (0.001890) | (0.001890) | |
| Growth | 0.040498*** | 0.040458*** |
| (0.001009) | (0.001009) | |
| 常数项 Constant | -0.118338*** | -0.115637*** |
| (0.005741) | (0.005676) | |
| 固定效应 Fixed effects | 是 Yes | 是 Yes |
| 观测值 Observations | 40,900 | 40,900 |
| 调整后R2 Adjusted R2 | 0.252565 | 0.252408 |
| 变量 Variables | L.BE模型 L.BE model | L.BC模型 L.BC model |
|---|---|---|
| 被解释变量 DV | ROA | ROA |
| L.BE | -0.003159*** | |
| (0.000642) | ||
| L.BC | -2.809240*** | |
| (0.736606) | ||
| 常数项 Constant | -0.172160*** | -0.168500*** |
| (0.005774) | (0.005709) | |
| 控制变量 Control variables | 是 Yes | 是 Yes |
| 固定效应 Fixed effects | 是 Yes | 是 Yes |
| 观测值 Observations | 35,893 | 35,893 |
| 调整后R2 Adjusted R2 | 0.263539 | 0.263256 |
Table 3 Regression results of the lag effect model for the impact of biodiversity risk on corporate financial performance
| 变量 Variables | L.BE模型 L.BE model | L.BC模型 L.BC model |
|---|---|---|
| 被解释变量 DV | ROA | ROA |
| L.BE | -0.003159*** | |
| (0.000642) | ||
| L.BC | -2.809240*** | |
| (0.736606) | ||
| 常数项 Constant | -0.172160*** | -0.168500*** |
| (0.005774) | (0.005709) | |
| 控制变量 Control variables | 是 Yes | 是 Yes |
| 固定效应 Fixed effects | 是 Yes | 是 Yes |
| 观测值 Observations | 35,893 | 35,893 |
| 调整后R2 Adjusted R2 | 0.263539 | 0.263256 |
| 变量 Variables | BE模型 BE model | BC模型 BC model | ||
|---|---|---|---|---|
| 第一阶段 First stage | 第二阶段 Second stage | 第一阶段 First stage | 第二阶段 Second stage | |
| 被解释变量 DV | BE | ROA | BC1e6 | ROA |
| IV_BE | 0.674891*** | |||
| (0.059) | ||||
| BE | -0.031078*** | |||
| (0.010) | ||||
| IV_BC1e6 | 0.231670*** | |||
| (0.053) | ||||
| BC1e6 | -0.000058* | |||
| (0.000) | ||||
| Size | 0.081096 | 0.013647 | 11.520616*** | 0.011495*** |
| (0.003) | (0.000905) | (0.907) | (0.000) | |
| Lev | -0.036283 | -0.158496 | -5.530266 | -0.155529*** |
| (0.016) | (0.002) | (5.902) | (0.002) | |
| Growth | -0.005389 | 0.048850 | -8.561463*** | 0.053751*** |
| (0.008) | (0.001) | (3.108) | (0.001) | |
| 常数项 Constant | -1.578773*** | -0.173306*** | 9.835776 | -0.124574*** |
| (0.071) | (0.015) | (25.193) | (0.008) | |
| F统计量 Cragg-Donald Wald F | 128.92 | 107.557 | ||
| Anderson-Rubin 95%置信区间 Anderson-Rubin 95% confidence interval | [-0.051566, -0.010590] | [-.0001114, -4.49e-06] | ||
| 观测值 Observations | 26,209 | 26,209 | 26,209 | 26,209 |
| R2 | 0.262 | 0.239 | 0.158 | 0.277 |
| 调整后R2 Adjusted R2 | 0.261 | 0.157 | ||
Table 4 Regression results using the industry peer instrumental variable method
| 变量 Variables | BE模型 BE model | BC模型 BC model | ||
|---|---|---|---|---|
| 第一阶段 First stage | 第二阶段 Second stage | 第一阶段 First stage | 第二阶段 Second stage | |
| 被解释变量 DV | BE | ROA | BC1e6 | ROA |
| IV_BE | 0.674891*** | |||
| (0.059) | ||||
| BE | -0.031078*** | |||
| (0.010) | ||||
| IV_BC1e6 | 0.231670*** | |||
| (0.053) | ||||
| BC1e6 | -0.000058* | |||
| (0.000) | ||||
| Size | 0.081096 | 0.013647 | 11.520616*** | 0.011495*** |
| (0.003) | (0.000905) | (0.907) | (0.000) | |
| Lev | -0.036283 | -0.158496 | -5.530266 | -0.155529*** |
| (0.016) | (0.002) | (5.902) | (0.002) | |
| Growth | -0.005389 | 0.048850 | -8.561463*** | 0.053751*** |
| (0.008) | (0.001) | (3.108) | (0.001) | |
| 常数项 Constant | -1.578773*** | -0.173306*** | 9.835776 | -0.124574*** |
| (0.071) | (0.015) | (25.193) | (0.008) | |
| F统计量 Cragg-Donald Wald F | 128.92 | 107.557 | ||
| Anderson-Rubin 95%置信区间 Anderson-Rubin 95% confidence interval | [-0.051566, -0.010590] | [-.0001114, -4.49e-06] | ||
| 观测值 Observations | 26,209 | 26,209 | 26,209 | 26,209 |
| R2 | 0.262 | 0.239 | 0.158 | 0.277 |
| 调整后R2 Adjusted R2 | 0.261 | 0.157 | ||
| 变量 Variables | BE模型 BE model | BC模型 BC model | 多期滞后模型 Multi-period lag model |
|---|---|---|---|
| 被解释变量 DV | ROE | ROE | ROA |
| BE | -0.003389** | ||
| (0.001347) | |||
| BC | -6.314404*** | ||
| (1.884943) | |||
| L.BE | -0.001457 | ||
| (0.001270) | |||
| L2.BE | -0.001346 | ||
| (0.001397) | |||
| L3.BE | -0.002074 | ||
| (0.001312) | |||
| L.BC | 5.742202* | ||
| (3.108998) | |||
| L2.BC | -1.060511 | ||
| (4.739165) | |||
| L3.BC | -6.349210* | ||
| (3.827503) | |||
| 常数项 Constant | -0.374697*** | -0.371332*** | -0.225105*** |
| (0.014080) | (0.013942) | (0.009404) | |
| 固定效应 Fixed effects | 是 Yes | 是 Yes | 是 Yes |
| 观测值 Observations | 40,835 | 40,835 | 13,697 |
| 调整后R2 Adjusted R2 | 0.162266 | 0.162400 | 0.2869 |
Table 5 Robustness test and multi-period lag model regression results
| 变量 Variables | BE模型 BE model | BC模型 BC model | 多期滞后模型 Multi-period lag model |
|---|---|---|---|
| 被解释变量 DV | ROE | ROE | ROA |
| BE | -0.003389** | ||
| (0.001347) | |||
| BC | -6.314404*** | ||
| (1.884943) | |||
| L.BE | -0.001457 | ||
| (0.001270) | |||
| L2.BE | -0.001346 | ||
| (0.001397) | |||
| L3.BE | -0.002074 | ||
| (0.001312) | |||
| L.BC | 5.742202* | ||
| (3.108998) | |||
| L2.BC | -1.060511 | ||
| (4.739165) | |||
| L3.BC | -6.349210* | ||
| (3.827503) | |||
| 常数项 Constant | -0.374697*** | -0.371332*** | -0.225105*** |
| (0.014080) | (0.013942) | (0.009404) | |
| 固定效应 Fixed effects | 是 Yes | 是 Yes | 是 Yes |
| 观测值 Observations | 40,835 | 40,835 | 13,697 |
| 调整后R2 Adjusted R2 | 0.162266 | 0.162400 | 0.2869 |
| 变量 Variables | BE模型 BE model | BC模型 BC model | ||||
|---|---|---|---|---|---|---|
| 西部地区 Western region | 东部地区 Eastern region | 中部地区 Central region | 西部地区 Western region | 东部地区 Eastern region | 中部地区 Central region | |
| 被解释变量 DV | ROA | ROA | ROA | ROA | ROA | ROA |
| BE | 0.001751 | -0.003500*** | 0.000243 | |||
| (0.001812) | (0.000726) | (0.001569) | ||||
| BC | -0.456884 | -1.875953** | -6.000618*** | |||
| (1.710981) | (0.763839) | (2.211839) | ||||
| 常数项 Constant | -0.187840*** | -0.108552*** | -0.183010*** | -0.189985*** | -0.104058*** | -0.183394*** |
| (0.016963) | (0.006692) | (0.015754) | (0.016909) | (0.006603) | (0.015674) | |
| 固定效应 Fixed effects | 是 Yes | 是 Yes | 是 Yes | 是 Yes | 是 Yes | 是 Yes |
| 观测值 Observations | 4,965 | 27,735 | 6,193 | 4,965 | 27,735 | 6,193 |
| 调整后R2 Adjusted R2 | 0.304304 | 0.244027 | 0.288845 | 0.304172 | 0.243508 | 0.289331 |
Table 6 Heterogeneity analysis of different geographical regions
| 变量 Variables | BE模型 BE model | BC模型 BC model | ||||
|---|---|---|---|---|---|---|
| 西部地区 Western region | 东部地区 Eastern region | 中部地区 Central region | 西部地区 Western region | 东部地区 Eastern region | 中部地区 Central region | |
| 被解释变量 DV | ROA | ROA | ROA | ROA | ROA | ROA |
| BE | 0.001751 | -0.003500*** | 0.000243 | |||
| (0.001812) | (0.000726) | (0.001569) | ||||
| BC | -0.456884 | -1.875953** | -6.000618*** | |||
| (1.710981) | (0.763839) | (2.211839) | ||||
| 常数项 Constant | -0.187840*** | -0.108552*** | -0.183010*** | -0.189985*** | -0.104058*** | -0.183394*** |
| (0.016963) | (0.006692) | (0.015754) | (0.016909) | (0.006603) | (0.015674) | |
| 固定效应 Fixed effects | 是 Yes | 是 Yes | 是 Yes | 是 Yes | 是 Yes | 是 Yes |
| 观测值 Observations | 4,965 | 27,735 | 6,193 | 4,965 | 27,735 | 6,193 |
| 调整后R2 Adjusted R2 | 0.304304 | 0.244027 | 0.288845 | 0.304172 | 0.243508 | 0.289331 |
| 变量 Variables | BE模型 BE model | BC模型 BC model | ||
|---|---|---|---|---|
| 国有企业 State-owned corporate | 非国有企业 Non-state-owned corporate | 国有企业 State-owned corporate | 非国有企业 Non-state-owned corporate | |
| 被解释变量 DV | ROA | ROA | ROA | ROA |
| BE | 0.000579 | -0.003282*** | ||
| (0.000929) | (0.000810) | |||
| BC | -0.645367 | -2.461043*** | ||
| (1.208398) | (0.791905) | |||
| 常数项 Constant | -0.138379*** | -0.145665*** | -0.139078*** | -0.141431*** |
| (0.007746) | (0.009137) | (0.007694) | (0.009026) | |
| 固定效应 Fixed effects | 是 Yes | 是 Yes | 是 Yes | 是 Yes |
| 观测值 Observations | 14,268 | 24,075 | 14,268 | 24,075 |
| 调整后R2 Adjusted R2 | 0.280578 | 0.242326 | 0.280571 | 0.241996 |
Table 7 Heterogeneity analysis by ownership type
| 变量 Variables | BE模型 BE model | BC模型 BC model | ||
|---|---|---|---|---|
| 国有企业 State-owned corporate | 非国有企业 Non-state-owned corporate | 国有企业 State-owned corporate | 非国有企业 Non-state-owned corporate | |
| 被解释变量 DV | ROA | ROA | ROA | ROA |
| BE | 0.000579 | -0.003282*** | ||
| (0.000929) | (0.000810) | |||
| BC | -0.645367 | -2.461043*** | ||
| (1.208398) | (0.791905) | |||
| 常数项 Constant | -0.138379*** | -0.145665*** | -0.139078*** | -0.141431*** |
| (0.007746) | (0.009137) | (0.007694) | (0.009026) | |
| 固定效应 Fixed effects | 是 Yes | 是 Yes | 是 Yes | 是 Yes |
| 观测值 Observations | 14,268 | 24,075 | 14,268 | 24,075 |
| 调整后R2 Adjusted R2 | 0.280578 | 0.242326 | 0.280571 | 0.241996 |
| 变量 Variables | BE模型 BE model | BC模型 BC model | ||||
|---|---|---|---|---|---|---|
| 高敏感度行业 High-sensitivity industry | 中敏感度行业 Medium-sensitivity industry | 低敏感度行业 Low-sensitivity industry | 高敏感度行业 High-sensitivity industry | 中敏感度行业 Medium-sensitivity industry | 低敏感度行业 Low-sensitivity industry | |
| 被解释变量 DV | ROA | ROA | ROA | ROA | ROA | ROA |
| BE | 0.0070411* | 0.0035652*** | -0.001037 | |||
| (0.0029809) | (0.0007842) | (0.0027549) | ||||
| BC | -2.773192* | 1.617218* | -12.92617 | |||
| (1.329168) | (0.6517192) | (13.16067) | ||||
| 常数项 Constant | 0.0594131*** | 0.0855468*** | 0.0660308*** | 0.0656899*** | 0.0866187*** | 0.0664181*** |
| (0.0052501) | (0.0008765) | (0.0024934) | (0.0048338) | (0.0008458) | (0.002416) | |
| 固定效应 Fixed effects | 是 Yes | 是 Yes | 是 Yes | 是 Yes | 是 Yes | 是 Yes |
| 观测值 Observations | 1,409 | 21,856 | 2,538 | 1,409 | 21,856 | 2,538 |
| R2 | 0.2298 | 0.2526 | 0.2065 | 0.2287 | 0.2520 | 0.2069 |
| 调整后R2 Adjusted R2 | 0.2187 | 0.2519 | 0.1996 | 0.2176 | 0.2512 | 0.2000 |
Table 8 Regression results of Biodiversity Exposure Index (BE) and Biodiversity Concern Index (BC) with industry sensitivity
| 变量 Variables | BE模型 BE model | BC模型 BC model | ||||
|---|---|---|---|---|---|---|
| 高敏感度行业 High-sensitivity industry | 中敏感度行业 Medium-sensitivity industry | 低敏感度行业 Low-sensitivity industry | 高敏感度行业 High-sensitivity industry | 中敏感度行业 Medium-sensitivity industry | 低敏感度行业 Low-sensitivity industry | |
| 被解释变量 DV | ROA | ROA | ROA | ROA | ROA | ROA |
| BE | 0.0070411* | 0.0035652*** | -0.001037 | |||
| (0.0029809) | (0.0007842) | (0.0027549) | ||||
| BC | -2.773192* | 1.617218* | -12.92617 | |||
| (1.329168) | (0.6517192) | (13.16067) | ||||
| 常数项 Constant | 0.0594131*** | 0.0855468*** | 0.0660308*** | 0.0656899*** | 0.0866187*** | 0.0664181*** |
| (0.0052501) | (0.0008765) | (0.0024934) | (0.0048338) | (0.0008458) | (0.002416) | |
| 固定效应 Fixed effects | 是 Yes | 是 Yes | 是 Yes | 是 Yes | 是 Yes | 是 Yes |
| 观测值 Observations | 1,409 | 21,856 | 2,538 | 1,409 | 21,856 | 2,538 |
| R2 | 0.2298 | 0.2526 | 0.2065 | 0.2287 | 0.2520 | 0.2069 |
| 调整后R2 Adjusted R2 | 0.2187 | 0.2519 | 0.1996 | 0.2176 | 0.2512 | 0.2000 |
| 效应路径 Effect path | BE模型 BE model | BC模型 BC model | ||||||
|---|---|---|---|---|---|---|---|---|
| 系数 Coefficient | 标准误 SE | 95%置信区 间下限 95% CIL | 95%置信区 间上限 95% CIU | 系数 Coefficient | 标准误 SE | 95%置信区 间下限 95% CIL | 95%置信区 间上限 95% CIU | |
| 间接效应 Indirect effects | -2.71×10⁻⁵ | 1.18×10⁻⁵ | -5.21×10⁻⁵ | -5.57×10⁻⁶ | -7.21×10⁻² | 2.83×10⁻² | -1.43×10⁻¹ | -2.72×10⁻² |
| 直接效应 Direct effects | -2.02×10⁻³ | 6.02×10⁻⁴ | -3.23×10⁻³ | -9.11×10⁻⁴ | -1.78 | 6.60×10⁻¹ | -3.15 | -5.02×10⁻¹ |
| 自变项→中介项 Independent variable → mediator | 4.19×10⁻² | 1.71×10⁻² | 7.22×10⁻³ | 7.47×10⁻² | 1.12×10² | 3.89×101 | 4.29×101 | 1.96×10² |
| 中介项→因变项 Mediator→dependent variable | -6.48×10⁻⁴ | 1.22×10⁻⁴ | -8.96×10⁻⁴ | -4.16×10⁻⁴ | -6.46×10⁻⁴ | 1.22×10⁻⁴ | -8.98×10⁻⁴ | -4.15×10⁻⁴ |
| 总效应 Total effects | -2.35×10⁻³ | 6.02×10⁻⁴ | -3.57×10⁻³ | -1.25×10⁻³ | -2.02 | 6.69×10⁻¹ | -3.46 | -7.38×10⁻¹ |
Table 9 Bootstrap test results of the mediation effects of biodiversity risk exposure and biodiversity concern on financial performance respectively through green innovation
| 效应路径 Effect path | BE模型 BE model | BC模型 BC model | ||||||
|---|---|---|---|---|---|---|---|---|
| 系数 Coefficient | 标准误 SE | 95%置信区 间下限 95% CIL | 95%置信区 间上限 95% CIU | 系数 Coefficient | 标准误 SE | 95%置信区 间下限 95% CIL | 95%置信区 间上限 95% CIU | |
| 间接效应 Indirect effects | -2.71×10⁻⁵ | 1.18×10⁻⁵ | -5.21×10⁻⁵ | -5.57×10⁻⁶ | -7.21×10⁻² | 2.83×10⁻² | -1.43×10⁻¹ | -2.72×10⁻² |
| 直接效应 Direct effects | -2.02×10⁻³ | 6.02×10⁻⁴ | -3.23×10⁻³ | -9.11×10⁻⁴ | -1.78 | 6.60×10⁻¹ | -3.15 | -5.02×10⁻¹ |
| 自变项→中介项 Independent variable → mediator | 4.19×10⁻² | 1.71×10⁻² | 7.22×10⁻³ | 7.47×10⁻² | 1.12×10² | 3.89×101 | 4.29×101 | 1.96×10² |
| 中介项→因变项 Mediator→dependent variable | -6.48×10⁻⁴ | 1.22×10⁻⁴ | -8.96×10⁻⁴ | -4.16×10⁻⁴ | -6.46×10⁻⁴ | 1.22×10⁻⁴ | -8.98×10⁻⁴ | -4.15×10⁻⁴ |
| 总效应 Total effects | -2.35×10⁻³ | 6.02×10⁻⁴ | -3.57×10⁻³ | -1.25×10⁻³ | -2.02 | 6.69×10⁻¹ | -3.46 | -7.38×10⁻¹ |
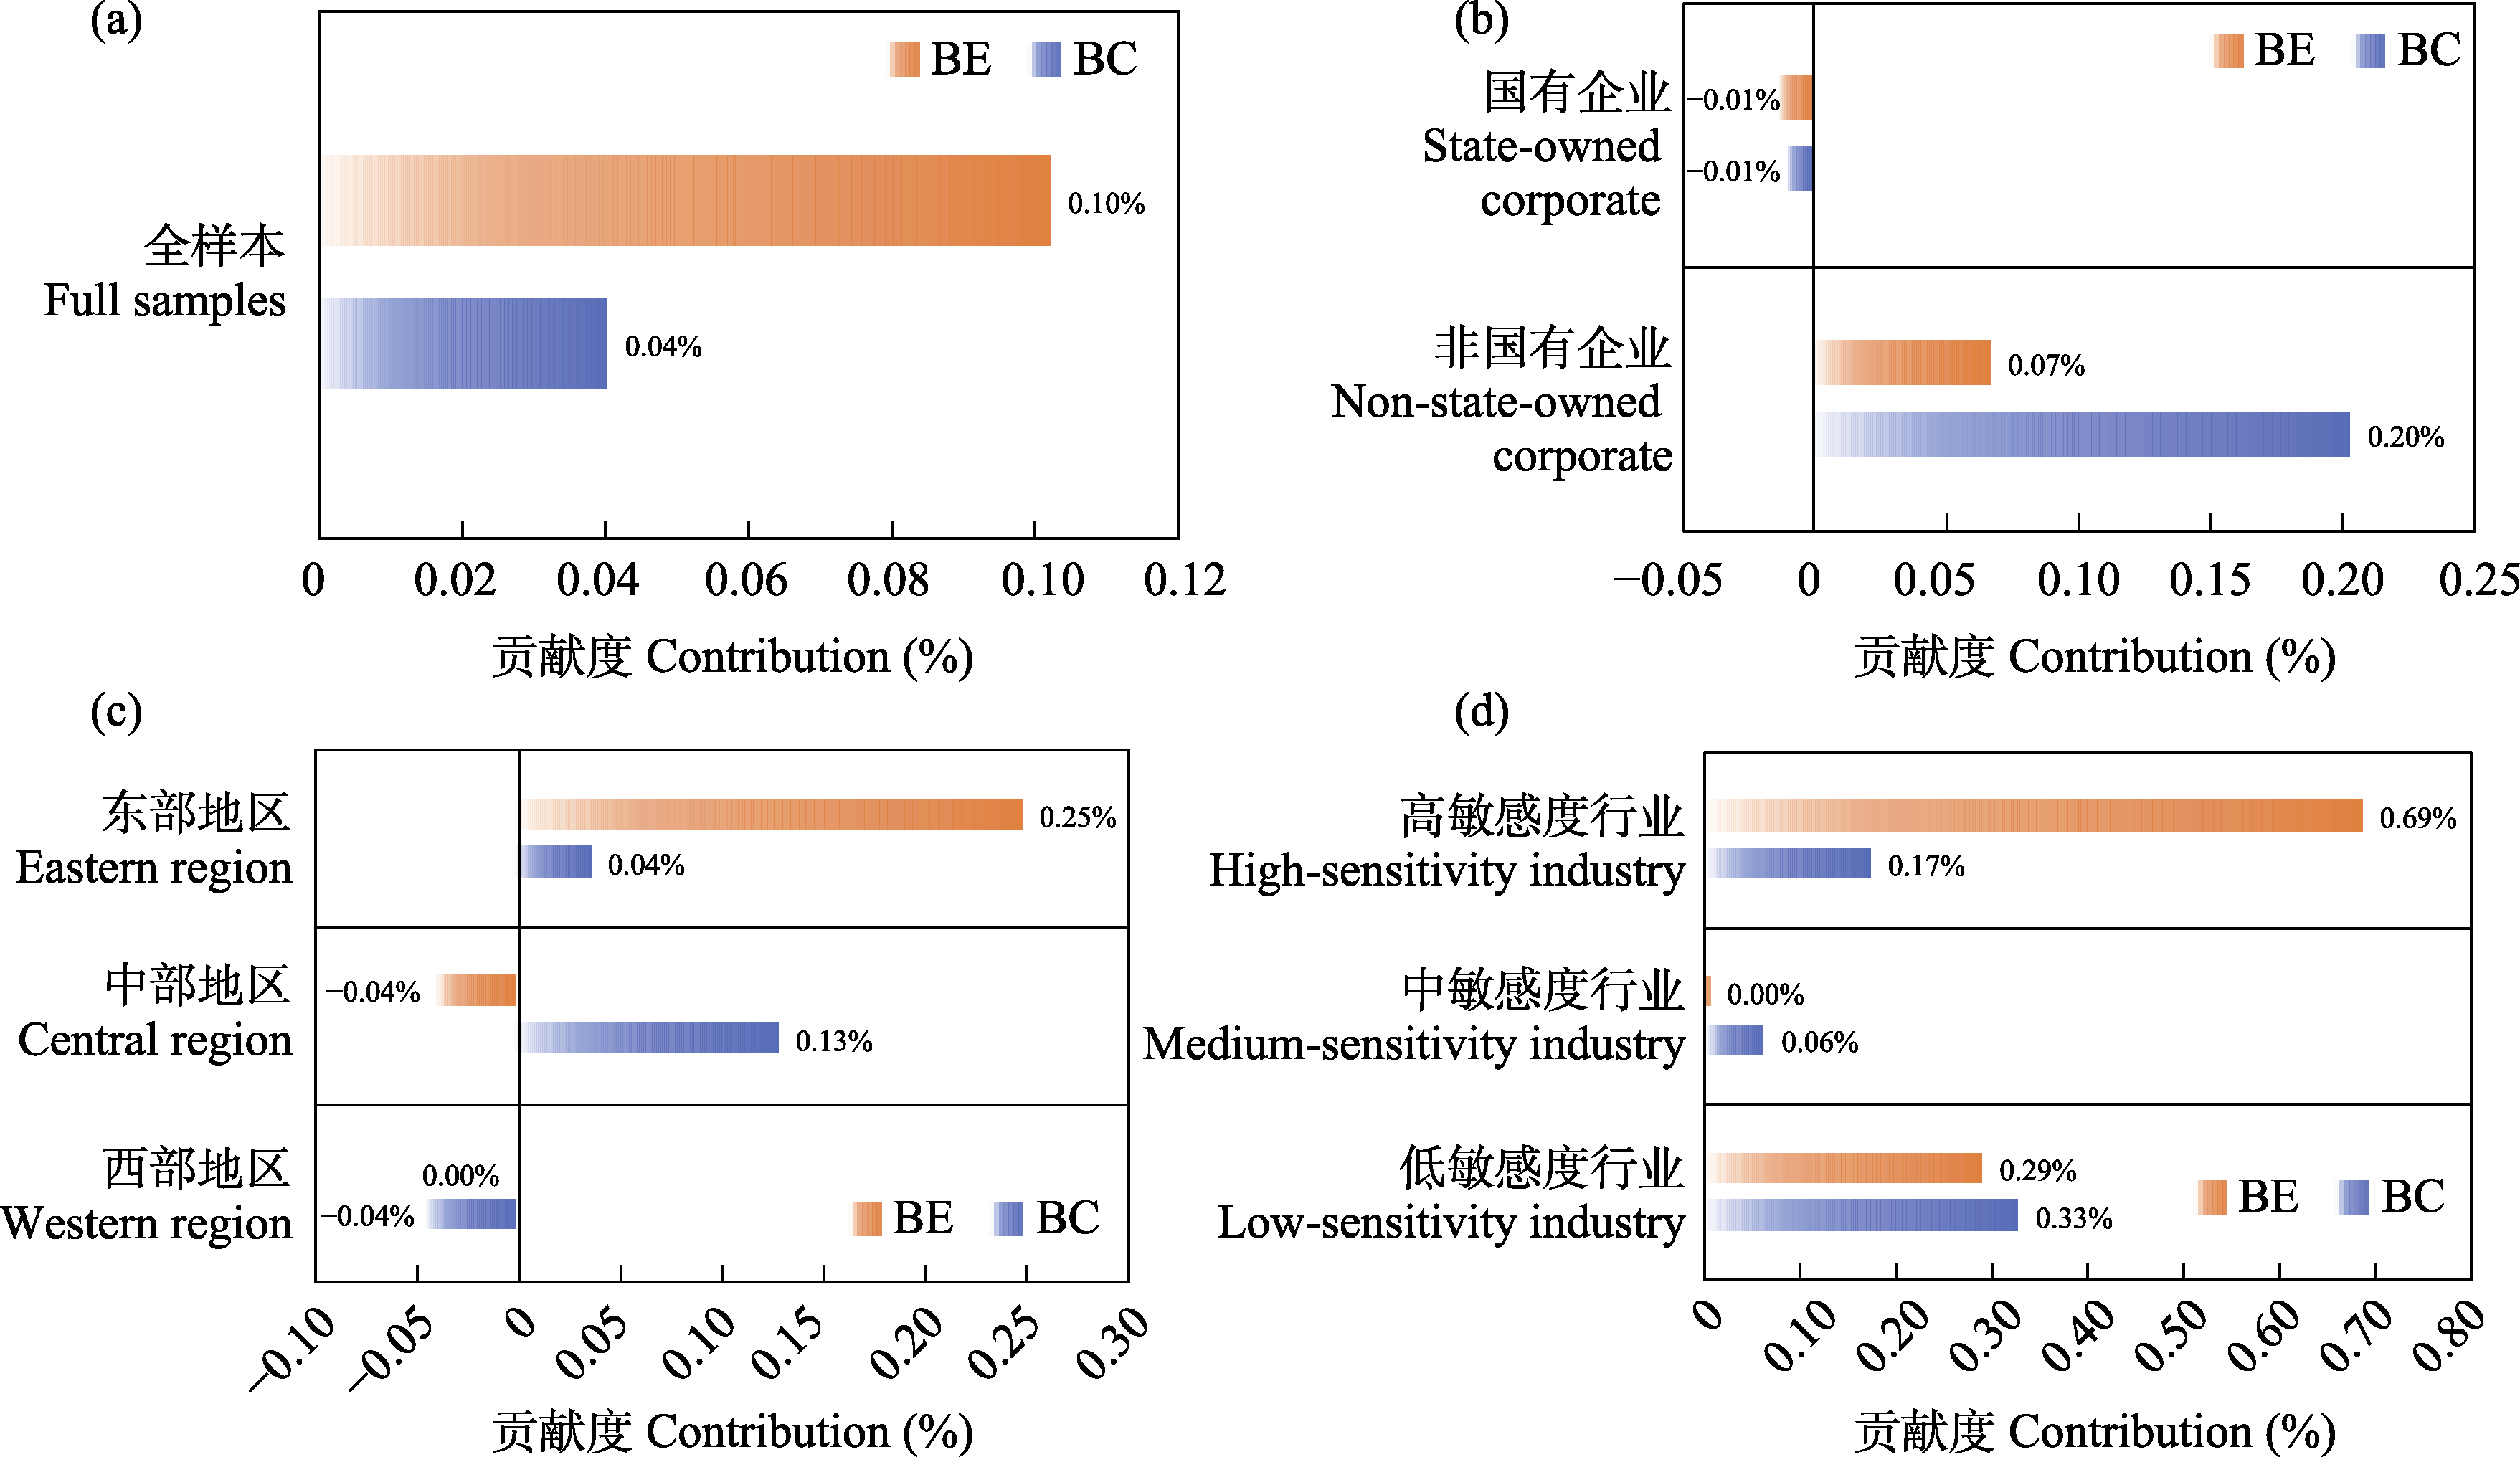
Fig. 2 Contribution of biodiversity risk to corporate financial performance. BE, Biodiversity Exposure Index; BC, Biodiversity Concern Index.
| [1] |
An H, Chen CR, Wu Q, Zhang T (2021) Corporate innovation: Do diverse boards help? Journal of Financial and Quantitative Analysis, 56, 155-182.
DOI URL |
| [2] | Bach TN, Hoang K, Le T (2025) Biodiversity risk and firm performance: Evidence from US firms. Business Strategy and the Environment, 34, 1113-1132. |
| [3] |
Barney J (1991) Firm resources and sustained competitive advantage. Journal of Management, 17, 99-120.
DOI URL |
| [4] |
Bastien-Olvera BA, Moore FC (2021) Use and non-use value of nature and the social cost of carbon. Nature Sustainability, 4, 101-108.
DOI |
| [5] | Chen ZHJ, Derwall J, Gao X, Koedijk K (2025) Does Biodiversity Risk Matter to Capital Markets? New Evidence from China. https://cepr.org/publications/dp20066. (accessed on 2025-03-19) |
| [6] |
Cosma S, Cosma S, Pennetta D, Rimo G (2025) Does biodiversity matter for firm value? Journal of International Financial Markets, Institutions and Money, 105, 102240.
DOI URL |
| [7] |
Cui CY, Hou YL, Wang TY, Wen YL (2022) Biodiversity conservation supported by finance: Global practice and policy enlightenment. Biodiversity Science, 30, 22326.(in Chinese with English abstract)
DOI |
|
[崔楚云, 侯一蕾, 王天一, 温亚利 (2022) 金融支持生物多样性保护: 全球实践及政策启示. 生物多样性, 30, 22326.]
DOI |
|
| [8] |
Elsayed RAA (2023) Exploring the financial consequences of biodiversity disclosure: How does biodiversity disclosure affect firms’ financial performance? Future Business Journal, 9, 22.
DOI |
| [9] | Fang XM, Hu D (2023) Corporate ESG performance and innovation: Empirical evidence from A-share listed companies. Economic Research Journal, 58(2), 91-106.(in Chinese) |
| [方先明, 胡丁 (2023) 企业ESG表现与创新——来自A股上市公司的证据. 经济研究, 58(2), 91-106.] | |
| [10] | Giglio S, Kuchler T, Stroebel J, Zeng XR (2023) Biodiversity risk. https://doi.org/10.3386/w31137. (accessed on 2025-04-17) |
| [11] |
Hart SL (1995) A natural-resource-based view of the firm. The Academy of Management Review, 20, 986.
DOI URL |
| [12] |
He F, Chen LX, Lucey BM (2024) Chinese corporate biodiversity exposure. Finance Research Letters, 70, 106275.
DOI URL |
| [13] |
Houdet J, Trommetter M, Weber J (2012) Understanding changes in business strategies regarding biodiversity and ecosystem services. Ecological Economics, 73, 37-46.
DOI URL |
| [14] | IPBES (Intergovernmental Science-Policy Platform for Biodiversity and Ecosystem Services) (2019) Global Assessment Report on Biodiversity and Ecosystem Services. https://zenodo.org/records/3553579. (accessed on 2024-11-25) |
| [15] | Johnson JA, Baldos U, Cervigni R, Chonabayashi S, Corong E, Gavryliuk O, Hertel T, Nootenboom C, Gerber J, Ruta G, Polasky S (2021) The Economic Case for Nature: A Global Earth-Economy Model to Assess Development Policy Pathways. https://hdl.handle.net/10986/35882. (accessed on 2025-06-29) |
| [16] |
Kong DM, Zhang BH, Zhang J (2022) Higher education and corporate innovation. Journal of Corporate Finance, 72, 102165.
DOI URL |
| [17] | Li XQ, Dong ZF, Ge CZ, Li XL (2022) Study on innovative policy for financing biodiversity. Environmental Protection, 50(8), 28-31.(in Chinese with English abstract) |
| [李晓琼, 董战峰, 葛察忠, 李晓亮 (2022) 生物多样性保护的金融政策创新研究. 环境保护, 50(8), 28-31.] | |
| [18] | Liu Z, Kong LQ, Zhang JB (2025) Green finance and biodiversity: Empirical research based on Chinese bird watching data. China Economic Quarterly, 25, 565-580.(in Chinese with English abstract) |
| [刘钊, 孔令乾, 张俊飚 (2025) 绿色金融与生物多样性——基于中国观鸟数据的考察. 经济学(季刊), 25, 565-580.] | |
| [19] | National Bureau of Statistics (2017) Industrial Classification for National Economic Activities.(in Chinese) |
| [国家统计局 (2017) 国民经济行业分类.] https://www.stats.gov.cn/xxgk/tjbz/gjtjbz/202008/P020200811606493723477.pdf. (accessed on 2025-05-31) | |
| [20] | North DC (1990) Institutions, Institutional Change and Economic Performance. Cambridge University Press, Cambridge, UK. |
| [21] | Qiao Q, Yu QR, Feng L, Chen L, Liu CL, Li A (2024) Establishment of an indicator system for assessing corporate biodiversity performance. Research of Environmental Sciences, 37, 2324-2332.(in Chinese with English abstract) |
| [乔青, 于倩茹, 冯乐, 陈龙, 刘春兰, 李昂 (2024) 企业生物多样性绩效评估指标体系构建. 环境科学研究, 37, 2324-2332.] | |
| [22] | Rao A, Lucey BM, Kumar S (2024) Corporate Biodiversity Risk and Concern: Evidence from Indian Firms and Industry-level Insights. https://papers.ssrn.com/sol3/Delivery.cfm?abstractid=4986392. (accessed on 2024-12-03) |
| [23] | Stiglitz JE, Weiss A (1981) Credit rationing in markets with imperfect information. The American Economic Review, 71, 393-410. |
| [24] |
Tang XM, Qin T (2025) Chinese enterprises’ biodiversity disclosure index construction and financing effects. Biodiversity Science, 33, 24264.(in Chinese with English abstract)
DOI |
|
[汤心萌, 秦涛 (2025) 中国企业生物多样性信息披露指数构建及融资效应. 生物多样性, 33, 24264.]
DOI |
|
| [25] | Tao YN, Yuan J (2022) Impact and enlightenment of biodiversity decline on industrial chain security and financial stability. South China Finance, (2), 72-78.(in Chinese with English abstract) |
| [陶娅娜, 袁佳 (2022) 生物多样性下降对产业链安全及金融稳定的影响与启示. 南方金融, (2), 72-78.] | |
| [26] | Zhu ZX, Zhang LR, Liu Y, Meng R, Jin SC (2025) Business biodiversity conservation: International progress and enlightenment. Acta Ecologica Sinica, 45, 6131-6141.(in Chinese with English abstract) |
| [朱振肖, 张丽荣, 刘洋, 孟锐, 金世超 (2025) 工商业生物多样性保护: 国际进展与启示. 生态学报, 45, 6131-6141.] |
| [1] | Jinyue Zhang, Baole Bian, Tairan Tang, Wenhao Nong, Shufeng Zhu, Xinmin Lu. Plant-rhizosphere microbe interaction and its response to herbivory: A review [J]. Biodiv Sci, 2026, 34(4): 25334-. |
| [2] | Cuiyi Jiang, Zhijing Xie, Zhongping Tian, Yueying Li, Mingxin Zheng, Shuai Fang, Mierkamili Maimaiti, Erfan Akberjan, Meixiang Gao, Jian Zhang. The role of microtopography in shaping forest soil Collembola community assembly in western Tianshan Mountains of Xinjiang [J]. Biodiv Sci, 2026, 34(4): 25300-. |
| [3] | Shuang Zhang, Bo Song. Several key questions when conducting a meta-analysis [J]. Biodiv Sci, 2026, 34(1): 25308-. |
| [4] | Liu Zhixiang, Xie Hua, Zhang Hui, Huang Xiaolei. Functional diversity and regulation of cuticular hydrocarbons in social insects [J]. Biodiv Sci, 2025, 33(2): 24302-. |
| [5] | Yaoqi Chen, Jingjing Guo, Guojun Cai, Yili Ge, Yu Liao, Zheng Dong, Hui Fu. Evolution characteristics of submerged macrophyte community diversity in the middle and lower reaches of the Yangtze River in the past seventy years (1954-2021) [J]. Biodiv Sci, 2024, 32(3): 23319-. |
| [6] | Shuhan Yang, He Wang, Lei Chen, Yingfei Liao, Guang Yan, Yining Wu, Hongfei Zou. Effects of heterogeneous habitat on soil nematode community characteristics in the Songnen Plain [J]. Biodiv Sci, 2024, 32(1): 23295-. |
| [7] | Minghui Wang, Zhaoquan Chen, Shuaifeng Li, Xiaobo Huang, Xuedong Lang, Zihan Hu, Ruiguang Shang, Wande Liu. Spatial pattern of dominant species with different seed dispersal modes in a monsoon evergreen broad-leaved forest in Pu’er, Yunnan Province [J]. Biodiv Sci, 2023, 31(9): 23147-. |
| [8] | Yanqiu Xie, Hui Huang, Chunxiao Wang, Yaqin He, Yixuan Jiang, Zilin Liu, Chuanyuan Deng, Yushan Zheng. Determinants of species-area relationship and species richness of coastal endemic plants in the Fujian islands [J]. Biodiv Sci, 2023, 31(5): 22345-. |
| [9] | Yanhui Li, Tianyuan Lan, Yue Wang, Yang Yu, Changming Zhao, Lihua Li, Wenting Xu, Guozhen Shen. Driving factors of spatial turnover of plant species in Shennongjia [J]. Biodiv Sci, 2022, 30(4): 21377-. |
| [10] | Xue Han, Jinquan Su, Nana Yao, Baoming Chen. Advances in root foraging behavior of exotic invasive plants [J]. Biodiv Sci, 2020, 28(6): 727-733. |
| [11] | Yuan Sun, Weigang Hu, Shuran Yao, Ying Sun, Jianming Deng. Geographic patterns and environmental determinants of angiosperm and terrestrial vertebrate species richness in the Yellow River basin [J]. Biodiv Sci, 2020, 28(12): 1523-1532. |
| [12] | Changyan Zhou, Bin Wang, Yun Deng, Junjie Wu, Min Cao, Luxiang Lin. Canopy structure is an important factor driving local-scale woody plant functional beta diversity [J]. Biodiv Sci, 2020, 28(12): 1546-1557. |
| [13] | Guijun Yang, Min Wang, Yichun Yang, Xinyun Li, Xinpu Wang. Distribution patterns and environmental interpretation of beetle species richness in Helan Mountain of northern China [J]. Biodiv Sci, 2019, 27(12): 1309-1319. |
| [14] | Shuoran Liu, Daode Yang, Xianfu Li, Lu Tan, Jun Sun, Xiaoyang He, Wenshu Yang, Guopeng Ren, Davide Fornacca, Qinghua Cai, Wen Xiao. Diversity in benthic and environmental characteristics on alpine micro-waterbodies and stream ecosystems in northwest Yunnan [J]. Biodiv Sci, 2019, 27(12): 1298-1308. |
| [15] | Yu Zhang, Gang Feng. Distribution pattern and mechanism of insect species diversity in Inner Mongolia [J]. Biodiv Sci, 2018, 26(7): 701-706. |
| Viewed | ||||||
|
Full text |
|
|||||
|
Abstract |
|
|||||
Copyright © 2026 Biodiversity Science
Editorial Office of Biodiversity Science, 20 Nanxincun, Xiangshan, Beijing 100093, China
Tel: 010-62836137, 62836665 E-mail: biodiversity@ibcas.ac.cn