
生物多样性 ›› 2012, Vol. 20 ›› Issue (1): 76-85. DOI: 10.17520/biods.2011131 cstr: 32101.14.biods.2011131
赖昆祺1, 郑又华1, 陈岳智1, 李佑升2, 邵广昭1,*( )
)
收稿日期:2011-07-29
接受日期:2012-01-15
出版日期:2012-01-20
发布日期:2012-02-14
通讯作者:
邵广昭
作者简介:*E-mail: zoskt@gate.sinica.edu.tw
Kunchi Lai1, Youhua Cheng1, Yuehchih Chen1, Yousheng Li2, Kwangtsao Shao1,*()
Received:2011-07-29
Accepted:2012-01-15
Online:2012-01-20
Published:2012-02-14
Contact:
Kwangtsao Shao
摘要:
物种出现记录包含博物馆动物标本、植物标本、生态调查与物种观察等资料。在台湾生物多样性信息机构(Taiwan Biodiversity Information Facility, TaiBIF)物种出现记录整合平台中, 已整合台湾26个数据集, 包含超过150万笔物种出现记录, 其中约有85%的数据具有地理信息。我们利用数据库中所汇整的鲤科数据, 包括11个数据集、超过8,800笔出现记录数据, 利用网格式、切割式与密度式3种聚类分析算法分别绘制出不同的空间可视化结果, 藉此解决大量物种出现记录于Google Maps上呈现效能与可视化不佳之问题。同时我们也探讨了3种聚类分析法之结果与鲤科的专家意见范围地图(expert opinion range maps)比对的差异。期望透过本研究可快速且有效地呈现物种分布资料, 进而帮助研究者挖掘出大量数据所隐含的知识, 并为生态保育提供重要参考。
赖昆祺, 郑又华, 陈岳智, 李佑升, 邵广昭 (2012) 运用聚类分析与Google Maps于大量物种出现记录之研究. 生物多样性, 20, 76-85. DOI: 10.17520/biods.2011131.
Kunchi Lai, Youhua Cheng, Yuehchih Chen, Yousheng Li, Kwangtsao Shao (2012) Applying cluster analysis and Google Maps in the study of large-scale species occurrence data. Biodiversity Science, 20, 76-85. DOI: 10.17520/biods.2011131.
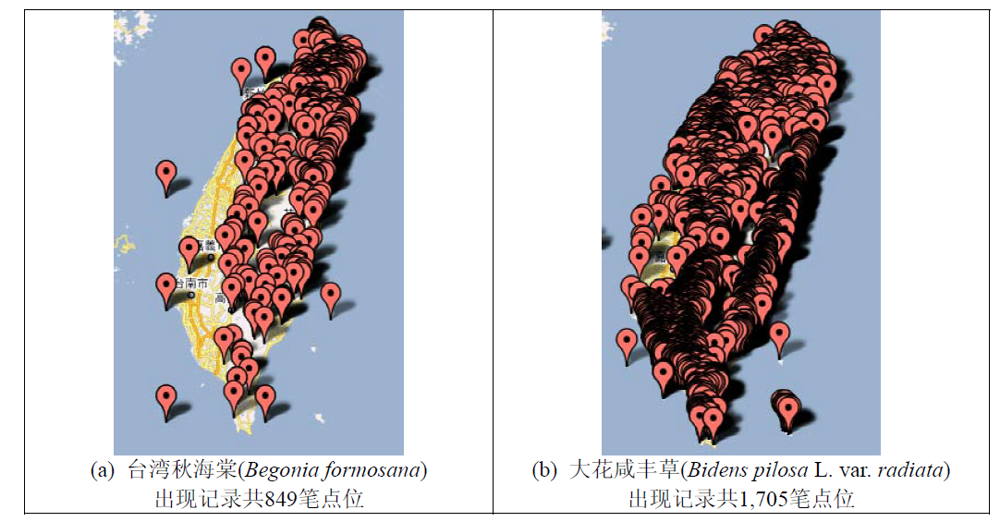
图1 不同物种出现记录点位分布
Fig. 1 Display of species occurrence data on the maps
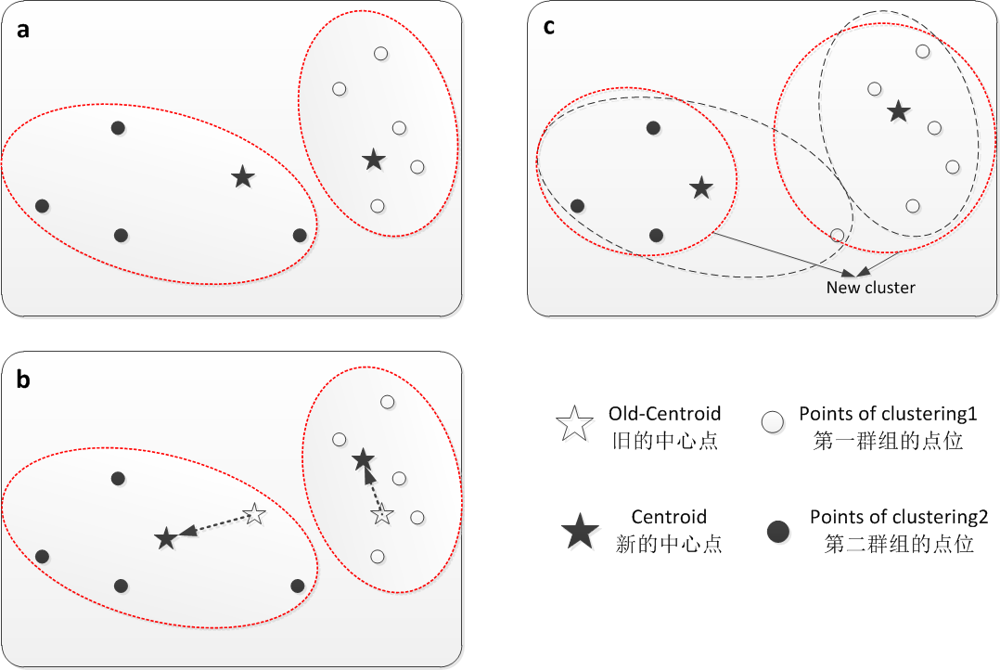
图2 K-means算法概念
Fig. 2 The concept of K-means algorithm
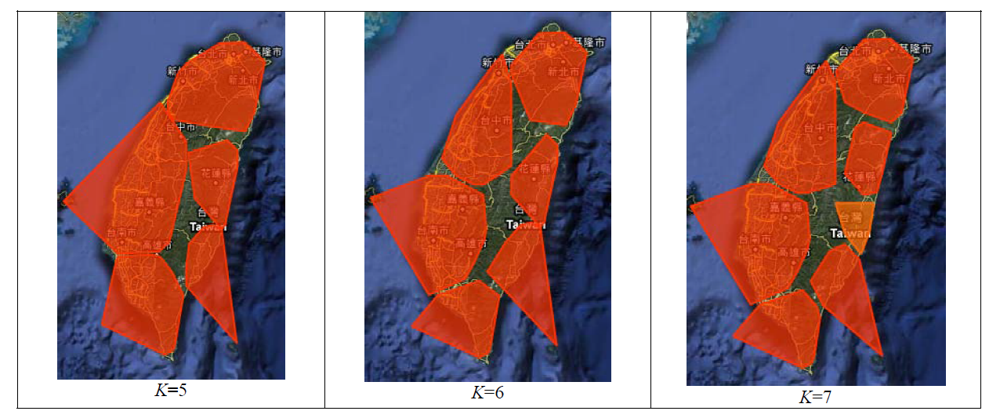
图3 不同K值下鲤科聚类分析图
Fig. 3 Cluster analysis of Cyprinidae using different K-values
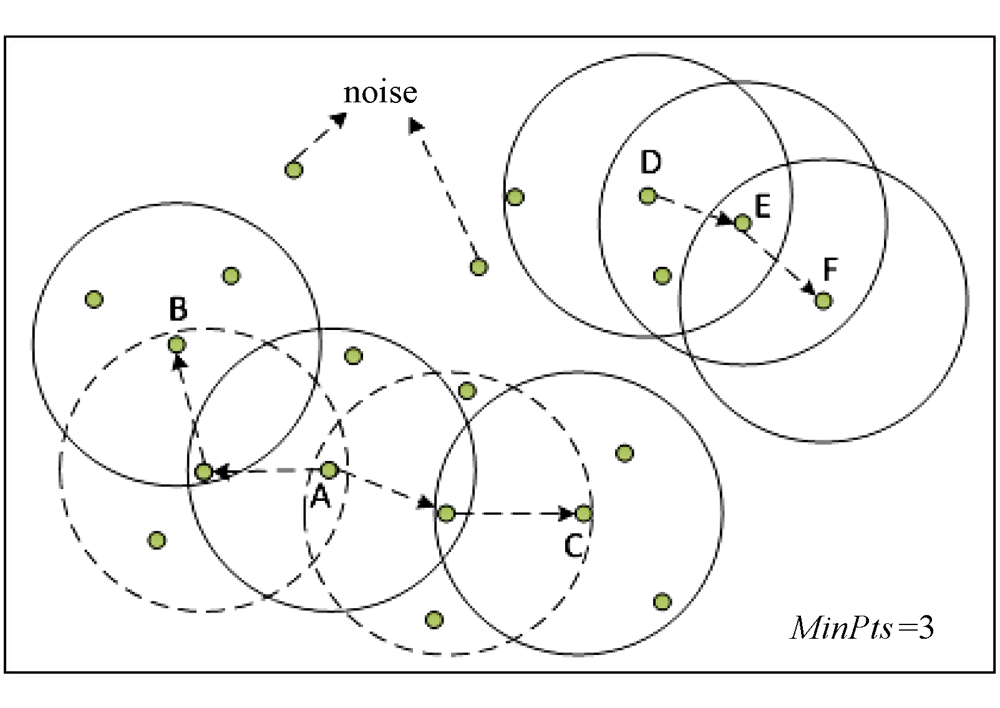
图4 DBSCAN密度可达与密度连接点示意图
Fig. 4 Density-reachable and density-connected in DBSCAN clustering
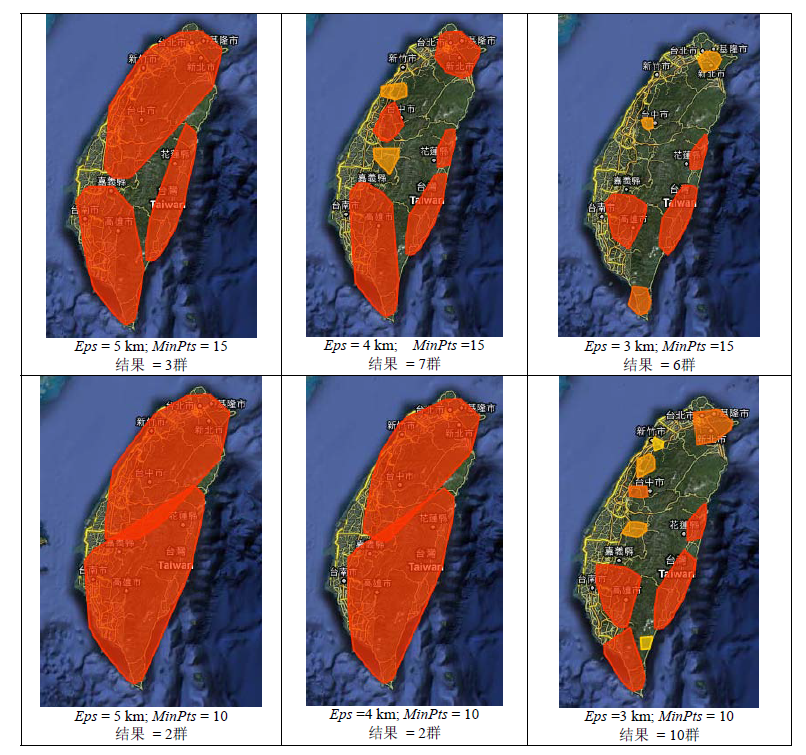
图5 藉由不同的Eps与MinPts进行台湾鲤科鱼类之聚类分析
Fig. 5 Cluster analysis of Cyprinidae in Taiwan using different combinations of Eps and MinPts
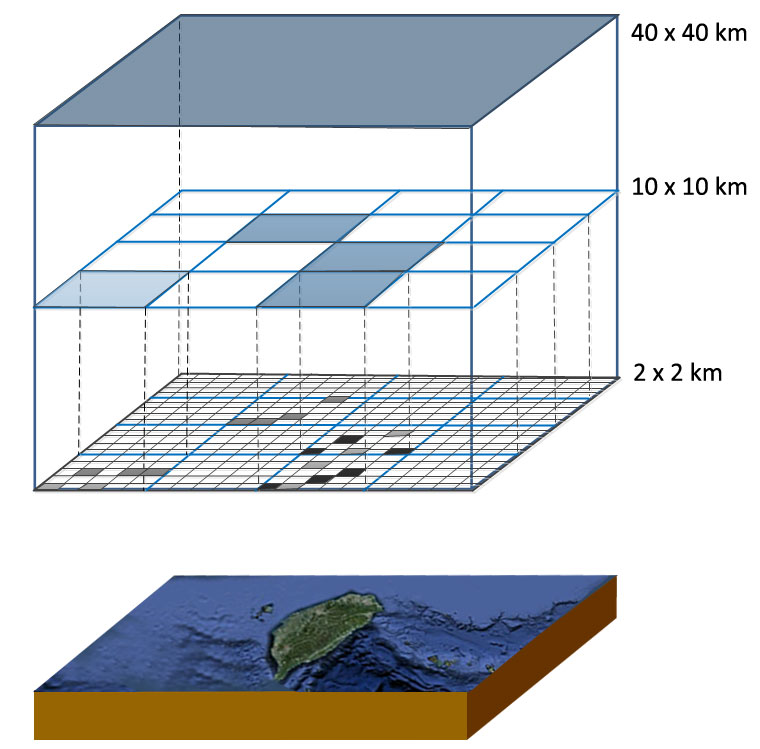
图6 不同尺度统计信息网格概念
Fig. 6 The hierarchical structure of Statistical Information Grid (STING)
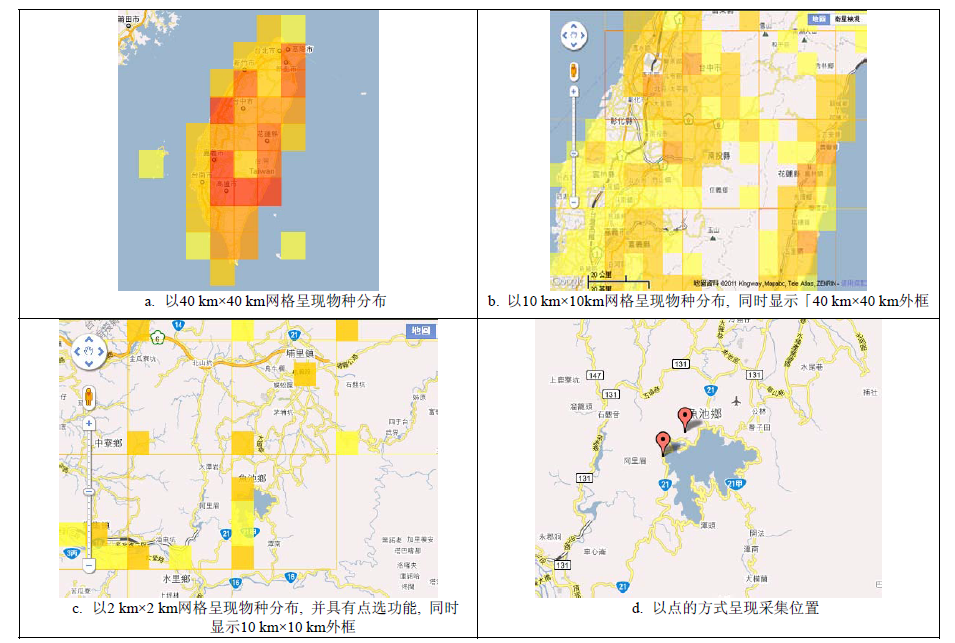
图7 不同比例尺下物种分布之网格图
Fig. 7 Converts the coordinates of species occurrence data into colored grid squares of different spatial scales
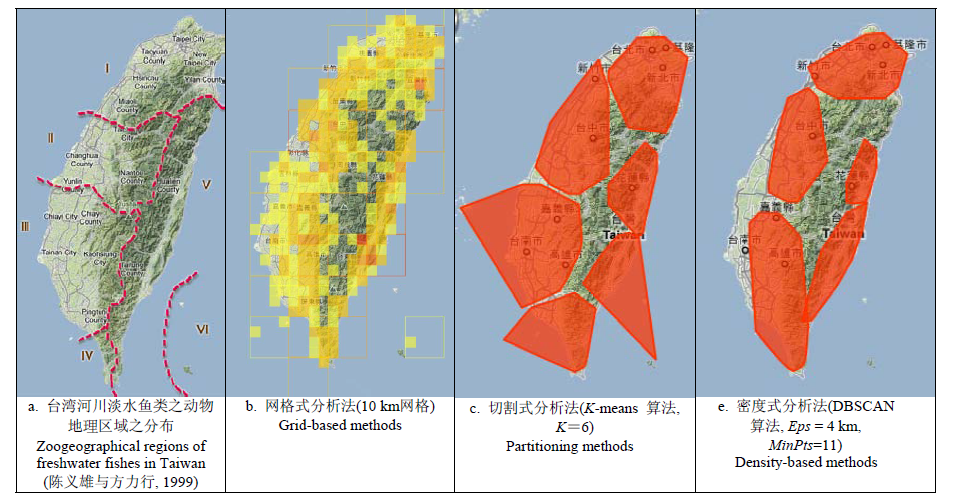
图8 台湾河川淡水鱼类之动物地理区域之分布與3种不同聚类分析法之鲤科分布图
Fig. 8 Zoogeographical regions of freshwater fishes in Taiwan compare with three different cluster analysis methods
| 网格式分析法 Grid-based methods | 切割式分析法 Partitioning methods | 密度式分析法 Density-based methods | |
|---|---|---|---|
| 参数设定 Parameter settings | 容易, 只需决定每层网格边长 Easy; only need to determine length of grid for each level | 容易, 只需决定分的群数(K) Easy; only need to determine K | 困难, 需要反复调整MinPts与Eps两参数 Hard; need to adjust MinPtsandEpsrepetitively |
| 计算效能 Computing efficiency | 快。时间复杂度为O(n) Fast; time complexity is O(n) | 慢。时间复杂度为O(kmn) Slowest; time complexity isO(kmn) | 中。时间复杂度为O(nlgn) Slow; time complexity isO(nlgn) |
| 噪声或偏离值处理 Processing of noise or outliers | 无 No | 无 No | 有 Yes |
| 与Google Map的可视化呈现(此处是指Google Map上程序撰写的难易度) Programming for Google map visualizations | 较为困难 Hard | 较为容易 Easy | 较为容易 Easy |
| 依据地图分辨率而改变聚类分析结果(具有阶层变化) Display of cluster analysis results on a map using different scales | 有, 以本研究为例提供3种网格尺度 Easy; the study has three different spatial scales | 无 No | 无 No |
| 呈现物种分布的概括 Presentation of species distribution | 不容易看出 Difficult to spot distribution | 接近 Easy to spot and more precise | 较接近 Easy to spot and most precise |
表1 3种聚类分析法比较: 以鲤科数据为范例
Table 1 Comparison of three different cluster analysis methods: a case study of Cyprinidae distribution
| 网格式分析法 Grid-based methods | 切割式分析法 Partitioning methods | 密度式分析法 Density-based methods | |
|---|---|---|---|
| 参数设定 Parameter settings | 容易, 只需决定每层网格边长 Easy; only need to determine length of grid for each level | 容易, 只需决定分的群数(K) Easy; only need to determine K | 困难, 需要反复调整MinPts与Eps两参数 Hard; need to adjust MinPtsandEpsrepetitively |
| 计算效能 Computing efficiency | 快。时间复杂度为O(n) Fast; time complexity is O(n) | 慢。时间复杂度为O(kmn) Slowest; time complexity isO(kmn) | 中。时间复杂度为O(nlgn) Slow; time complexity isO(nlgn) |
| 噪声或偏离值处理 Processing of noise or outliers | 无 No | 无 No | 有 Yes |
| 与Google Map的可视化呈现(此处是指Google Map上程序撰写的难易度) Programming for Google map visualizations | 较为困难 Hard | 较为容易 Easy | 较为容易 Easy |
| 依据地图分辨率而改变聚类分析结果(具有阶层变化) Display of cluster analysis results on a map using different scales | 有, 以本研究为例提供3种网格尺度 Easy; the study has three different spatial scales | 无 No | 无 No |
| 呈现物种分布的概括 Presentation of species distribution | 不容易看出 Difficult to spot distribution | 接近 Easy to spot and more precise | 较接近 Easy to spot and most precise |
| [1] | Chapman AD (2005) Uses of primary species-occurrence data, version 1.0, Global Biodiversity Information Facility. |
| [2] | Chen IS (陈义雄), Fang LS (方力行) (1999) The Freshwater and Estuarine Fishes of Taiwan (台湾淡水及河口鱼类志). Museum of Marine Biology and Aquarium, Taiwan. (in Chinese) |
| [3] | Encyclopedia of Life (2011) Retrieved from http://www.eol.org, Accessed 2011-07-01. |
| [4] | Ester M, Kriegel HP, Sander J, Xu X (1998) Clustering for mining in large spatial databases. Special Issue on Data Mining, KI-Journal, ScienTec Publishing, 1,1-7. |
| [5] | Flemons P, Guralnick R, Krieger J, Ranipeta A, Neufeld D (2007) A web-based GIS tool for exploring the world's biodiversity: The Global Biodiversity Information Facility Mapping and Analysis Portal Application (GBIF-MAPA). Ecological Informatics, 2(1),49-60. |
| [6] | GBIF Data Portal (2011) Retrieved from http://data.gbif.org, Accessed 2011-07-01. |
| [7] | Han J, Kamber M (2006) Data Mining: Concepts and Techniques, 2nd edn. Morgan Kaufmann Publishers, Amsterdam. |
| [8] |
Hijmans RJ, Spooner DM (2001) Geographic distribution of wild potato species. American Journal of Botany, 88,2101-2112.
URL PMID |
| [9] |
Hill AW, Guralnick RP, Flemons P, Beaman R, Wieczorek J, Ranipeta A, Chavan V, Remsen D (2009) Location, location, location: utilizing pipelines and services to more effectively georeference the world’s biodiversity data. BMC Bioinformatics, 10,S3.
URL PMID |
| [10] | Hill AW, Otegui J, Ariño AH, Guralnick RP (2010) GBIF Position Paper on Future Directions and Recommendations for Enhancing Fitness-for-Use Across the GBIF Network, version 1.0. Copenhagen: Global Biodiversity Information Facility, 25. |
| [11] | Jaffe A, Naaman M, Tassa T, Davis M (2006) Generating summaries and visualization for large collections of geo-referenced photographs. In: Proceedings of the 8th ACM International Workshop on Multimedia Information Retrieval, pp.89-98. |
| [12] | Liu X, Hui Y, Sun W, Liang H (2007) Towards Service Composition Based on Mashup. In: 2007 IEEE Congress on Services,332-339. |
| [13] | Miller HJ, Han J (2009) Geographic Data Mining and Knowledge Discovery, 2nd edn. CRC Press. |
| [14] | Mucke E (2009) Computing Prescriptions: Quickhull: Computing Convex Hulls Quickly. Computing in Science Engineering, 11(5),54-57. |
| [15] | Peterson AT, Knapp S, Guralnick R, Soberón J, Holder MT (2010) The big questions for biodiversity informatics. Systematics and Biodiversity, 8(2),159-168. |
| [16] | Proj4 (2011) Retrieved from http://trac.osgeo.org/proj/, Accessed 2011-07-01. |
| [17] | Shao KT, Peng CI, Yen E, Lai KC, Wang MC, Lin J, Yang A, Chen SY (2007) Integration of biodiversity databases in Taiwan and linkage to global databases. Data Science Journal, 6,S2-S10. |
| [18] | Shao KT (邵广昭), Lai KC (赖昆祺), Lin YC (林永昌), Ko CJ (柯智仁), Lee H (李瀚), Hung LY (洪铃雅), Chen YC (陈岳智), Chen LS (陈丽西) (2010) Experience and strategy of biodiversity data integration in Taiwan, Biodiversity Science (生物多样性), 18,444-453. (in Chinese with English abstract) |
| [19] | Tang M, Zhou Y, Cui P, Wang W, Li J, Zhang H, Hou Y, Yan B (2009) Discovery of migration habitats and routes of wild bird species by clustering and association analysis. Advan- ced Data Mining and Applications, 5678,288-301. |
| [20] | Wu X, Kumar V, Quinlan JR, Ghosh J, Yang Q, Motoda H, McLachlan GJ, Ng A, Liu B, Yu PS, Zhou ZH, Steinbach M, Hand DJ, Steinberg D (2008) Top 10 algorithms in data mining. Knowledge and Information Systems, 14(1),1-37. |
| [21] | Zang N, Rosson MB, Nasser V (2008) Mashups: who? what? why? Proceedings of CHI '08 Extended Abstracts on Human Factors in Computing Systems, 3171-3176. |
| [1] | 尚华丹, 张楚晴, 王梅, 裴文娅, 李国宏, 王鸿斌. 中国杨树害虫物种多样性及其地理分布[J]. 生物多样性, 2025, 33(2): 24370-. |
| [2] | 吴相獐, 雷富民, 单壹壹, 于晶. 上海城市公园苔藓植物多样性分布格局及其环境影响因子[J]. 生物多样性, 2024, 32(2): 23364-. |
| [3] | 丁晨晨, 梁冬妮, 信文培, 李春旺, 蒋志刚. 中国哺乳动物形态、生活史和生态学特征数据集[J]. 生物多样性, 2022, 30(2): 21520-. |
| [4] | 刘童祎, 陈静, 姜立云, 乔格侠. 中国半翅目等29目昆虫2020年新分类单元[J]. 生物多样性, 2021, 29(8): 1050-1057. |
| [5] | 刘丽平, 宋瑞凤, 张馥, 张秀香, 彭桂香, 谭志远. 高秆野生稻内生固氮细菌多样性[J]. 生物多样性, 2020, 28(8): 1018-1025. |
| [6] | 刘丹, 郭忠玲, 崔晓阳, 范春楠. 5种东北红豆杉植物群丛及其物种多样性的比较[J]. 生物多样性, 2020, 28(3): 340-349. |
| [7] | 王凤珍, 唐毅. 食物网关键种的判定及其对稳健性的影响[J]. 生物多样性, 2019, 27(10): 1132-1137. |
| [8] | 张凤麟, 王昕, 张健. 生物多样性信息资源.II.环境类型数据[J]. 生物多样性, 2018, 26(1): 53-65. |
| [9] | 张健. 大数据时代的生物多样性科学与宏生态学[J]. 生物多样性, 2017, 25(4): 355-363. |
| [10] | 郜二虎, 何杰坤, 王志臣, 徐扬, 唐小平, 江海声. 全国陆生野生动物调查单元区划方案[J]. 生物多样性, 2017, 25(12): 1321-1330. |
| [11] | 王昕, 张凤麟, 张健. 生物多样性信息资源. I. 物种分布、编目、系统发育与生活史性状[J]. 生物多样性, 2017, 25(11): 1223-1238. |
| [12] | 林小植, 李冬梅, 刘焕章, 林鸿生, 杨少荣, 范汉金, 温茹淑. 广东韩江潮州江段鱼类多样性及季节变化[J]. 生物多样性, 2016, 24(2): 185-194. |
| [13] | 王利松, 张红瑞, 张宪春. Scratchpads 2.0: 互联网时代的生物多样性虚拟研究环境[J]. 生物多样性, 2014, 22(3): 264-276. |
| [14] | 邵广昭, 李瀚, 林永昌, 赖昆祺. 海洋生物多样性信息资源[J]. 生物多样性, 2014, 22(3): 253-263. |
| [15] | 孙立夫, 裴克全, 张艳华, 赵俊, 杨国亭, 秦国夫, 宋玉双, 宋瑞清. 中国与欧洲高卢蜜环菌的遗传多样性[J]. 生物多样性, 2012, 20(2): 224-230. |
| 阅读次数 | ||||||
|
全文 |
|
|||||
|
摘要 |
|
|||||
备案号:京ICP备16067583号-7
Copyright © 2026 版权所有 《生物多样性》编辑部
地址: 北京香山南辛村20号, 邮编:100093
电话: 010-62836137, 62836665 E-mail: biodiversity@ibcas.ac.cn
![]()