
Biodiv Sci ›› 2013, Vol. 21 ›› Issue (5): 554-563. DOI: 10.3724/SP.J.1003.2013.10049 cstr: 32101.14.SP.J.1003.2013.10049
• Orginal Article • Previous Articles Next Articles
Pin Lu1,2, Yi Jin2, Jianhua Chen1, Minghong Li1,*, Mingjian Yu2,*( )
)
Received:2013-02-24
Accepted:2013-04-26
Online:2013-09-20
Published:2013-10-08
Contact:
Li Minghong,Yu Mingjian
Pin Lu,Yi Jin,Jianhua Chen,Minghong Li,Mingjian Yu. Influence of geographical distance and topographic difference on β diversity in two large-scale forest dynamics plots[J]. Biodiv Sci, 2013, 21(5): 554-563.
| 样地 Plot | 大小 Size | 经度 Longitude | 纬度 Latitude | 海拔 Elevation (m) | 坡度 Slope |
|---|---|---|---|---|---|
| GTS | 400 m (SN)×600 m (WE) | 118°07.010′-118°07.400′ E | 29°15.101′-29°15.344′ N | 446.3-714.9 | 12.8°-62.0° |
| BCI | 500 m (SN)×1,000 m (WE) | 79°51.31'-79°51.318' W | 9°9.075'-9°9.345' N | 121.2-159.2 | 0.2°-19.4° |
Table 1 Background information about the Gutianshan plot and the Barro Colorado Island (BCI) plot
| 样地 Plot | 大小 Size | 经度 Longitude | 纬度 Latitude | 海拔 Elevation (m) | 坡度 Slope |
|---|---|---|---|---|---|
| GTS | 400 m (SN)×600 m (WE) | 118°07.010′-118°07.400′ E | 29°15.101′-29°15.344′ N | 446.3-714.9 | 12.8°-62.0° |
| BCI | 500 m (SN)×1,000 m (WE) | 79°51.31'-79°51.318' W | 9°9.075'-9°9.345' N | 121.2-159.2 | 0.2°-19.4° |
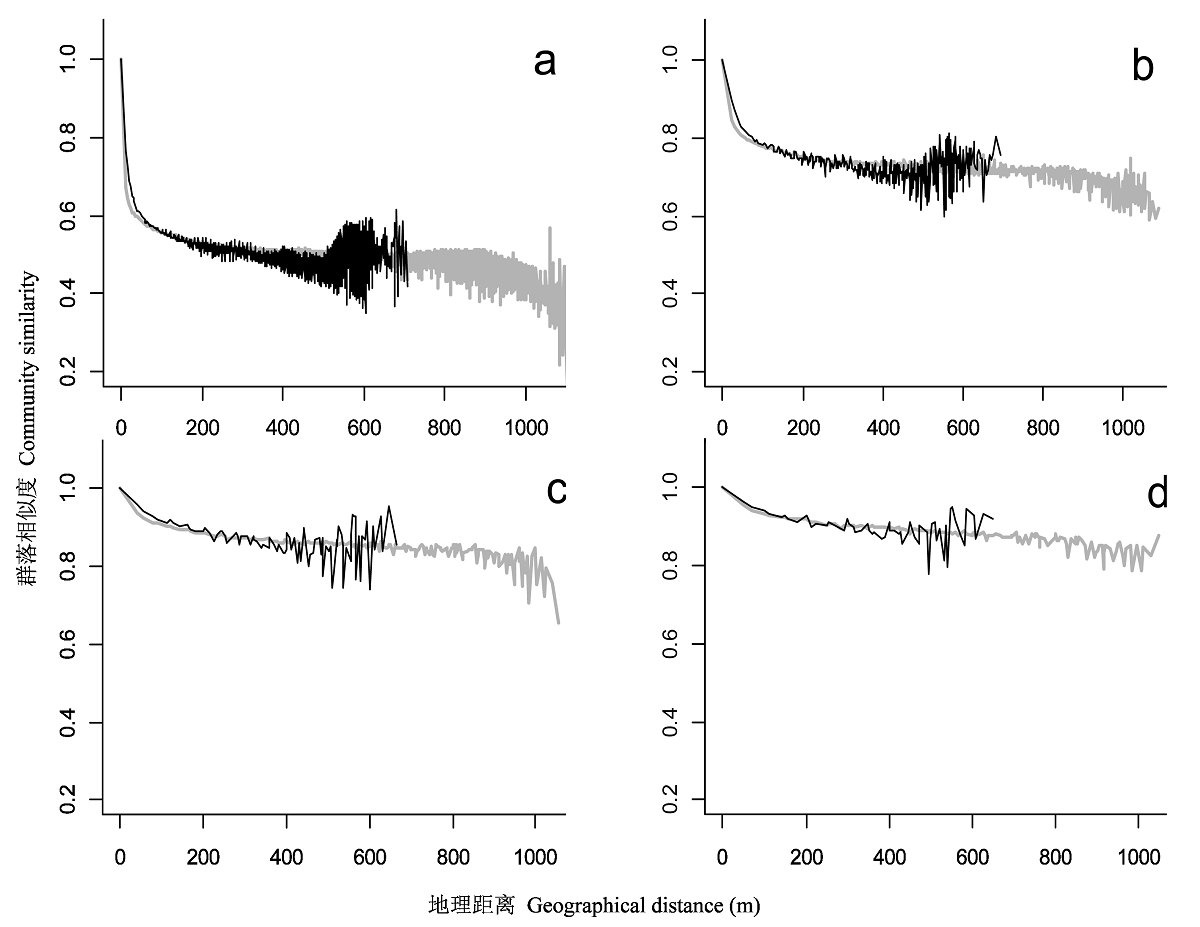
Fig. 1 Relationship between community similarity and distance at different grain sizes. a, b, c and d represent grain sizes of 10 m, 20 m, 40 m and 50 m, respectively. Black line indicates Gutianshan plot; Grey line indicates BCI plot.
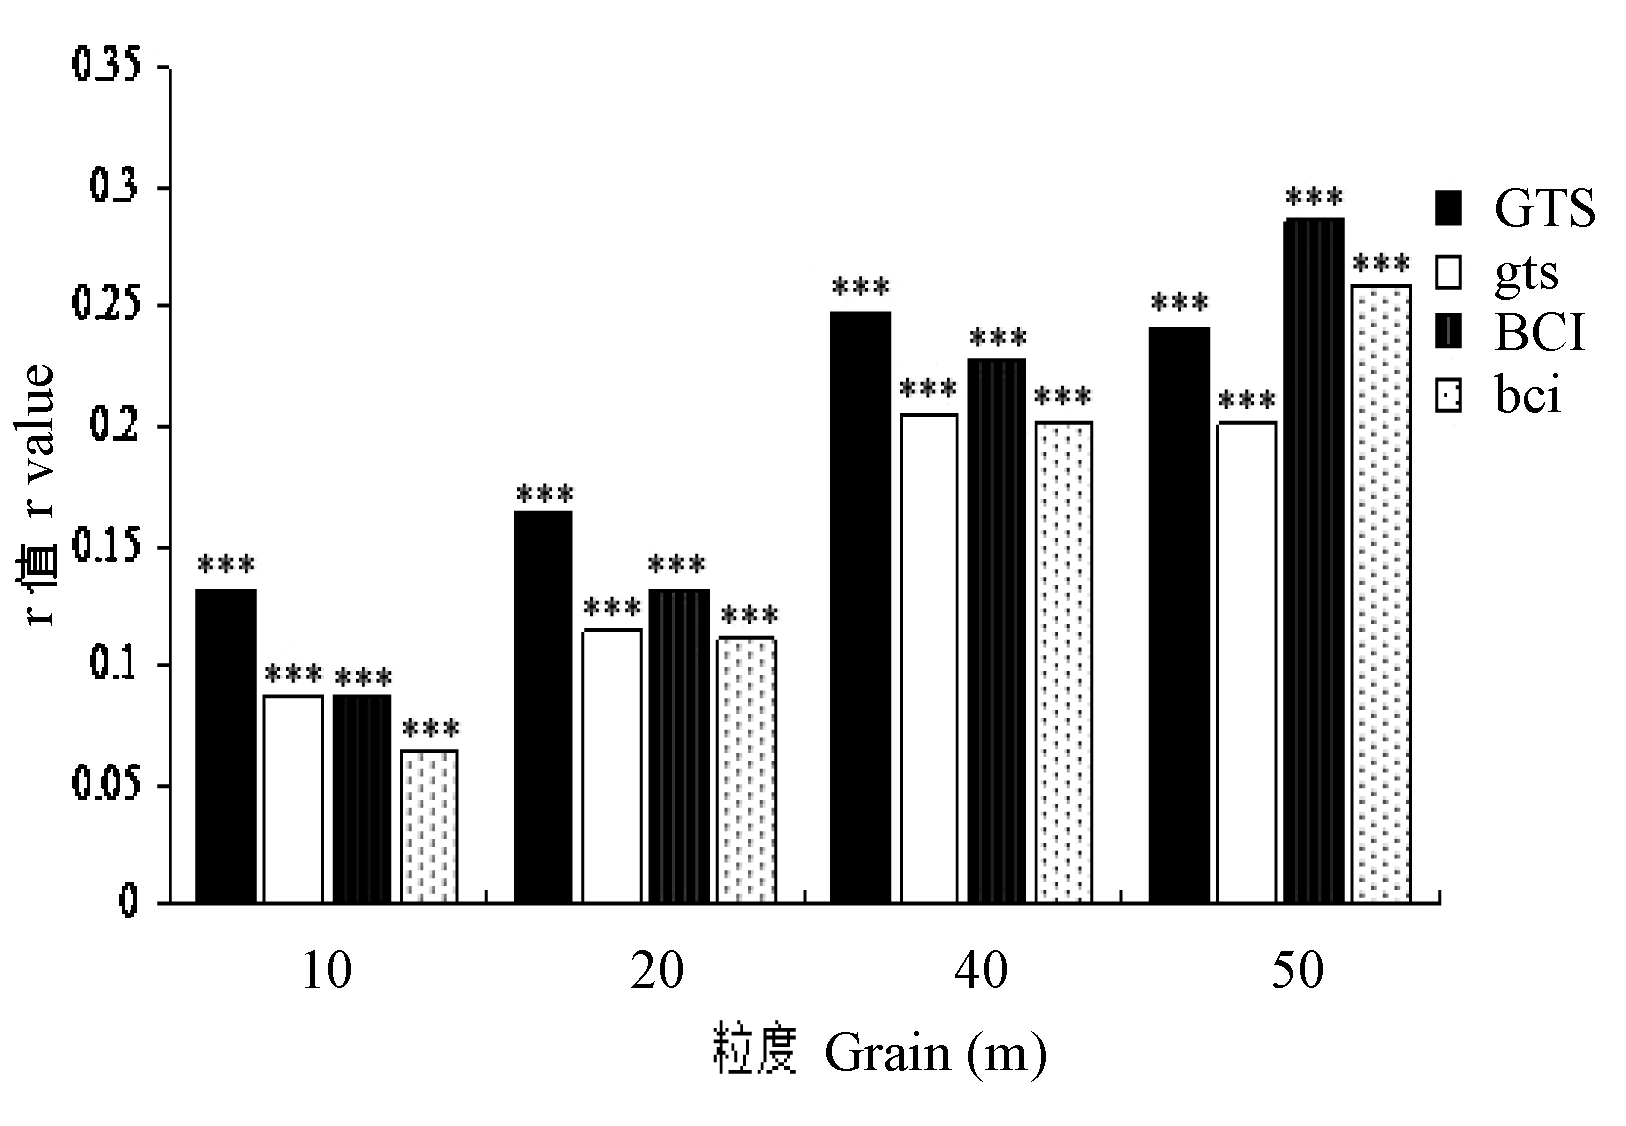
Fig. 2 The Mantel-test derived correlation coefficients bet- ween beta diversity and geographical distance at each grain size in the Gutianshan (GTS) plot and Barro Colorado Island (BCI) plot. GTS and BCI, Topography uncontrolled; gts and bci, Topography controlled.
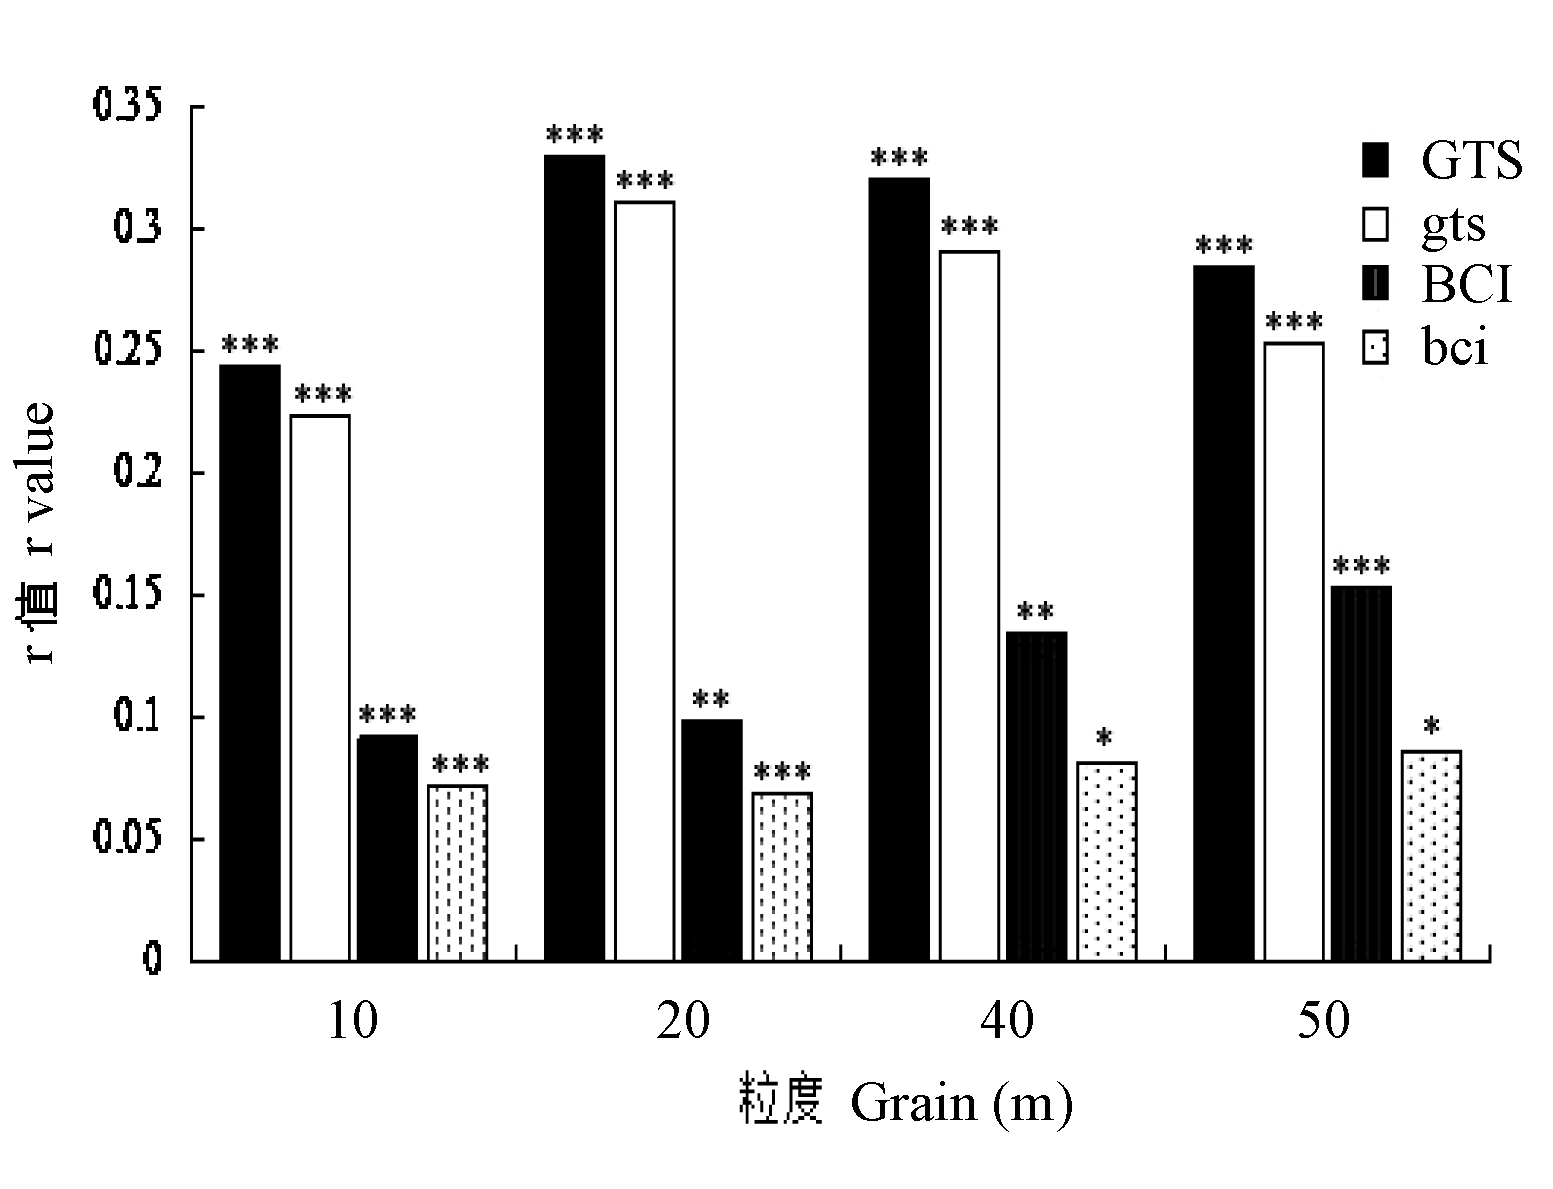
Fig. 3 The Mantel-test derived correlation coefficients bet- ween beta diversity and topographic difference at each grain size in the Gutianshan (GTS) plot and Barro Colorado Island (BCI) plot (* P<0.05, ** P<0.01, *** P<0.001). GTS and BCI, Geographical distance uncontrolled; gts and bci, Geographical distance controlled.
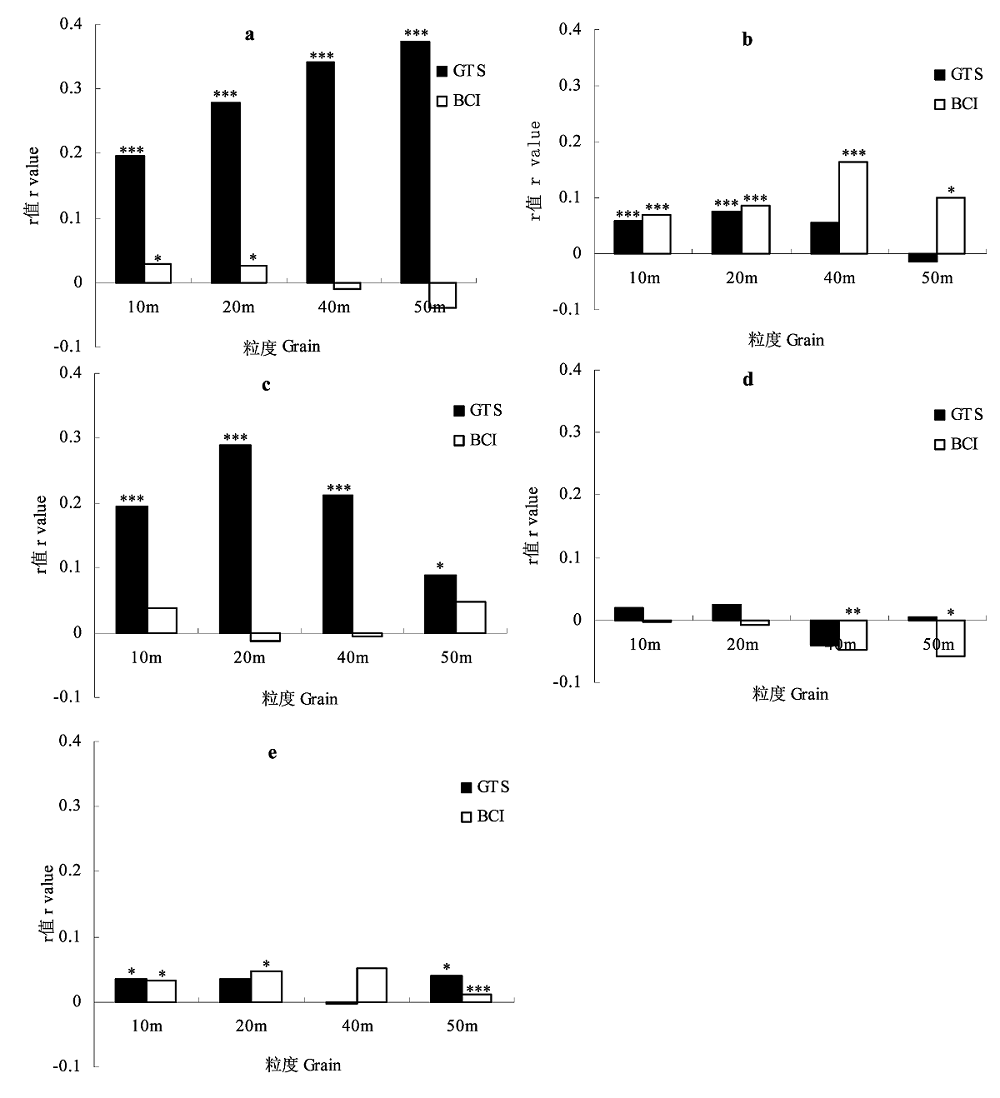
Fig. 4 The Partial Mantel-test derived correlation coefficients between beta diversity and each topographic variables (elevation, convexity, slope, EW aspect and SN aspect) at each grain sizes in the GTS plot and BCI plot (* P<0.05, ** P<0.01, *** P<0.001). a, Elevation; b, Slope; c, Convexity; d, Aspect 1 (East-West); e, Aspect 2 (North-South).
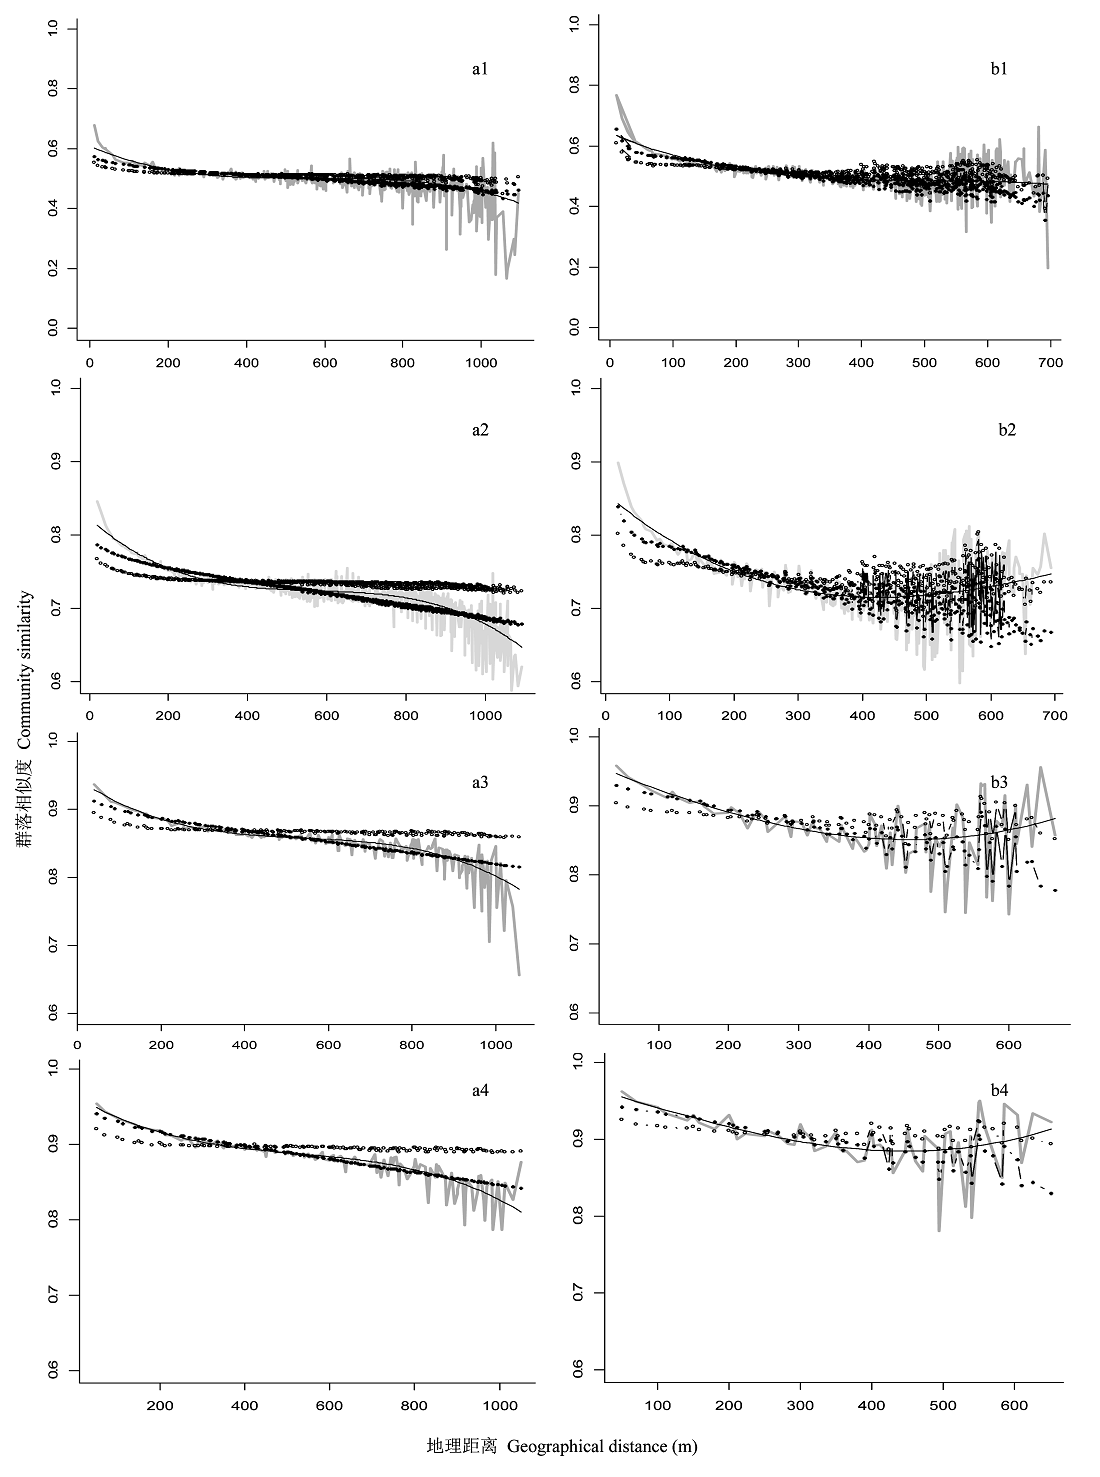
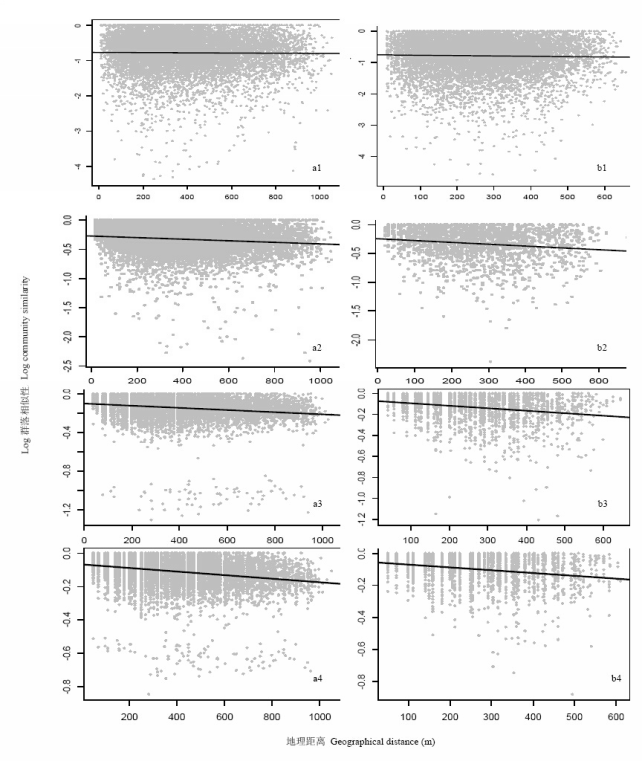
Fig. 5 The third-degree polynomial regressions fitting the relationship between community similarity and geographical distance and topographic difference. a, BCI plot; b, GTS plot; 1, 2, 3 and 4 represent grain sizes 10 m, 20 m, 40 m, and 50 m respectively. Grey line indicate observe values. Black line represents geographical distance fitting, the adjusted R2 from 10 m to 50 m grain size in GTS were 0.0211, 0.0351, 0.0710 and 0.0680, respectively, and in BCI were 0.0104, 0.0219, 0.0601 and 0.0875, respectively. Circles represent topography fitting, the adjusted R2 from 10 m to 50 m grain size in GTS were 0.0596, 0.1127, 0.1067 and 0.0821 respectively, and in BCI were 0.0083, 0.0010, 0.0212 and 0.0279 respectively. Dots represent the geographic distance and topography joint fitting, the adjusted R2 from 10 m to 50 m grain size in GTS were 0.0667, 0.1211, 0.1478 and 0.1303, respectively, and in BCI were 0.0126, 0.0219, 0.0584 and 0.0890, respectively. P<0.001 for all the above fitting results.
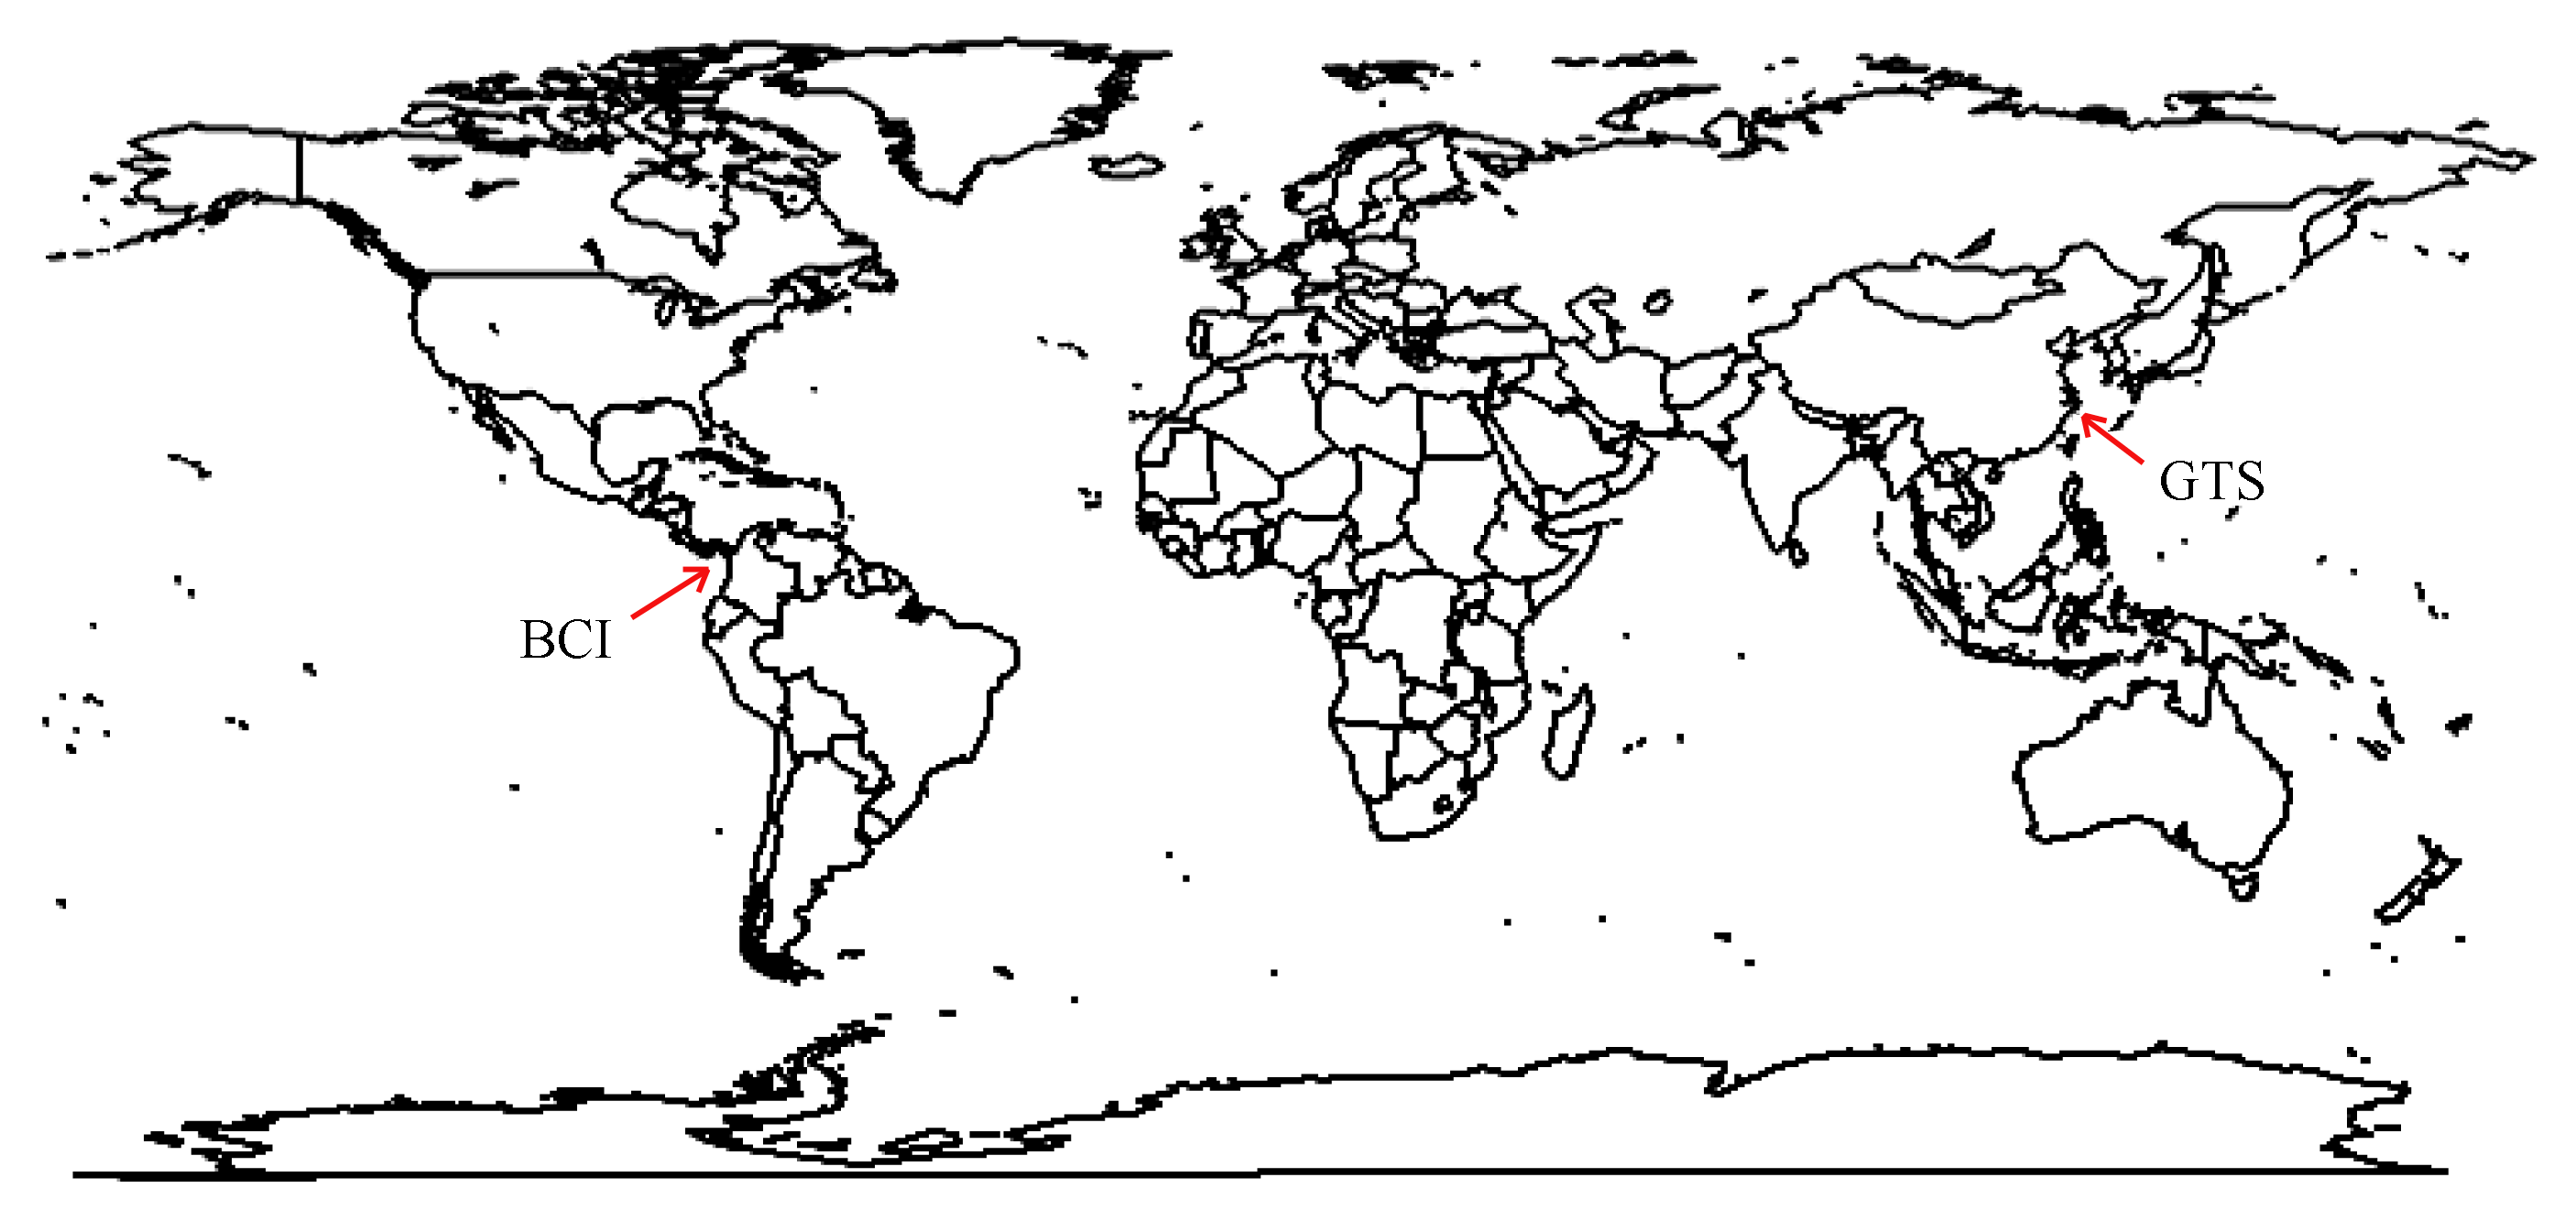
Appendix I World map showing the locations of the GTS plot and BCI plot
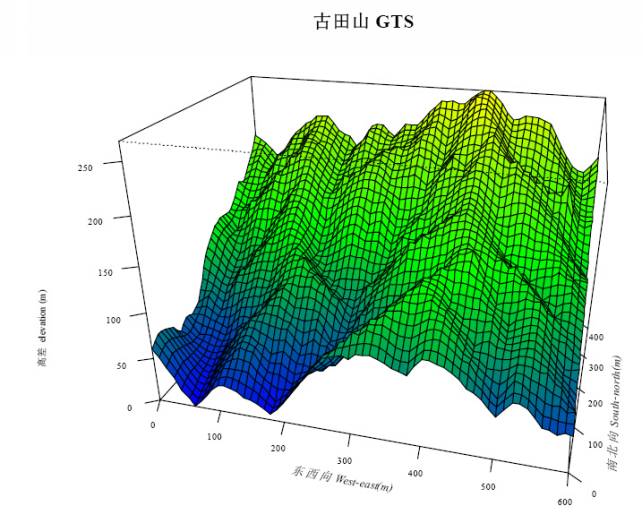
Appendix II Topographical map of the GTS plot
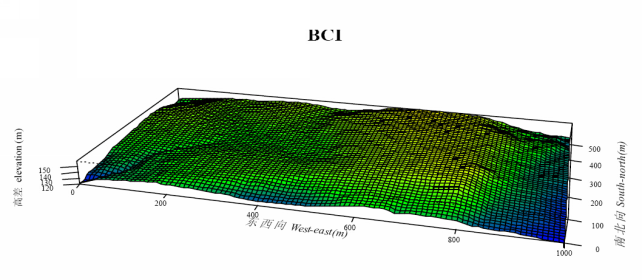
Appendix III Topographical map of the BCI plot
Appendix IV Linear regression fitting of the logged community similarity with geographical distance. a, BCI plot; b, Gutianshan plot; 1, 2, 3 and 4 represent grain size 10 m, 20 m, 40 m and 50 m respectively. BCI decay rate: -2.994×10⁻⁵/m, -1.295×10⁻⁴/m, -1.081×10⁻⁴/m and -1.073×10⁻⁴/m ; GTS decay rate: -1.152×10⁻⁴/m, -3.207×10⁻⁴/m, -2.345×10⁻⁴/m and -1.742×10⁻⁴/m .
| 1 | Bacaro G, Gioria M, Ricotta C (2012) Testing for differences in beta diversity from plot-to-plot dissimilarities.Ecological Research, 27, 285-292. |
| 2 | Borcard D, Legendre P (2002) Allscale spatial analysis of ecological data by means of principal coordinates of neighbour matrices.Ecological Monographs, 153, 51-68. |
| 3 | Chao AN, Chazdon RL, Colwell RK, Shen TJ (2005) A new statistical approach for assessing similarity of species composition with incidence and abundance data.Ecology Letters, 8, 148-159. |
| 4 | Chen B (陈彬), Mi XC (米湘成), Fang T (方腾), Chen L (陈磊), Ren HB (任海保), Ma KP (马克平) (2009) Gutianshan Forest in Zhejiang: Tree Species and Their Distribution Patterns (浙江古田山森林: 树种及其分布). China Forestry Publishing House, Beijing. (in Chinese) |
| 5 | Chen SB (陈圣宾), Ouyang ZY (欧阳志云), Xu WH (徐卫华), Xiao Y (肖燚) (2010) A review of beta diversity studies.Biodiversity Science(生物多样性), 18, 323-335. (in Chinese with English abstract) |
| 6 | Condit R (1998) Tropical Forest Census Plots: Methods and Results from Barro Colorado Island, Panama and Comparison with Other Plots. Springer, Berlin. |
| 7 | Condit R, Pitman N, Leigh EG Jr, Chave J, Terborgh J, Foster RB, Nunez P, Aguilar S, Valencia R, Villa G, Muller- Landau HC, Losos E, Hubbell SP (2002) Beta-diversity in tropical forest trees.Science, 295, 666-669. |
| 8 | Cottenie K (2005) Integrating environmental and spatial proce- sses in ecological community dynamics.Ecology Letters, 8, 1175-1182. |
| 9 | Cressie N (1990) The origins of Kriging.Mathematical Geology, 22, 239-252. |
| 10 | Croat TB (1978) Flora of Barro Colorado Island. Stanford University Press, Stanford. |
| 11 | DeCáceres M, Legendre P, Valencia R, Cao M, Chang LW, Chuyong G, Condit R, Hao ZQ, Hsieh CF, Hubbell S Kenfack D, Ma KP, Mi XC, Noor NMS, Kassim AR, Ren HB, Su SH, Sun IF, Thomas D, Ye WH, He FL (2012) The variation of tree beta diversity across a global network of forest plots.Global Ecology and Biography, 21, 1191-1202. |
| 12 | Diggle PJ, Tawn JA, Moyeed RA (1998) Model-based geostatistics.Journal of the Royal Statistical Society: Series C (Applied Statistics), 47, 299-350. |
| 13 | Gilbert B, Jechowicz MJ (2004) Neutrality, niches, and dispersal in a temperate forest understory. Proceedings of the National Academy of Sciences,USA, 101, 7651-7656. |
| 14 | Girdler EB, Barrie BTC (2008) The scale-dependent importance of habitat factors and dispersal limitation in structuring Great Lakes shoreline plant communities.Plant Ecology, 198, 211-223. |
| 15 | González-Megías A, Gómez JM, Sánchez-Piñero F (2007) Diversity-habitat heterogeneity relationship at different spatial and temporal scales.Ecography, 30, 31-41. |
| 16 | Harms KE, Condit R, Hubbell SP, Foster RB (2001) Habitat associations of trees and shrubs in a 50-ha neotropical forest plot.Journal of Ecology, 89, 947-959. |
| 17 | Hooper ER, Legendre P, Condit R (2004) Factors affecting community composition of forest regeneration in deforested, abandoned land in Panama.Ecology, 85, 3313-3326. |
| 18 | Hubbell SP (2001) The Unified Neutral Theory of Biodiversity and Biogeography. Princeton University Press, Princeton. |
| 19 | Laliberté E, Paquette A, Legendre P, Bouchard A (2009) Assessing the scale-specific importance of niches and other spatial processes on beta diversity: a case study from a temperate forest.Oecologia, 159, 377-388. |
| 20 | Legendre P, Legendre LFJ (1998) Numerical Ecology. Elsevier, Amsterdam. |
| 21 | Legendre P, Borcard D, Peres-Neto PR (2005) Analyzing beta diversity: partitioning the spatial variation of community composition data.Ecological Monographs, 75, 435-450. |
| 22 | Legendre P (2007) Studying beta diversity: ecological variation partitioning by multiple regression and canonical analysis.Journal of Plant Ecology(植物生态学报), 31, 976-981. (in Chinese with English abstract) |
| 23 | Legendre P, Mi XC, Ren HB, Ma KP, Yu MJ, Sun YF, He FL (2009) Partitioning beta diversity in a subtropical broad-leaved forest of China.Ecology, 90, 663-674. |
| 24 | Leigh EG, Rand AS, Windsor DM (1982) The Ecology of a Tropical Forest: Seasonal Rhythms and Long-Term Changes. Smithsonian Institution Press, Washington, DC. |
| 25 | MacArthur RH (1965) Patterns of species diversity.Biological Reviews, 40, 510-533. |
| 26 | Mantel N (1967) The detection of disease clustering and a generalized regression approach.Cancer Research, 27, 209-220. |
| 27 | Morlon H, Chuyong G, Condit R, Hubbell S, Kenfack D, Thomas D, Valencia R, Green JL (2008) A general framework for the distance-decay of similarity in ecological communities.Ecology Letters, 11, 904-917. |
| 28 | Myers JA, Chase JM, Jiménez I, Jørgensen PM, Araujo-Murakami A, Zambrana P, Seidel R (2012) Beta-diversity in temperate and tropical forests reflects dissimilar mechanisms of community assembly.Ecology Letters, 16, 151-157. |
| 29 | Nekola JC, White PS (1999) The distance decay of similarity in biogeography and ecology.Journal of Biogeography, 26, 867-878. |
| 30 | Oksanen J, Kindt R, Legendre P, O’Hara RB, Stevens MHH (2010) Vegan: Community Ecology Package. R package version 1, 17-2. () (2013, 4, 4) |
| 31 | Reed A, Peet RK, Palmer MW, White PS (1993) Scale dependence of vegetation-environment correlations: a case study of a North Carolina piedmont woodland.Journal of Vegetation Science, 4, 329-340. |
| 32 | Seidler TG, Plotkin JB (2006) Seed dispersal and spatial pattern in tropical trees.PLoS Biology, 4, 2132-2137. |
| 33 | Shen GC, Yu MJ, Hu XS, Mi XC, Ren HB, Sun YF, Ma KP (2009) Species-area relationships explained by the joint effects of dispersal limitation and habitat heterogeneity.Ecology, 90, 3033-3041. |
| 34 | Soininen J, Lennon JJ, Hillebrand H (2007) A multivariate analysis of beta diversity across organisms and environ- ments.Ecology, 88, 2830-2838. |
| 35 | Steinitz O, Heller J, Tsoar A, Rotem D, Kadmon R (2005) Predicting regional patterns of similarity in species composition for conservation planning.Conservation Biology, 19, 1978-1988. |
| 36 | Steinbauer MJ, Dolos K, Reineking B, Beierkuhnlein C (2012) Current measures for distance decay in similarity of species composition are influenced by study extent and grain size.Global Ecology and Biogeography, 21, 1203-1212. |
| 37 | Tang ZY, Fang JY, Chi XL, Yang YH, Ma WH, Mohhamot A, Guo ZD, Liu YN, Gaston KJ (2012) Geography, environment, and spatial turnover of species in China’s grasslands.Ecography, 35, 1103-1109. |
| 38 | Tuomisto H, Ruokolainen K, Yli-Halla M (2003) Dispersal, environment, and floristic variation of western Amazonian forests.Science, 299, 241-244. |
| 39 | Tuomisto H, Ruokolainen K (2006) Analyzing or explaining beta diversity? Understanding the targets of different methods of analysis.Ecology, 87, 2697-2708. |
| 40 | Valencia R, Foster RB, Villa G, Condit R, Svennings JC, Hernandez C, Romoleroux K, Losos E, Magards E, Balslev H (2004) Tree species distributions and local habitat variation in the Amazon: large forest plot in eastern Ecuador.Ecology, 92, 214-229. |
| 41 | Vellend M (2001) Do commonly used indices of β-diversity measure species turnover? Vegetation Science, 12, 545-552. |
| 42 | Whittaker RH (1956) Vegetation of the great smoky mountains.Ecological Monographs, 26, 1-80. |
| 43 | Whittaker RH (1960) Vegetation of the Siskiyou Mountains, Oregon and California.Ecological Monographs, 30, 279-338. |
| 44 | Whittaker RH (1972) Evolution and measurement of species diversity.Taxon, 21, 213-251. |
| [1] | Xiao-Qing Wu Meihui Zhang Suting Ge Manshu Li Kun Song Guochun Shen Jian Zhang. Spatiotemporal Dynamics of Woody Plant Species Diversity and Aboveground Biomass during Near-Natural Forest Reconstruction in Shanghai: A Case Study from the Eco-Island in Minhang District [J]. Biodiv Sci, 2025, 33(5): 24444-. |
| [2] | Yonghua Liu, Guangrong Tong, Hangyuan Yu, Ningning Wang, Haibao Ren, Lei Chen, Keping Ma, Xiangcheng Mi. Responses of canopy three-dimensional structural and spectral characteristics to anthropogenic disturbance in the Qianjiangyuan section of the Qianjiangyuan-Baishanzu National Park candidate area [J]. Biodiv Sci, 2025, 33(4): 24174-. |
| [3] | Chuan Jin, Zijia Zhang, Kai Di, Weirong Zhang, Dong Qiao, Siyuan Cheng, Zhongmin Hu. A dataset on fluorescence, photosynthesis gas exchange, and leaf traits of Hainan tropical rainforest plant species [J]. Biodiv Sci, 2024, 32(9): 24139-. |
| [4] | Yanyu Ai, Haixia Hu, Ting Shen, Yuxuan Mo, Jinhua Qi, Liang Song. Vascular epiphyte diversity and the correlation analysis with host tree characteristics: A case in a mid-mountain moist evergreen broad-leaved forest, Ailao Mountains [J]. Biodiv Sci, 2024, 32(5): 24072-. |
| [5] | Song Xiong, Jiang Gan, Yanjun Xie, Xizhao Deng, Guole Qin, Wanxia Peng, Fuping Zeng, Zhili Zhan, Weining Tan, Guoqin Huang, Hu Du. Dynamics of litter production and its determinants in a subtropical mixed evergreen and deciduous broad-leaved forest in a karst ecosystem [J]. Biodiv Sci, 2024, 32(12): 24248-. |
| [6] | Kailun Xu, Xiaorong Chen, Minhua Zhang, Wanwan Yu, Sumei Wu, Zhicheng Zhu, Dingyun Chen, Rongguang Lan, Shu Dong, Yu Liu. Succession and topography jointly influence the diversity of plant sexual systems in the Baishanzu forest community [J]. Biodiv Sci, 2024, 32(12): 24338-. |
| [7] | Shengwen Chen, Haibao Ren, Guangrong Tong, Ningning Wang, Wenchao Lan, Jianhua Xue, Xiangcheng Mi. Spatial patterns in woody species diversity in the Qianjiangyuan National Park [J]. Biodiv Sci, 2023, 31(7): 22587-. |
| [8] | Tingting Deng, Yan Wei, Siyuan Ren, Yan Zhu. Effects of topography and stand structure of warm temperate deciduous broad-leaved forest on understory herb diversity in Donglingshan, Beijing [J]. Biodiv Sci, 2023, 31(7): 22671-. |
| [9] | Chenyang Lou, Haibao Ren, Xiaonan Chen, Xiangcheng Mi, Ran Tong, Nianfu Zhu, Lei Chen, Tonggui Wu, Xiaoli Shen. Species and structural diversity of forest communities in Qianjiangyuan National Park and their impacts on the occurrence of black muntjac (Muntiacus crinifrons) [J]. Biodiv Sci, 2023, 31(6): 22518-. |
| [10] | Xing Chen, Shuwen Tu, Zun Dai, Shuang Gao, Youfang Wang, Shichen Xing, Bojia Wei, Luyan Tang, Ruiping Shi, Xiaorui Wang, Yongying Liu, Dongping Zhao, Xia Tang, Xue Yao, Mingshui Zhao, Hanxing Wu, Xiangbin Qi, Jian Zhang, Min Li, Jian Wang. Bryophytes diversity of Tianmushan National Nature Reserve, Zhejiang Province [J]. Biodiv Sci, 2023, 31(4): 22649-. |
| [11] | Yujie Xue, Anpeng Cheng, Shan Li, Xiaojuan Liu, Jingwen Li. The effects of environment and species diversity on shrub survival in subtropical forests [J]. Biodiv Sci, 2023, 31(3): 22443-. |
| [12] | Xiaofan Shang, Jian Zhang, Haojie Gao, Weipeng Ku, Yuke Bi, Xiupeng Li, Enrong Yan. Island area and climate jointly impact seed plant richness patterns across the Zhoushan Archipelago [J]. Biodiv Sci, 2023, 31(12): 23392-. |
| [13] | Wenjia Wu, Ye Yuan, Jing Zhang, Lixia Zhou, Jun Wang, Hai Ren, Zhanfeng Liu. Dynamics of soil nematode community during the succession of forests in southern subtropical China [J]. Biodiv Sci, 2022, 30(12): 22205-. |
| [14] | Run Zhou, Xiuqin Ci, Jianhua Xiao, Guanlong Cao, Jie Li. Effects and conservation assessment of climate change on the dominant group—The genusCinnamomum of subtropical evergreen broad-leaved forests [J]. Biodiv Sci, 2021, 29(6): 697-711. |
| [15] | Yumei Pan, Naili Zhang. Effects of tree diversity on enzyme activity in litter of a subtropical forest ecosystem [J]. Biodiv Sci, 2021, 29(11): 1447-1460. |
| Viewed | ||||||
|
Full text |
|
|||||
|
Abstract |
|
|||||
Copyright © 2022 Biodiversity Science
Editorial Office of Biodiversity Science, 20 Nanxincun, Xiangshan, Beijing 100093, China
Tel: 010-62836137, 62836665 E-mail: biodiversity@ibcas.ac.cn ![]()