

生物多样性 ›› 2018, Vol. 26 ›› Issue (2): 149-157. DOI: 10.17520/biods.2017196 cstr: 32101.14.biods.2017196
所属专题: 青藏高原生物多样性与生态安全
宋瑞玲1, 王昊1,*( ), 张迪1, 吕植1,2, 朱子云1,2, 张璐1, 刘炎林1,3, 才文公保2, 吴岚1
收稿日期:2017-07-04
接受日期:2018-01-18
出版日期:2018-02-20
发布日期:2018-05-05
通讯作者:
王昊
作者简介:# 共同第一作者
基金资助:
Ruiling Song1, Hao Wang1,*(), Di Zhang1, Zhi Lü1,2, Ziyun Zhu1,2, Lu Zhang1, Yanlin Liu1,3, gongbao Caiwen2, Lan Wu1
Received:2017-07-04
Accepted:2018-01-18
Online:2018-02-20
Published:2018-05-05
Contact:
Wang Hao
About author:# Co-first authors
摘要:
三江源是我国生态保护的优先区域。自2005年以来, 国家投入大量资金在三江源实施了一系列生态保护措施和工程, 主要目的之一是保护和恢复草地生态系统。本文基于中分辨率成像光谱仪(MODIS)增强型植被指数(EVI)数据和野外实测样方, 从草地生物量的角度评估了三江源工程的保护成效, 以期为后续的保护措施提供参考。本文使用2000-2016年间在青藏高原248个样地的实测地上生物量数据和同期的EVI数据, 比较了通过EVI估算草地地上生物量的不同建模方法, 并从中选择表现最佳的乘幂模型反演了三江源高寒草地的地上生物量, 用趋势分析法得出了生物量的变化。结果显示, 2000-2016年间, 三江源高寒草地地上生物量没有发生显著变化的面积占62%, 显著增加的地方主要在西部和北部, 占22%, 显著减少的地方则主要在中部和南部, 占16%; 2000-2016年间, 草地地上生物量的年际波动较大, 但总趋势不显著; 在2012年后, 地上生物量表现出显著降低的趋势。三江源国家级自然保护区外部的草地地上生物量高于内部, 使用匹配法比较保护区内外草地地上生物量变化的情况, 结果发现在生态保护工程实施的2005-2012年间, 三江源保护区内的草地生物量没有显著增加。
宋瑞玲, 王昊, 张迪, 吕植, 朱子云, 张璐, 刘炎林, 才文公保, 吴岚 (2018) 基于MODIS-EVI评估三江源高寒草地的保护成效. 生物多样性, 26, 149-157. DOI: 10.17520/biods.2017196.
Ruiling Song, Hao Wang, Di Zhang, Zhi Lü, Ziyun Zhu, Lu Zhang, Yanlin Liu, gongbao Caiwen, Lan Wu (2018) Conservation outcomes assessment of Sanjiangyuan alpine grassland with MODIS-EVI approach. Biodiversity Science, 26, 149-157. DOI: 10.17520/biods.2017196.
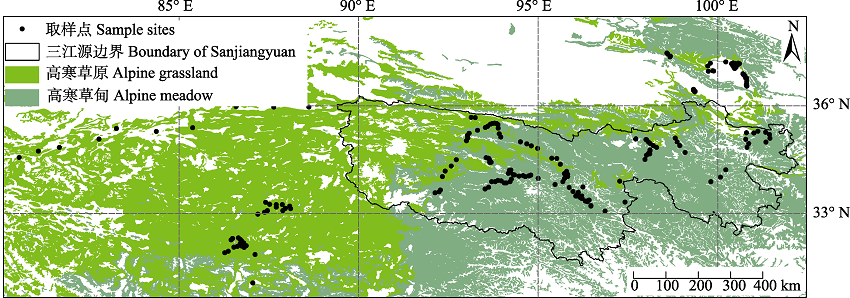
图1 高寒草甸和高寒草原野外实测地上生物量取样点的空间分布
Fig. 1 The locations of the aboveground biomass sample sites of the alpine meadow and alpine grassland
| 模型 Model | 拟合方程 Function | 决定系数R2 Coefficients of determination | Sig. | 平均误差系数 Mean error coefficients |
|---|---|---|---|---|
| 线性 Linear | Y = 376.571X - 17.075 | 0.606 | < 0.001 | 33.4% |
| 二次 Quadratic | Y = 163.385X2 + 280.199X - 6.634 | 0.609 | < 0.001 | 43.0% |
| 乘幂 Power | Y = 383.897X1.3 | 0.675 | < 0.001 | 24.3% |
| 指数 Exponential | Y = 11.977e5.653X | 0.611 | < 0.001 | 32.4% |
表1 据实测地上生物量与对应增强型植被指数(EVI)建立的4种回归模型(其中X为EVI, Y为地上生物量)
Table 1 The four regression models based on the measured aboveground biomass and the related enhanced vegetation index (EVI) (X = EVI; Y = aboveground biomass)
| 模型 Model | 拟合方程 Function | 决定系数R2 Coefficients of determination | Sig. | 平均误差系数 Mean error coefficients |
|---|---|---|---|---|
| 线性 Linear | Y = 376.571X - 17.075 | 0.606 | < 0.001 | 33.4% |
| 二次 Quadratic | Y = 163.385X2 + 280.199X - 6.634 | 0.609 | < 0.001 | 43.0% |
| 乘幂 Power | Y = 383.897X1.3 | 0.675 | < 0.001 | 24.3% |
| 指数 Exponential | Y = 11.977e5.653X | 0.611 | < 0.001 | 32.4% |
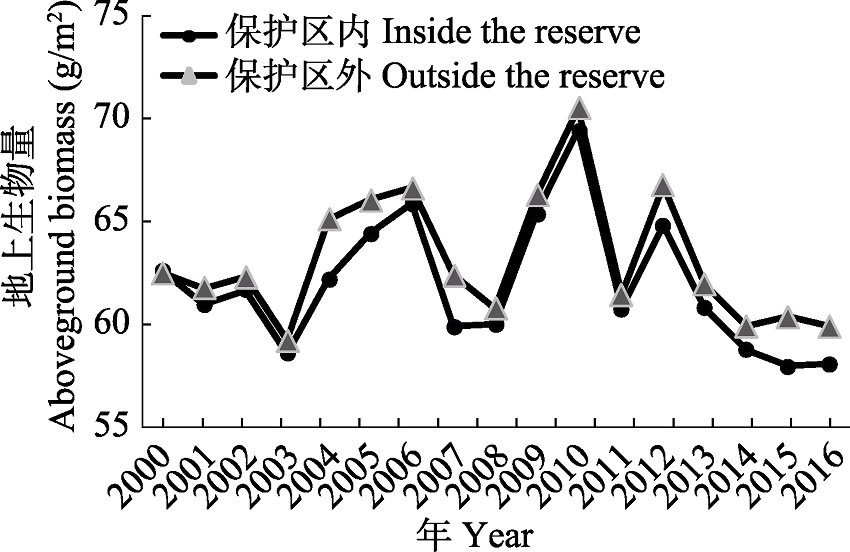
图2 2000-2016年三江源自然保护区内外生长季平均地上生物量的波动变化
Fig. 2 The fluctuations of the average aboveground biomass of the growing season inside and outside of Sanjiangyuan Nature Reserve (2000-2016)
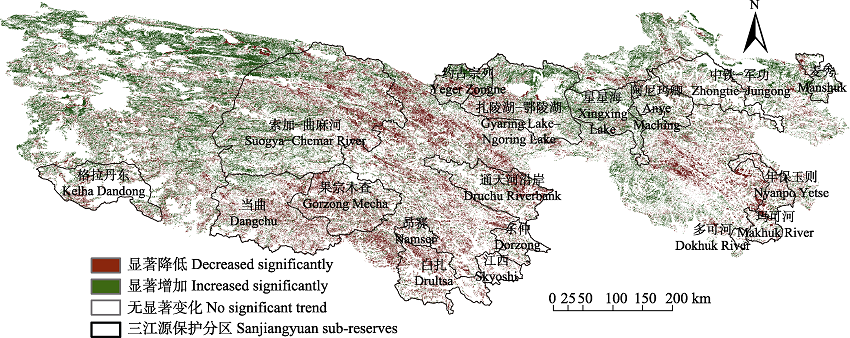
图3 2000-2016年三江源高寒草地生长季平均增强型植被指数(EVI)变化的空间分布
Fig. 3 The spatial pattern of the trend of average enhanced vegetation index (EVI) of the growing season from 2000 to 2016 in Sanjiangyuan Region
| 匹配前后 Before & after matching (BM & AM) | 统计值 Statistics | 海拔 Elevation (m) | 坡度 Slope (°) | 草地类型(高寒草甸/高寒草原) Grassland type (Alpine meadow/ Alpine steppe) | 人口密度(人/km2) Population density (per km2) |
|---|---|---|---|---|---|
| 匹配前 BM | 均值 Mean (内/外 Inside/Outside) | 4,567.200 /4,414.500 | 10.911/12.770 | 1.129/1.092 | 0.799/2.782 |
| 匹配后 AM | 均值 Mean (内/外 Inside/Outside) | 4,566.700 /4,572.500 | 10.914/11.085 | 1.129/1.120 | 0.799/1.752 |
| 匹配前 BM | 标准化均数差 Standardized mean difference | 49.409 | -19.899 | 11.040 | -9.659 |
| 匹配后 AM | 标准化均数差 Standardized mean difference | -1.894 | -1.833 | 2.453 | -4.639 |
表2 匹配后处理组(三江源保护区内)与对照组(保护区外)在4种协变量上的差距缩小
Table 2 The differences of the 4 covariates inside and outside of Sanjiangyuan Nature Reserve were smaller after matching
| 匹配前后 Before & after matching (BM & AM) | 统计值 Statistics | 海拔 Elevation (m) | 坡度 Slope (°) | 草地类型(高寒草甸/高寒草原) Grassland type (Alpine meadow/ Alpine steppe) | 人口密度(人/km2) Population density (per km2) |
|---|---|---|---|---|---|
| 匹配前 BM | 均值 Mean (内/外 Inside/Outside) | 4,567.200 /4,414.500 | 10.911/12.770 | 1.129/1.092 | 0.799/2.782 |
| 匹配后 AM | 均值 Mean (内/外 Inside/Outside) | 4,566.700 /4,572.500 | 10.914/11.085 | 1.129/1.120 | 0.799/1.752 |
| 匹配前 BM | 标准化均数差 Standardized mean difference | 49.409 | -19.899 | 11.040 | -9.659 |
| 匹配后 AM | 标准化均数差 Standardized mean difference | -1.894 | -1.833 | 2.453 | -4.639 |
| 序号 No. | 评估对象(处理组/对照组) Items(treatment /control) | ATT | t | P-value |
|---|---|---|---|---|
| 1 | 保护区内/外 Inside/outside of NR | -158.170 | -4.7394 | 0.000** |
| 2 | 保护区内/外(去除10 km 缓冲区) Inside/outside (without 10 km buffer) of NR | -126.700 | -3.030 | 0.002** |
| 3 | 保护区内/外5 km缓冲区 5 km buffer inside and outside the border of NR | -211.200 | -5.755 | 0.000** |
| 4 | 保护区核心区 Core areas of NR | -185.410 | -5.668 | 0.000** |
表3 三江源保护区内外地上生物量年均变化率的处理组平均处理效应(ATT)和配对t检验结果
Table 3 Results of the average treatment effect on the treated (ATT) and paired-samples t-test of aboveground biomass change rate inside and outside of Sanjiangyuan Nature Reserve (NR)
| 序号 No. | 评估对象(处理组/对照组) Items(treatment /control) | ATT | t | P-value |
|---|---|---|---|---|
| 1 | 保护区内/外 Inside/outside of NR | -158.170 | -4.7394 | 0.000** |
| 2 | 保护区内/外(去除10 km 缓冲区) Inside/outside (without 10 km buffer) of NR | -126.700 | -3.030 | 0.002** |
| 3 | 保护区内/外5 km缓冲区 5 km buffer inside and outside the border of NR | -211.200 | -5.755 | 0.000** |
| 4 | 保护区核心区 Core areas of NR | -185.410 | -5.668 | 0.000** |
| 序号 No. | 保护分区 Sub-reserves | ATT | t | P-value |
|---|---|---|---|---|
| 1 | 格拉丹东 Kelha Dandong | -119.880 | -0.777 | 0.436 |
| 2 | 麦秀 Manshuk | -139.200 | -0.770 | 0.442 |
| 3 | 果宗木查 Gorzong Mecha | 295.070 | 8.240 | 0.000** |
| 4 | 当曲 Dangchu | -259.300 | -9.970 | 0.000** |
| 5 | 索加-曲麻河 Suogya-Chemar River | 94.364 | 3.438 | 0.001** |
| 6 | 多可河 Dokhuk River | -198.440 | -0.600 | 0.548 |
| 7 | 玛可河 Makhuk River | 587.030 | 3.740 | 0.000** |
| 8 | 年保玉则 Nyanpo Yetse | 540.270 | 5.380 | 0.000** |
| 9 | 约古宗列 Yeger Zongne | -309.160 | -7.644 | 0.000** |
| 10 | 扎陵湖-鄂陵湖 Gyaring Lake-Ngoring Lake | -777.280 | -19.414 | 0.000** |
| 11 | 星星海 Xingxing Lake | -1695.200 | -29.040 | 0.000** |
| 12 | 阿尼玛卿 Anye Maching | -584.970 | -8.290 | 0.000** |
| 13 | 中铁-军功 Zhongtie-Jungong | -612.480 | -7.840 | 0.000** |
| 14 | 通天河沿岸 Druchu Riverbank | 609.100 | 8.250 | 0.000** |
| 15 | 东仲 Dorzong | -568.930 | -4.140 | 0.000** |
| 16 | 江西 Skyoshi | -966.400 | -5.270 | 0.000** |
| 17 | 白扎 Drultsa | -285.800 | -4.670 | 0.000** |
| 18 | 昂赛 Namser | -755.750 | -5.510 | 0.000** |
表4 18个保护分区的草地地上生物量年均变化率的处理组平均处理效应(ATT)和配对t检验结果
Table 4 Results of the average treatment effect on the treated (ATT) of aboveground biomass change rate inside and outside of 18 sub-reserves
| 序号 No. | 保护分区 Sub-reserves | ATT | t | P-value |
|---|---|---|---|---|
| 1 | 格拉丹东 Kelha Dandong | -119.880 | -0.777 | 0.436 |
| 2 | 麦秀 Manshuk | -139.200 | -0.770 | 0.442 |
| 3 | 果宗木查 Gorzong Mecha | 295.070 | 8.240 | 0.000** |
| 4 | 当曲 Dangchu | -259.300 | -9.970 | 0.000** |
| 5 | 索加-曲麻河 Suogya-Chemar River | 94.364 | 3.438 | 0.001** |
| 6 | 多可河 Dokhuk River | -198.440 | -0.600 | 0.548 |
| 7 | 玛可河 Makhuk River | 587.030 | 3.740 | 0.000** |
| 8 | 年保玉则 Nyanpo Yetse | 540.270 | 5.380 | 0.000** |
| 9 | 约古宗列 Yeger Zongne | -309.160 | -7.644 | 0.000** |
| 10 | 扎陵湖-鄂陵湖 Gyaring Lake-Ngoring Lake | -777.280 | -19.414 | 0.000** |
| 11 | 星星海 Xingxing Lake | -1695.200 | -29.040 | 0.000** |
| 12 | 阿尼玛卿 Anye Maching | -584.970 | -8.290 | 0.000** |
| 13 | 中铁-军功 Zhongtie-Jungong | -612.480 | -7.840 | 0.000** |
| 14 | 通天河沿岸 Druchu Riverbank | 609.100 | 8.250 | 0.000** |
| 15 | 东仲 Dorzong | -568.930 | -4.140 | 0.000** |
| 16 | 江西 Skyoshi | -966.400 | -5.270 | 0.000** |
| 17 | 白扎 Drultsa | -285.800 | -4.670 | 0.000** |
| 18 | 昂赛 Namser | -755.750 | -5.510 | 0.000** |
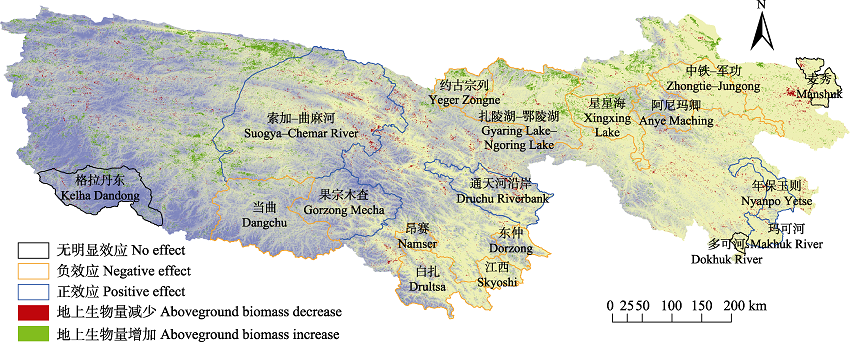
图4 一期工程期间(2005-2012)三江源生长季平均地上生物量变化的空间分布及各保护分区成效示意图
Fig. 4 The spatial pattern of the trend of average biomass of growing season during the first-stage projects period (2005-2012) in Sanjiangyuan and the protection effectiveness in each sub-reserve
| [1] | Andam KS, Ferraro PJ, Pfaff A, Sanchez-Azofeifa GA, Robalino JA (2008) Measuring the effectiveness of protected area networks in reducing deforestation. Proceedings of the National Academy of Sciences, USA, 105, 16089-16094. |
| [2] | Chen B, Liu FZ, Zhang YB, Du JH, Wang W, Li JS (2017) Assessment of forest conservation in the Cangshan Nature Reserve based on propensity score matching. Biodiversity Science, 25, 999-1007. (in Chinese with English abstract) |
| [陈冰, 刘方正, 张玉波, 杜金鸿, 王伟, 李俊生 (2017) 基于倾向评分配比法评估苍山自然保护区的森林保护成效. 生物多样性, 25, 999-1007.] | |
| [3] | Chu D, Deji YZ, Ji QM, Tang H (2013) Aboveground biomass estimate methods for typical grassland types in the Tibetan Plateau. Remote Sensing for Land and Resources, 25(3), 43-50. (in Chinese with English abstract) |
| [除多, 德吉央宗, 姬秋梅, 唐红 (2013) 西藏高原典型草地地上生物量遥感估算. 国土资源遥感, 25(3), 43-50.] | |
| [4] | Clements T, Suon S, Wilkie DS, Milner-Gulland EJ (2014) Impacts of protected areas on local livelihoods in Cambodia. World Development, 64, S125-S134. |
| [5] | Eisfelder C, Kuenzer C, Dech S (2012) Derivation of biomass information for semi-arid areas using remote-sensing data. International Journal of Remote Sensing, 33, 2937-2984. |
| [6] | Fan JW, Shao QQ, Liu JY, Wang JB, Harris W, Chen ZQ, Zhong HP, Xu XL, Liu RG (2010) Assessment of effects of climate change and grazing activity on grassland yield in the Three Rivers Headwaters Region of Qinghai-Tibet Plateau, China. Environmental Monitoring and Assessment, 170, 571-584. |
| [7] | Gu L, Wen C, Luo M, Wang H, Lü Z (2015) A rapid approach for assessing the conservation effectiveness of the most concerned endangered species in China. Biodiversity Science, 23, 583-590. (in Chinese with English abstract) |
| [顾垒, 闻丞, 罗玫, 王昊, 吕植 (2015) 中国最受关注濒危物种保护现状快速评价的新方法探讨. 生物多样性, 23, 583-590.] | |
| [8] | Greenwood E (1945) Experimental Sociology:A Study in Method. King’s Crown Press, New York. |
| [9] | Harris RB (2010) Rangeland degradation on the Qinghai- Tibetan Plateau: A review of the evidence of its magnitude and causes. Journal of Arid Environments, 74, 1-12. |
| [10] | Ho DE, Imai K, King G, Stuart EA (2007) Matching as nonparametric preprocessing for reducing model dependence in parametric causal inference. Political analysis, 15, 199-236. |
| [11] | Joppa LN, Pfaff A (2011) Global protected area impacts. Proceedings of the Royal Society B: Biological Sciences, 278, 1633-1638. |
| [12] | Lehnert LW, Wesche K, Trachte K, Reudenbach C, Bendix J (2016) Climate variability rather than overstocking causes recent large scale cover changes of Tibetan pastures. Scientific Reports, 6, 24367. |
| [13] | Li C, Xiao JD, Cao ZZ, Shi Y, Yang ZH (2007) Application of MODIS data in remote sensing estimation of prairie biomass in different seasons. Arid Zone Research, 24, 386-391. (in Chinese with English abstract) |
| [李聪, 肖继东, 曹占洲, 石玉, 杨志华 (2007) 应用MODIS数据估算草地生物量. 干旱区研究, 24, 386-391.] | |
| [14] | Liu MC, Li DQ, Wen YM (2005) The protection of biological diversity in the Sanjiangyuan Nature Reserve. JournaI of Arid Land Resources and Environment, 19(4), 49-53. (in Chinese with English abstract) |
| [刘敏超, 李迪强, 温琰茂 (2005) 论三江源自然保护区生物多样性保护. 干旱区资源与环境, 19(4), 49-53.] | |
| [15] | Long Y, Zhou L, Liu W, Zhou HK (2010) Using remote sensing and GIS technologies to estimate grass yield and livestock carrying capacity of alpine grasslands in Golog Prefecture, China. Pedosphere, 20, 342-351. |
| [16] | Rubin DB (1974) Estimating causal effects of treatment in randomized and nonrandomized studies. Journal of Educational Psychology, 66, 688-701. |
| [17] | Rosenbaum PR, Rubin DB (1983) The central role of the propensity score in observational studies for causal effects. Biometrika, 70, 41-55. |
| [18] | Sekhon JS (2011) Multivariate and propensity score matching software with automated balance optimization: The matching package for R. Journal of Statistical Software, 42(7), 52. |
| [19] | Shao QQ, Fan JW (2012) Integrated Monitoring and Assessment of Ecosystem in Sanjiangyuan Region. Science Press, Beijing. (in Chinese) |
| [邵全琴, 樊江文 (2012) 三江源区生态系统综合监测与评估. 科学出版社, 北京.] | |
| [20] | Shao QQ, Fan JW, Liu JY, Huang L, Cao W, Xu XL, Ge JS, Wu D, Li ZQ, Gong GL, Nie XM, He T, Wang LY, Bing LF, Li QJ, Chen ZQ, Zhang GQ, Zhang LX, Yang YS, Yang F, Zhou WF, Liu LL, Qi YG, Zhao GS, Li YZ (2016) Assessment on the effects of the first-stage ecological conservation and restoration project in Sanjiangyuan Region. Acta Geographica Sinica, 71, 3-20. (in Chinese with English abstract) |
| [邵全琴, 樊江文, 刘纪远, 黄麟, 曹巍, 徐新良, 葛劲松, 吴丹, 李志强, 巩国丽, 聂学敏, 贺添, 王立亚, 邴龙飞, 李其江, 陈卓奇, 张更权, 张良侠, 杨永顺, 杨帆, 周万福, 刘璐璐, 祁永刚, 赵国松, 李愈哲 (2016) 三江源生态保护和建设一期工程生态成效评估. 地理学报, 71, 3-20.] | |
| [21] | Su J, Aryal A, Nan Z, Ji W (2015) Climate change-induced range expansion of a subterranean rodent: Implications for rangeland management in Qinghai-Tibetan Plateau. PLoS ONE, 10, e0138969. |
| [22] | Sun QL, Li BL, Xu LL, Zhang T, Ge JS, Li F (2016) Analysis of NDVI change trend and its impact factors in the Three-River Headwater Region from 2000 to 2013. Journal of Geoinformation Science, 18, 1707-1716. (in Chinese with English abstract) |
| [孙庆龄, 李宝林, 许丽丽, 张涛, 葛劲松, 李飞 (2016) 2000-2013年三江源植被NDVI变化趋势及影响因素分析. 地球信息科学学报, 18, 1707-1716.] | |
| [23] | Wang W, Xin LJ, Du JH, Chen B, Liu FZ, Zhang LB, Li JS (2016) Evaluating conservation effectiveness of protected areas: Advances and new perspectives. Biodiversity Science, 24, 1177-1188. (in Chinese with English abstract) |
| [王伟, 辛利娟, 杜金鸿, 陈冰, 刘方正, 张立博, 李俊生 (2016) 自然保护地保护成效评估: 进展与展望. 生物多样性, 24, 1177-1188.] | |
| [24] | Wang JB, Liu JY, Shao QQ, Liu RG, Fan JW, Chen ZQ (2009) Spatial-temporal patterns of net primary productivity for 1988-2004 based on GLOPEM-CEVSA model in the “Three-River Headwaters” Region of Qinghai Province, China. Chinese Journal of Plant Ecology, 33, 254-269. (in Chinese with English abstract) |
| [王军邦, 刘纪远, 邵全琴, 刘荣高, 樊江文, 陈卓奇 (2009) 基于遥感-过程耦合模型的1988-2004年青海三江源区净初级生产力模拟. 植物生态学报, 33, 254-269.] | |
| [25] | Wen XX, Du ZC (2015) Survey on matching method: Theory and applications. Statistical Research, 32(4), 104-112. (in Chinese with English abstract) |
| [温兴祥, 杜在超 (2015) 匹配法综述: 方法与应用. 统计研究, 32(4), 104-112.] | |
| [26] | Wu L, Wang H (2017) Poisoning the pika: Must protection of grasslands be at the expense of biodiversity? Science China Life Science, 60, 545-547. |
| [27] | Xiao T, Wang CZ, Feng M, Qu R, Zhai J (2014) Dynamic characteristic of vegetation coverage in the Three-River Source Region from 2000 to 2011. Acta Agrestia Sinica, 22(1), 39-45. (in Chinese with English abstract) |
| [肖桐, 王昌佐, 冯敏, 屈冉, 翟俊 (2014) 2000-2011年青海三江源地区草地覆盖度的动态变化特征. 草地学报, 22(1), 39-45.] | |
| [28] | Xu XL, Liu JY, Shao QQ, Fan JW (2008) The dynamic changes of ecosystem spatial pattern and structure in the Three-River Headwaters region in Qinghai Province during recent 30 years. Geographical Research, 27, 829-838, 974. (in Chinese with English abstract) |
| [徐新良, 刘纪远, 邵全琴, 樊江文 (2008) 30年来青海三江源生态系统格局和空间结构动态变化. 地理研究, 27, 829-838, 974.] | |
| [29] | Yu X, Wang H, Li C, Wang YC (2011) Assessment of vegetation cover change in the Argun basin based on MODIS/EVI. Journal of China Institute of Water Resources and Hydropower Research, 9(2), 110-115. (in Chinese with English abstract) |
| [余晓, 王昊, 李翀, 王义成 (2011) 基于MODIS/EVI的额尔古纳河流域植被变化分析. 中国水利水电科学研究院学报, 9(2), 110-115.] | |
| [30] | Zhang JP, Liu CL, Hao HG, Sun L, Qiao Q, Wang H, Ning YC (2015) Spatial-temporal change of carbon storage and carbon sink of grassland ecosystem in the Three-River Headwaters Region based on MODIS GPP/NPP data. Ecology and Environmental Sciences, 24, 8-13. |
| (in Chinese with English abstract) [张继平, 刘春兰, 郝海广, 孙莉, 乔青, 王辉, 宁杨翠 (2015) 基于 MODIS GPP/NPP 数据的三江源地区草地生态系统碳储量及碳汇量时空变化研究. 生态环境学报, 24, 8-13.] | |
| [31] | Zhang L, Wylie B, Loveland T, Fosnight E, Tieszen LL, Ji L, Gilmanov T (2007) Evaluation and comparison of gross primary production estimates for the Northern Great Plains Grasslands. Remote Sensing of Environment, 106, 173-189. |
| [32] | Zhao M, Heinsch FA, Nemani RR, Running SW (2005) Improvements of the MODIS terrestrial gross and net primary production global data set. Remote Sensing of Environment, 95, 164-176. |
| [1] | 张同, 梁力文, 王长剑, 舒服, 王璐, 郭泽光, 卓玛曲珍, 钱芊, 蒋安莉, 敖俊杰, 彭兴文, 伍小刚, 向左甫, 郭克疾, 廖梓延. 基于红外相机的西藏芒康滇金丝猴国家级自然保护区鸟兽多样性及代表性物种的季节性空间利用特征[J]. 生物多样性, 2026, 34(4): 25435-. |
| [2] | 周铝, 姚世贸, 赵战合, 郭画, 田成. 庞泉沟国家级自然保护区狍和野猪时空共存格局[J]. 生物多样性, 2026, 34(2): 25327-. |
| [3] | 黎明, 秦响玲, 朱玉茹, 熊文. 自然保护区生物多样性抵消价值实现的理论框架与运行机制[J]. 生物多样性, 2026, 34(1): 25241-. |
| [4] | 岳可欣, 牛钟辉, 刘念, 徐琳, 吕韦韦, 徐茂宏, 崔绍朋. 山西历山三种同域分布食肉动物昼夜活动节律及与月光周期的关系[J]. 生物多样性, 2025, 33(9): 25084-. |
| [5] | 于琦胧, 郝珉辉, 何怀江, 张春雨, 赵秀海. 长白山森林不同演替阶段生物多样性与生产力的关系: 基于物种、性状和系统发育的视角[J]. 生物多样性, 2025, 33(8): 25060-. |
| [6] | 田书荣, 魏营, 肖芬, 周芸芸, 解宜兴, 王丞, 宋芬, 梁志强, 桂小杰. 湖南张家界大鲵国家级自然保护区中国大鲵种群动态及保护策略[J]. 生物多样性, 2025, 33(7): 24581-. |
| [7] | 徐进博, 崔雅倩, 王渊, 王伟波, 刘锋, 王广龙, 扈晶晶, 普布顿珠, 边巴多吉, 旦增, 胡开, 王小川, 宋刚, 吕永磊, 温知新. 西藏雅鲁藏布大峡谷国家级自然保护区内白颊猕猴的栖息地适宜性评价[J]. 生物多样性, 2025, 33(7): 24493-. |
| [8] | 毛静, 王婧, 黄杰, 熊姝红, 张自亮, 张佑祥, 吴涛. 湖南高望界国家级自然保护区2021-2023年鸟兽多样性监测数据集[J]. 生物多样性, 2025, 33(6): 24489-. |
| [9] | 彭文, 邓泽帅, 郑文宝, 龚凌轩, 曾玉枫, 孟昊, 陈军, 杨道德. eDNA技术在两栖动物调查中的应用: 以湖南莽山国家级自然保护区为例[J]. 生物多样性, 2025, 33(6): 24552-. |
| [10] | 吴晓晴, 张美惠, 葛苏婷, 李漫淑, 达良俊, 宋坤, 沈国春, 张健. 上海近自然林重建过程中木本植物物种多样性与地上生物量的时空动态: 以闵行区生态岛为例[J]. 生物多样性, 2025, 33(5): 24444-. |
| [11] | 张晶晶, 黄文彬, 陈奕廷, 杨泽鹏, 柯伟业, 彭昭杰, 魏世超, 张志伟, 胡怡思, 余文华, 周文良. 广东南澎列岛海洋生态国家级自然保护区造礁石珊瑚多样性及分布特征[J]. 生物多样性, 2025, 33(4): 24424-. |
| [12] | 吴昱萱, 王平, 胡晓生, 丁一, 彭甜恬, 植秋滢, 巴德木其其格, 李文杰, 关潇, 李俊生. 呼伦贝尔草地退化现状评估与植被特征变化[J]. 生物多样性, 2025, 33(2): 24118-. |
| [13] | 林雅莉, 林舒云, 廖凌云, 张玮仪, 陈大樑, 兰思仁, 尹伟伦. 《昆蒙框架》背景下自然保护地管理有效性评估演化趋势与启示[J]. 生物多样性, 2025, 33(12): 25260-. |
| [14] | 洪子辰, 杨源广, 黄鑫豪, 王孜, 郑笑, 周旭, 周艳, 陈世品, 林文俊. 武夷山国家公园常绿阔叶林生物量变化及其影响因素[J]. 生物多样性, 2025, 33(11): 25181-. |
| [15] | 李菡, 董伟, 陆江涛, 吴永杰, 何兴成, 刘林, 木留里哈, 张学林. 四川省甘洛县马鞍山省级自然保护区及周边地区红外相机鸟兽监测数据集[J]. 生物多样性, 2025, 33(10): 25165-. |
| 阅读次数 | ||||||
|
全文 |
|
|||||
|
摘要 |
|
|||||
备案号:京ICP备16067583号-7
Copyright © 2026 版权所有 《生物多样性》编辑部
地址: 北京香山南辛村20号, 邮编:100093
电话: 010-62836137, 62836665 E-mail: biodiversity@ibcas.ac.cn
