
生物多样性 ›› 2026, Vol. 34 ›› Issue (1): 25278. DOI: 10.17520/biods.2025278 cstr: 32101.14.biods.2025278
邹怡*( )(
)( )
)
收稿日期:2025-07-18
接受日期:2025-09-17
出版日期:2026-01-20
发布日期:2026-01-21
通讯作者:
邹怡
Yi Zou*()()
Received:2025-07-18
Accepted:2025-09-17
Online:2026-01-20
Published:2026-01-21
Contact:
Yi Zou
摘要:
采样不均衡是群落生态学实地调查的普遍问题。如何选择合适的α多样性度量指标, 使其在样点间样本量差异下有稳定的表现对于生物多样性研究十分重要。本文通过模拟群落的方法, 评估了9个α多样性度量指标的表现, 包含5个直接计算的“观测型指数”: (1)物种丰富度, (2) Shannon指数, (3) Simpson指数, (4) Hurlbert稀释物种数, (5) Fisher’s α指数, 以及4个估算丰富度的“估算型指数”: (1) Chao1指数, (2)基于丰度的覆盖估计值(abundance-based coverage estimator, ACE), (3) iNEXT (interpolation/extrapolation)外推值, (4)总预期物种数(total expected species, TES)。模拟评估了各个指数在不同的采样阈值下, 其样点间的方差被环境梯度解释力(线性模型R2)的准确性与精确性。模拟构建了20个样点的虚拟群落, 假设真实物种数S与环境梯度x呈线性关系且理论R2为0.8, 然后生成一系列梯度下, 不同最小采样阈值模拟的不等量采样场景, 并计算各指数与x的线性回归R2。结果显示, 采样强度(样点记录到的个体数及与之等价的采样完整度)是决定指数有效性的首要因素。随着样本量的提升, 所有α多样性度量指标的模型R2显著提升。在极低采样场景下(样点中最低样本量低于20个个体, 采样完整度 < 20%), 稀释物种数的平均R2明显优于其余指数; 最低样本量升至100个个体后, 估算型指数整体优于观测型指数。本研究进一步明确了各个指数恢复设定R2所需要的最小样本量及对应的采样完整度。综合来看, 在样本极少的不等量采样场景中, 优先推荐采用稀释物种数。在实际研究中, 应将稀释值设定在一个相对较高的水平(如 > 40个个体), 即使因此丢弃极端不足的样点, 也能在总体上提高样点间的可比性。当样本量充足时, 可采用物种丰富度估算指数, 以获得最接近真实梯度的丰富度外推值。
邹怡 (2026) α多样性指数选择: 不等量采样下的模拟比较. 生物多样性, 34, 25278. DOI: 10.17520/biods.2025278.
Yi Zou (2026) Alpha-diversity index selection: Simulation comparison under unequal sampling. Biodiversity Science, 34, 25278. DOI: 10.17520/biods.2025278.
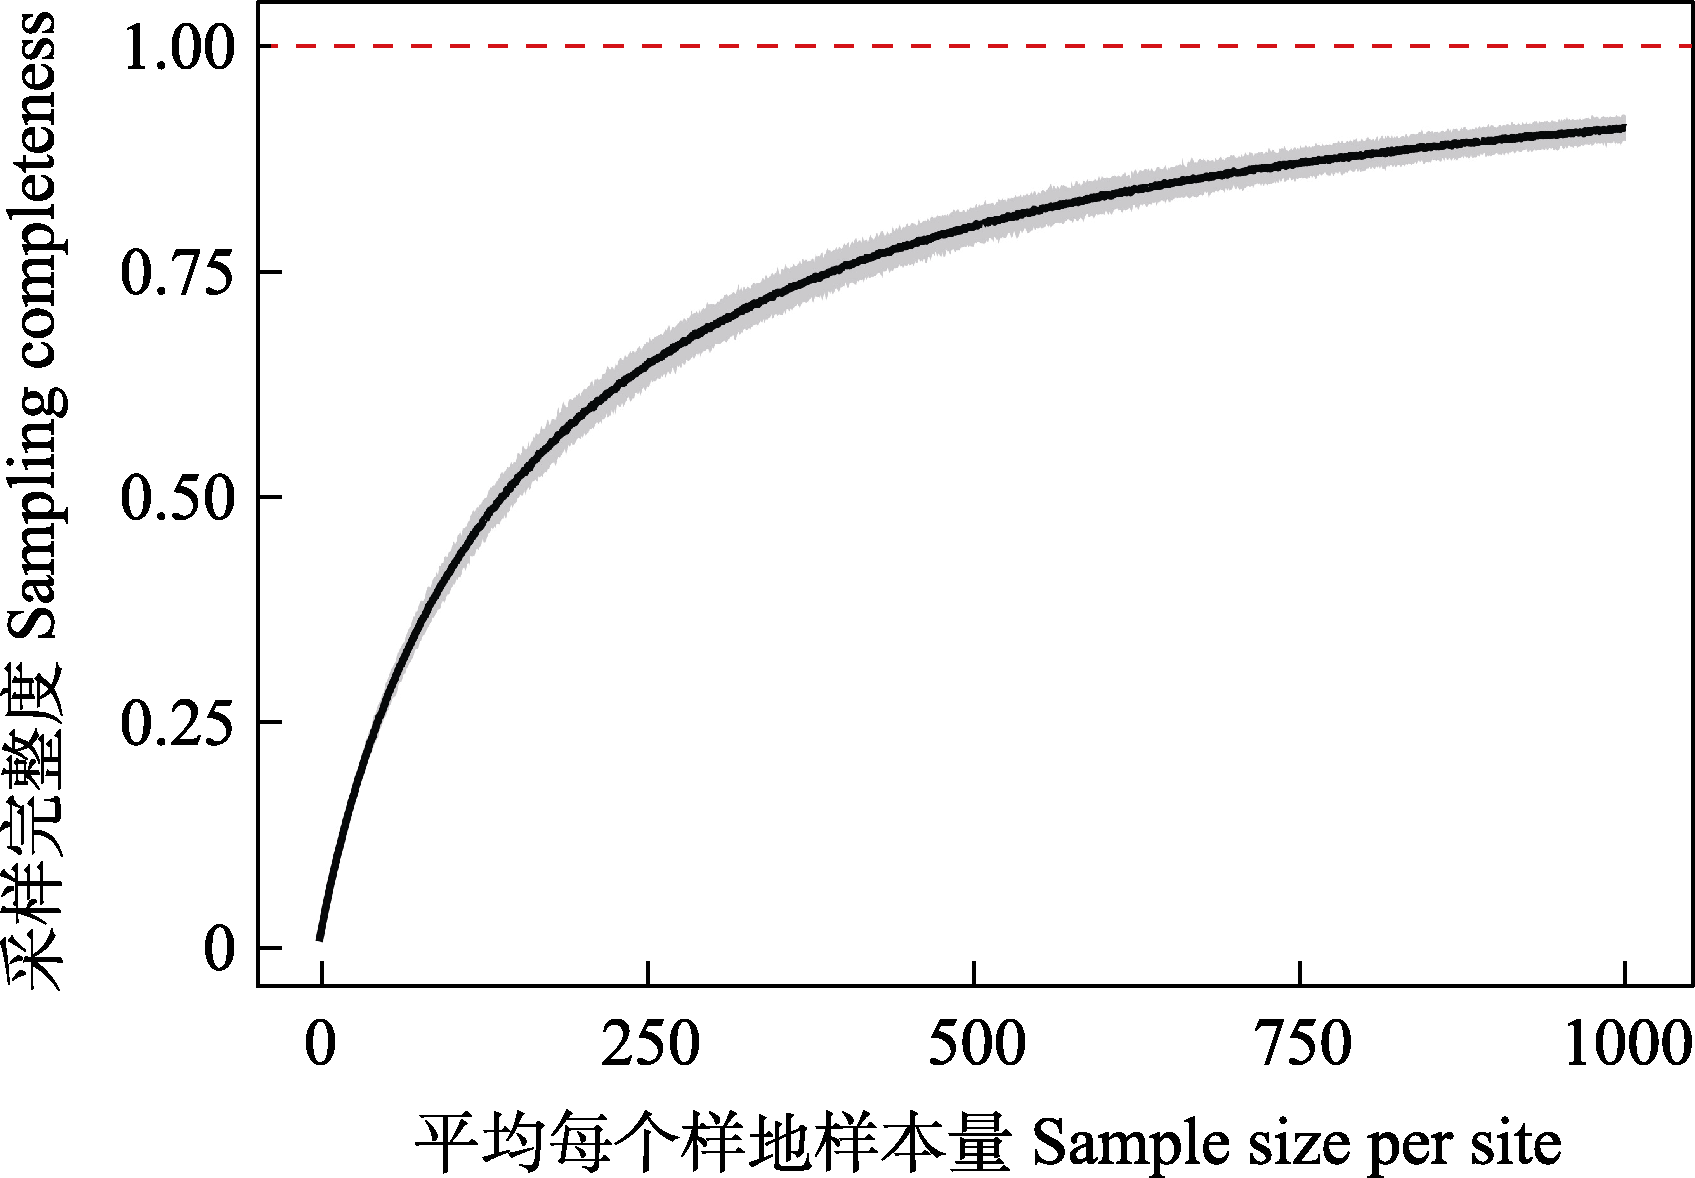
图1 平均每个样地的样本量与采样完整度的关系。阴影部分表示95%置信区间。
Fig. 1 Relationship between sample size per site and the sampling completeness. Shade area refers to the 95% confidence interval.
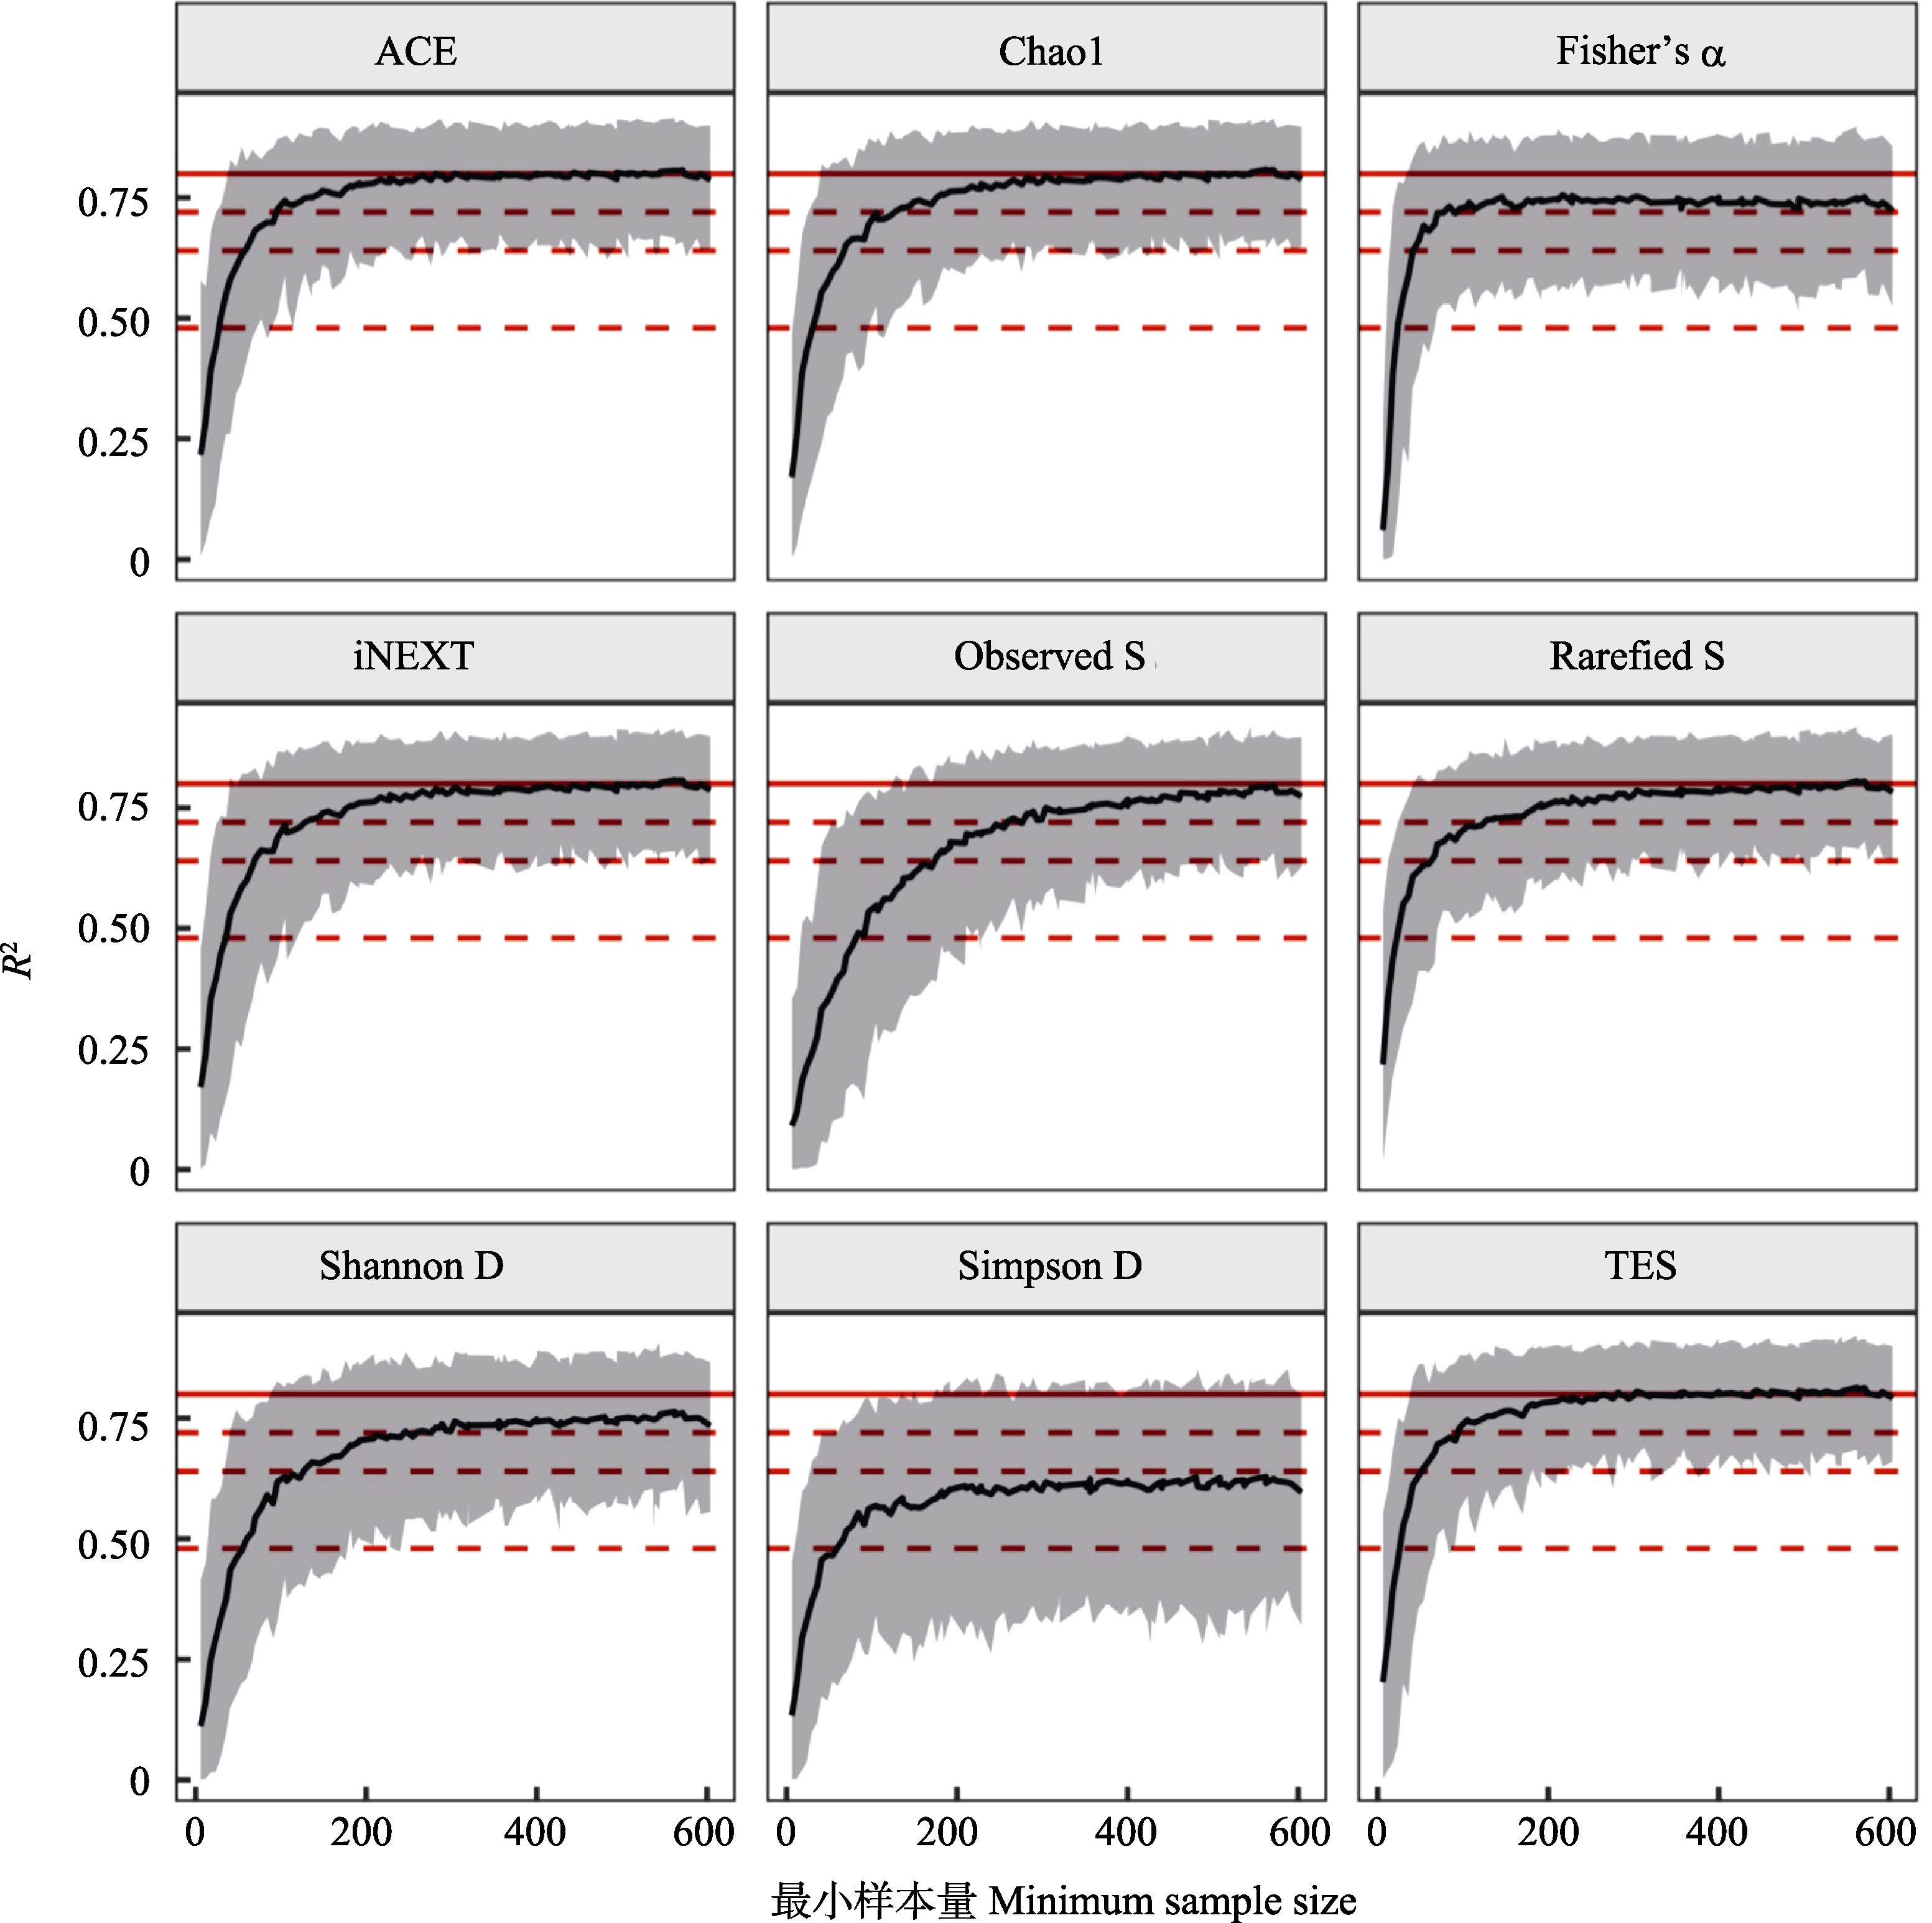
图2 最小样本量与线性回归决定系数(R2)的关系, 线条和阴影部分分别表示200次模拟的均值与95%置信区间。3条红色虚线分别表示R2 = 0.48 (60%设定值)、0.64 (80%设定值)、0.72 (90%设定值), 红色实线表示R2 = 0.80 (理论设定值)。
Fig. 2 Relationship between the minimum sample size and coefficient of determination (R2) from linear regression. Lines and shade areas refer to the mean and 95% confidence interval (CI) from 200 simulations. Three dashed red lines refer to R2 = 0.48 (60% set value), 0.64 (80% set value), and 0.72 (90% set value), respectively, while the solid red line represents R2 = 0.80 (theoretical setting value).
| 指数 Index | 60% (CV < 0.2) | 80% (CV < 0.2) | 90% (CV < 0.2) | 60% (CV < 0.3) | 80% (CV < 0.3) | 90% (CV < 0.3) |
|---|---|---|---|---|---|---|
| Observed S | 160 (53.1%) | 176 (55.5%) | 260 (65.3%) | 96 (40.6%) | 176 (55.5%) | 260 (65.3%) |
| Shannon D | 105 (42.8%) | 128 (47.5%) | 246 (64%) | 60 (30.3%) | 128 (47.5%) | 246 (64%) |
| Simpson D | 105 (42.8%) | - | - | 60 (30.3%) | - | - |
| Rarefied S | 48 (25.8%) | 67 (32.5%) | 128 (47.5%) | 24 (15.3%) | 67 (32.5%) | 128 (47.5%) |
| Fisher’s α | - | 48 (25.8%) | 84 (37.5%) | 30 (18.3%) | 48 (25.8%) | 84 (37.5%) |
| Chao1 | 67 (32.5%) | 70 (33.5%) | 128 (47.5%) | 36 (21.1%) | 70 (33.5%) | 128 (47.5%) |
| ACE | - | 60 (30.3%) | 96 (40.6%) | 30 (18.3%) | 60 (30.3%) | 96 (40.6%) |
| iNEXT | - | 70 (33.5%) | 136 (49%) | 48 (25.8%) | 70 (33.5%) | 136 (49%) |
| TES | - | 60 (30.3%) | 96 (40.6%) | 30 (18.3%) | 54 (28.3%) | 96 (40.6%) |
表1 不同多样性指数在相关性R2恢复到目标水平的60% (0.48)、80% (0.64)与90% (0.72)时所需的最小样本量及其对应的采样完整度(括号内), 并分别考虑误差阈值CV < 0.2和CV < 0.3。“-”表示未达到相应条件。
Table 1 Minimum sample sizes required for different diversity indices to achieve predefined recovery levels of 60% (0.48), 80% (0.64), 90% (0.72) to the target correlation R2, with the corresponding sample completeness shown in parentheses. Results are reported under two error thresholds, CV < 0.2 and CV < 0.3. “-” indicates that the criterion was not met.
| 指数 Index | 60% (CV < 0.2) | 80% (CV < 0.2) | 90% (CV < 0.2) | 60% (CV < 0.3) | 80% (CV < 0.3) | 90% (CV < 0.3) |
|---|---|---|---|---|---|---|
| Observed S | 160 (53.1%) | 176 (55.5%) | 260 (65.3%) | 96 (40.6%) | 176 (55.5%) | 260 (65.3%) |
| Shannon D | 105 (42.8%) | 128 (47.5%) | 246 (64%) | 60 (30.3%) | 128 (47.5%) | 246 (64%) |
| Simpson D | 105 (42.8%) | - | - | 60 (30.3%) | - | - |
| Rarefied S | 48 (25.8%) | 67 (32.5%) | 128 (47.5%) | 24 (15.3%) | 67 (32.5%) | 128 (47.5%) |
| Fisher’s α | - | 48 (25.8%) | 84 (37.5%) | 30 (18.3%) | 48 (25.8%) | 84 (37.5%) |
| Chao1 | 67 (32.5%) | 70 (33.5%) | 128 (47.5%) | 36 (21.1%) | 70 (33.5%) | 128 (47.5%) |
| ACE | - | 60 (30.3%) | 96 (40.6%) | 30 (18.3%) | 60 (30.3%) | 96 (40.6%) |
| iNEXT | - | 70 (33.5%) | 136 (49%) | 48 (25.8%) | 70 (33.5%) | 136 (49%) |
| TES | - | 60 (30.3%) | 96 (40.6%) | 30 (18.3%) | 54 (28.3%) | 96 (40.6%) |
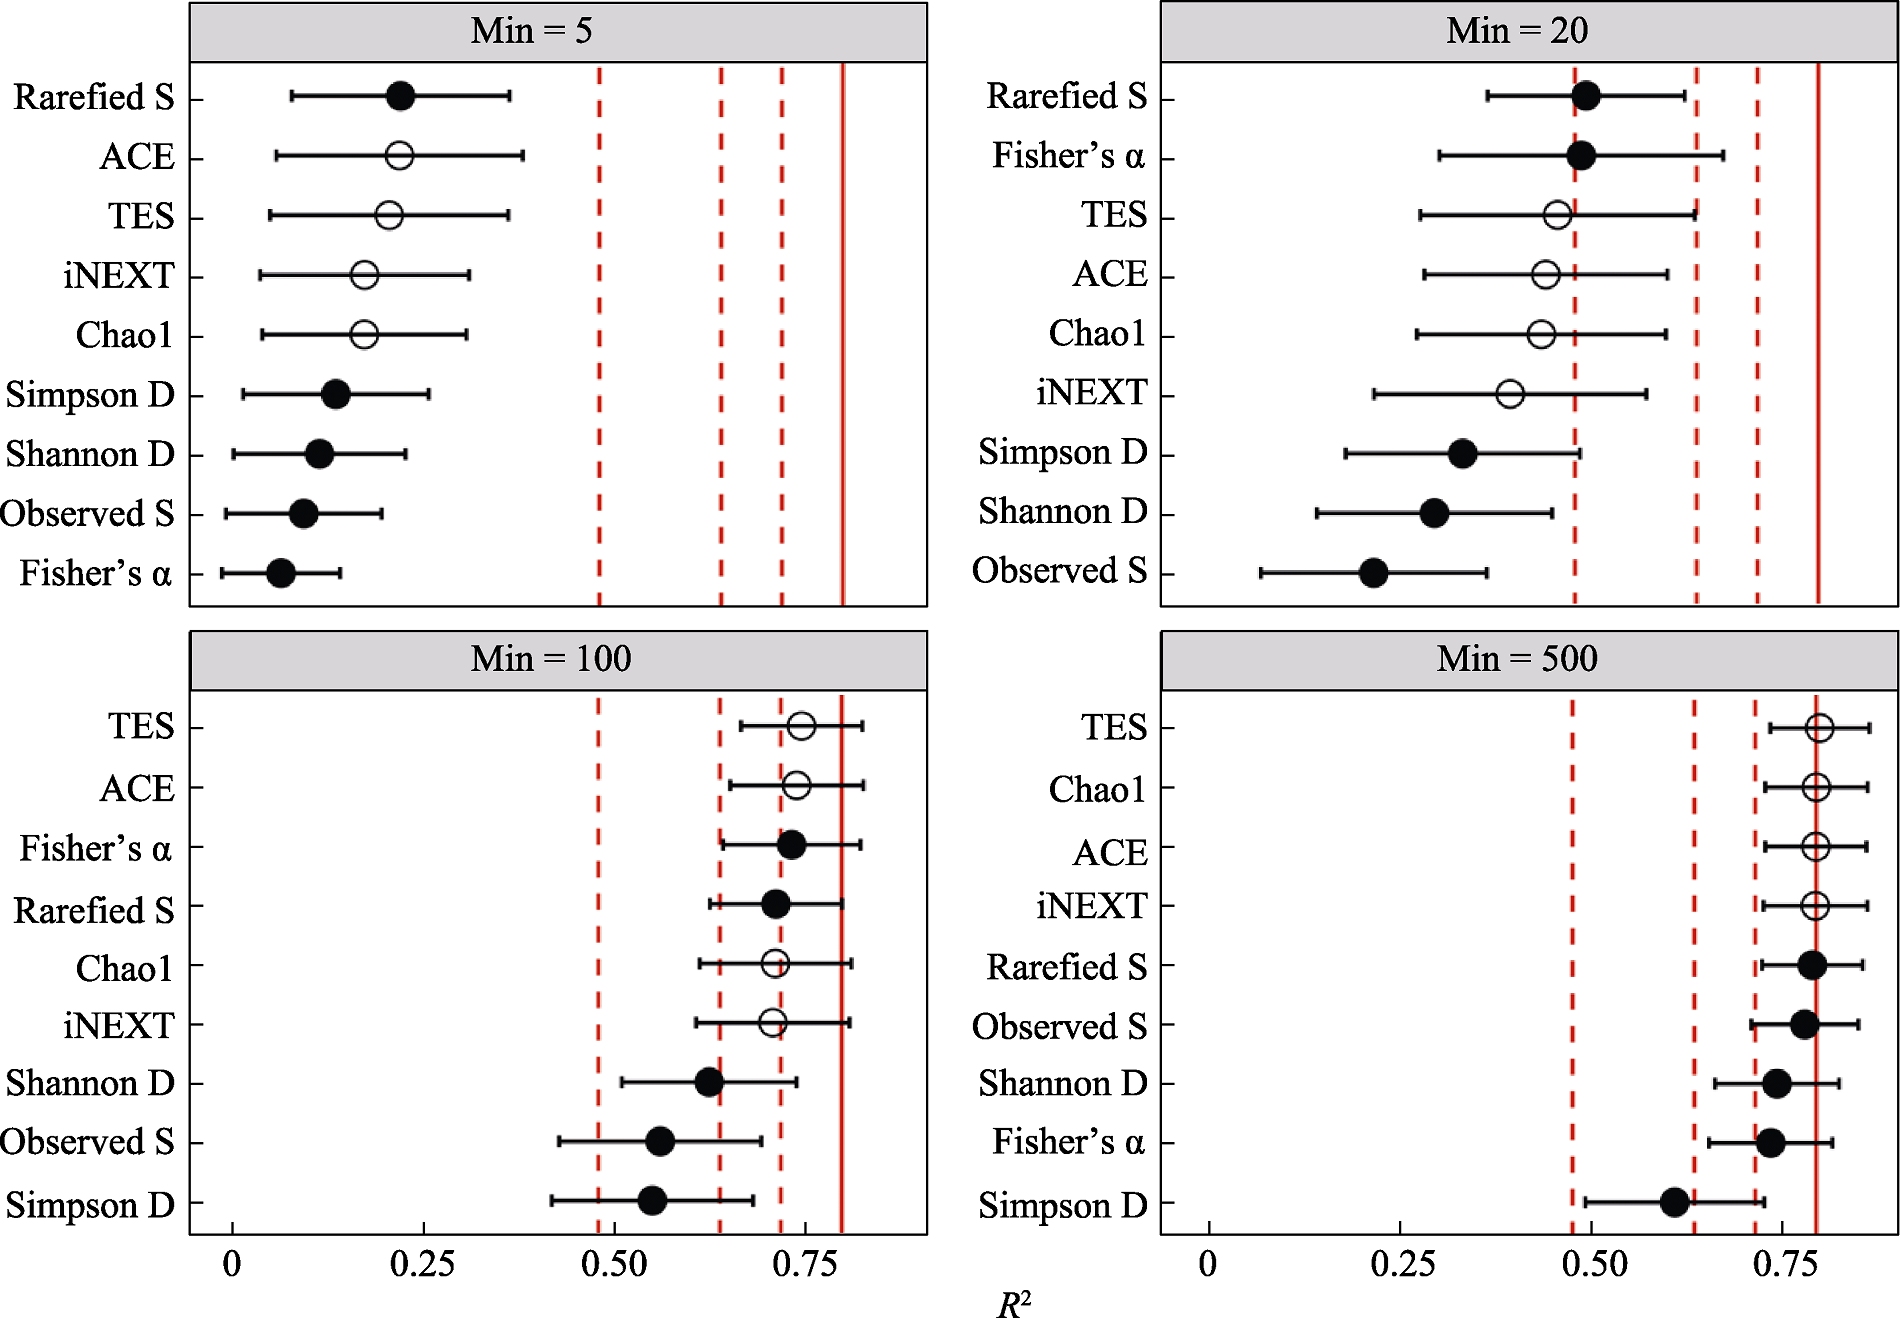
图3 设置4个最小采样阈值场景时(Min = 5、20、100和500), 各α多样性度量指标与环境梯度的线性回归决定系数(R2) (平均值 ± 标准差, 模拟200次)。实心点表示直接计算的多样性指数; 空心点表示物种丰富度估算型指数。3条红色虚线分别表示R2 = 0.48 (60%设定值), 0.64 (80%设定值), 0.72 (90%设定值), 红色实线表示R2 = 0.80 (理论设定值)。
Fig. 3 Coefficient of determination (R2) between each α-diversity metric and the environmental gradient under four minimum-sample scenarios (Min = 5, 20, 100, 500). (mean ± SD, 200 simulations). Solid dots are directly calculated diversity indices, and open symbols are richness estimators. Red three dashed red lines refer to R2 = 0.48 (60% set value), 0.64 (80% set value), and 0.72 (90% set value), respectively, while the solid red line represents R2 = 0.80 (theoretical setting value).
| [1] |
Beck J, Schwanghart W (2010) Comparing measures of species diversity from incomplete inventories: An update. Methods in Ecology and Evolution, 1, 38-44.
DOI URL |
| [2] |
Brehm G, Süssenbach D, Fiedler K (2003) Unique elevational diversity patterns of geometrid moths in an Andean montane rainforest. Ecography, 26, 456-466.
DOI URL |
| [3] | Chao A (1984) Nonparametric estimation of the number of classes in a population. Scandinavian Journal of Statistics, 11, 265-270. |
| [4] | Chao A, Chiu C (2016) Species richness:Estimation and comparison. Wiley StatsRef: Statistics Reference Online, 1-26. |
| [5] |
Chao A, Colwell RK, Chiu CH, Townsend D (2017) Seen once or more than once: Applying Good-Turing theory to estimate species richness using only unique observations and a species list. Methods in Ecology and Evolution, 8, 1221-1232.
DOI URL |
| [6] |
Chao A, Jost L (2012) Coverage-based rarefaction and extrapolation: Standardizing samples by completeness rather than size. Ecology, 93, 2533-2547.
DOI PMID |
| [7] |
Chao A, Lee SM (1992) Estimating the number of classes via sample coverage. Journal of the American Statistical Association, 87, 210-217.
DOI URL |
| [8] |
Currie DJ (1991) Energy and large-scale patterns of animal- and plant-species richness. The American Naturalist, 137, 27-49.
DOI URL |
| [9] | Engel T, Blowes SA, McGlinn DJ, May F, Gotelli NJ, McGill BJ, Chase JM (2021) Using coverage-based rarefaction to infer non-random species distributions. Ecosphere, 12, e03745. |
| [10] |
Fisher RA, Corbet AS, Williams CB (1943) The relation between the number of species and the number of individuals in a random sample of an animal population. Journal of Animal Ecology, 12, 42-58.
DOI URL |
| [11] |
Flather C (1996) Fitting species-accumulation functions and assessing regional land use impacts on avian diversity. Journal of Biogeography, 23, 155-168.
DOI URL |
| [12] | Gorrod EJ, Keith DA (2009) Observer variation in field assessments of vegetation condition: Implications for biodiversity conservation. Ecological Management & Restoration, 10, 31-40. |
| [13] |
Gotelli NJ, Colwell RK (2001) Quantifying biodiversity: Procedures and pitfalls in the measurement and comparison of species richness. Ecology Letters, 4, 379-391.
DOI URL |
| [14] | Hayek LAC, Buzas MA (2010) Surveying Natural Populations: Quantitative Tools for Assessing Biodiversity, 2nd edn. Columbia University Press, New York. |
| [15] |
Hsieh TC, Ma KH, Chao A (2016) iNEXT: An R package for rarefaction and extrapolation of species diversity (Hill numbers). Methods in Ecology and Evolution, 7, 1451-1456.
DOI URL |
| [16] |
Hurlbert AH, Haskell JP (2003) The effect of energy and seasonality on avian species richness and community composition. The American Naturalist, 161, 83-97.
DOI URL |
| [17] |
Hurlbert SH (1971) The nonconcept of species diversity: A critique and alternative parameters. Ecology, 52, 577-586.
DOI PMID |
| [18] |
Jost L (2006) Entropy and diversity. Oikos, 113, 363-375.
DOI URL |
| [19] |
Kreyling J, Schweiger AH, Bahn M, Ineson P, Migliavacca M, Morel-Journel T, Christiansen JR, Schtickzelle N, Larsen KS (2018) To replicate, or not to replicate—that is the question: How to tackle nonlinear responses in ecological experiments? Ecology Letters, 21, 1629-1638.
DOI PMID |
| [20] | Lomolino MV (2001) The species-area relationship: New challenges for an old pattern. Progress in Physical Geography: Earth and Environment, 25, 1-21. |
| [21] | Ma KP, Liu YM (1994) Measurement of biotic community diversity. I. α diversity (Part 2). Chinese Biodiversity, 2, 231-239. (in Chinese with English abstract) |
| [马克平, 刘玉明 (1994) 生物群落多样性的测度方法. I. α多样性的测度方法(下). 生物多样性, 2, 231-239.] | |
| [22] |
McGill BJ (2011) Linking biodiversity patterns by autocorrelated random sampling. American Journal of Botany, 98, 481-502.
DOI PMID |
| [23] | McGill BJ, Etienne RS, Gray JS, Alonso D, Anderson MJ, Benecha HK, Dornelas M, Enquist BJ, Green JL, He FL, Hurlbert AH, Magurran AE, Marquet PA, Maurer BA, Ostling A, Soykan CU, Ugland KI, White EP (2007) Species abundance distributions: Moving beyond single prediction theories to integration within an ecological framework. Ecology Letters, 10, 995-1015. |
| [24] | Mersmann O, Trautmann H, Steuer D, Bornkamp B (2018) truncnorm: Truncated Normal Distribution. R package version 1.0-8. |
| [25] | Oksanen J, Blanchet FG, Friendly M, Kindt R, Legendre P, McGlinn D, Minchin PR, O’Hara RB, Simpson GL, Solymos P, Stevens MHH, Szoecs E, Wagner H (2018) vegan: Community Ecology Package. R package version 2.5-6. |
| [26] | R Core Team (2021) R: A Language and Environment for Statistical Computing. Version 4.1.2. R Foundation for Statistical Computing, Vienna, Austria. |
| [27] |
Reese GC, Wilson KR, Flather CH (2014) Performance of species richness estimators across assemblage types and survey parameters. Global Ecology and Biogeography, 23, 585-594.
DOI URL |
| [28] | Soley-Guardia M, Alvarado-Serrano DF, Anderson RP (2024) Top ten hazards to avoid when modeling species distributions: A didactic guide of assumptions, problems, and recommendations. Ecography, 2024, e06852. |
| [29] |
Whittaker RH (1960) Vegetation of the Siskiyou Mountains, Oregon and California. Ecological Monographs, 30, 279-338.
DOI URL |
| [30] | Wickham H (2009) ggplot2: Elegant Graphics for Data Analysis. Springer Publishing Company, New York. |
| [31] | Wickham H, François R, Henry L, Müller K, Vaughan D (2023) dplyr: A Grammar of Data Manipulation. R package version 1.1.4. |
| [32] | Zou Y, Zhao P, Axmacher JC (2023) Estimating total species richness: Fitting rarefaction by asymptotic approximation. Ecosphere, 14, e4363. |
| [33] | Zou Y, Zhao P, Wu NC, Lai JS, Peres-Neto PR, Axmacher JC (2025) rarestR: An R package using rarefaction metrics to estimate α- and β-diversity for incomplete samples. Diversity and Distributions, 31, e13954. |
| [1] | 谷际岐, 赖江山, 王瑛, 吴浩然, 张雪, 宋晓彤, 邵小明, 娄安如. 联合物种分布模型与生物群落层次建模框架: 生态学理论、方法及应用[J]. 生物多样性, 2026, 34(1): 25364-. |
| [2] | 于琦胧, 郝珉辉, 何怀江, 张春雨, 赵秀海. 长白山森林不同演替阶段生物多样性与生产力的关系: 基于物种、性状和系统发育的视角[J]. 生物多样性, 2025, 33(8): 25060-. |
| [3] | 宋远昊, 龚吕, 李贲, 胡阳, 李秀珍. 辽河口不同退塘还湿方式对大型底栖动物的影响[J]. 生物多样性, 2025, 33(2): 24316-. |
| [4] | 贾贞妮, 张意岑, 杜彦君, 任海保. 干扰对中亚热带森林群落物种多样性演替动态的影响[J]. 生物多样性, 2025, 33(2): 24078-. |
| [5] | 琚晓千, 田赟, 徐铭泽, 代远萌, 李满乐, 周煜涵, 刘鹏, 贾昕, 查天山. 土壤环境因子对荒漠植物叶性状的驱动机制[J]. 生物多样性, 2025, 33(11): 25158-. |
| [6] | 李尚炫, 明姣, 陈根娟, 武杰, 张丙昌. 晋西北风沙区植被与生物结皮协同发育对土壤细菌群落的影响[J]. 生物多样性, 2025, 33(10): 25236-. |
| [7] | 魏诗雨, 宋天骄, 罗佳宜, 张燕, 赵子萱, 茹靖雯, 易华, 林雁冰. 秦岭火地塘针叶林土壤细菌群落的海拔分布格局[J]. 生物多样性, 2024, 32(9): 24180-. |
| [8] | 孟敬慈, 王国栋, 曹光兰, 胡楠林, 赵美玲, 赵延彤, 薛振山, 刘波, 朴文华, 姜明. 中国芦苇沼泽植物物种丰富度分布格局及其驱动因素[J]. 生物多样性, 2024, 32(2): 23194-. |
| [9] | 施国杉, 刘峰, 曹光宏, 陈典, 夏尚文, 邓云, 王彬, 杨效东, 林露湘. 西双版纳热带季节雨林木本植物的beta多样性: 空间、环境与林分结构的作用[J]. 生物多样性, 2024, 32(12): 24285-. |
| [10] | 王丽媛, 胡慧建, 姜杰, 胡一鸣. 南岭哺乳类和鸟类物种丰富度空间分布格局及其影响因子[J]. 生物多样性, 2024, 32(1): 23026-. |
| [11] | 刘志发, 王新财, 龚粤宁, 陈道剑, 张强. 基于红外相机监测的广东南岭国家级自然保护区鸟兽多样性及其垂直分布特征[J]. 生物多样性, 2023, 31(8): 22689-. |
| [12] | 张雅丽, 张丙昌, 赵康, 李凯凯, 刘燕晋. 毛乌素沙地不同类型生物结皮细菌群落差异及其驱动因子[J]. 生物多样性, 2023, 31(8): 23027-. |
| [13] | 陈声文, 任海保, 童光蓉, 王宁宁, 蓝文超, 薛建华, 米湘成. 钱江源国家公园木本植物物种多样性空间分布格局[J]. 生物多样性, 2023, 31(7): 22587-. |
| [14] | 谢艳秋, 黄晖, 王春晓, 何雅琴, 江怡萱, 刘子琳, 邓传远, 郑郁善. 福建海岛滨海特有植物种-面积关系及物种丰富度决定因素[J]. 生物多样性, 2023, 31(5): 22345-. |
| [15] | 姚仁秀, 陈燕, 吕晓琴, 王江湖, 杨付军, 王晓月. 海拔及环境因子影响杜鹃属植物的表型特征和化学性状[J]. 生物多样性, 2023, 31(2): 22259-. |
| 阅读次数 | ||||||
|
全文 |
|
|||||
|
摘要 |
|
|||||
备案号:京ICP备16067583号-7
Copyright © 2026 版权所有 《生物多样性》编辑部
地址: 北京香山南辛村20号, 邮编:100093
电话: 010-62836137, 62836665 E-mail: biodiversity@ibcas.ac.cn
![]()