
生物多样性 ›› 2018, Vol. 26 ›› Issue (9): 941-950. DOI: 10.17520/biods.2018125 cstr: 32101.14.biods.2018125
王波1,4, 黄勇2, 李家堂3, 戴强3, 王跃招3, 杨道德1,*( )
)
收稿日期:2018-04-22
接受日期:2018-07-05
出版日期:2018-09-20
发布日期:2019-01-05
通讯作者:
杨道德
作者简介:# 共同第一作者
基金资助:
Bo Wang1,4, Yong Huang2, Jiatang Li3, Qiang Dai3, Yuezhao Wang3, Daode Yang1,*()
Received:2018-04-22
Accepted:2018-07-05
Online:2018-09-20
Published:2019-01-05
Contact:
Yang Daode
About author:# Co-first authors
摘要:
物种丰富度分布格局的成因机制一直是宏观生态学研究的热点问题之一。中国西南地区喀斯特地貌区(以广西、云南和贵州为主)是世界上面积最大的喀斯特地貌区, 也是全球范围内34个生物多样性热点地区之一。为了解该区域两栖动物物种丰富度分布格局及其与环境因子之间的关系, 本研究根据中国科学院成都生物研究所标本馆、中国科学院昆明动物研究所标本馆、广西壮族自治区自然博物馆和中南林业科技大学动物标本室收藏的标本数据, 以及公开发表的文献数据, 共获得18,246条两栖动物记录(219个物种), 然后运用生态位模型估测每个物种的潜在分布区, 并把每个物种的潜在分布区叠加起来, 最终得到该区域在10 km ´10 km生态位模型空间尺度上的两栖物种丰富度地理分布格局图, 最后进行多元回归和模型选择分析。结果表明: 有12种两栖动物仅在喀斯特地貌区分布, 占物种总数的5.48%; 有104种两栖动物仅在非喀斯特地貌区分布, 占物种总数的47.49%; 有103种两栖动物在喀斯特地貌区和非喀斯特地貌区均有分布, 占物种总数的47.03%; 两栖动物物种丰富度随纬度的增高而降低; 地貌类型(喀斯特地貌和非喀斯特地貌)对两栖动物物种丰富度的分布格局有显著影响(χ2 = 36.47, P < 0.0001), 但模型拟合效果差(McFadden’s Rho square = 0.0037)。影响该区域两栖动物物种丰富度分布格局最大的环境因子是年均降雨量(R2 = 0.232, P < 0.001), 其次是最干月平均降雨量(R2 = 0.221, P < 0.001)。该区域两栖动物物种丰富度的格局主要是由地貌和不同的环境因子共同相互作用的结果, 不过仍有相当一部分物种丰富度的分布格局未被解释。因此, 要更全面地认识该区域两栖动物物种丰富度格局的形成机制, 有必要加强干扰、捕食、竞争等其他生物因子的影响研究。
王波, 黄勇, 李家堂, 戴强, 王跃招, 杨道德 (2018) 西南喀斯特地貌区两栖动物丰富度分布格局与环境因子的关系. 生物多样性, 26, 941-950. DOI: 10.17520/biods.2018125.
Bo Wang, Yong Huang, Jiatang Li, Qiang Dai, Yuezhao Wang, Daode Yang (2018) Amphibian species richness patterns in karst regions in Southwest China and its environmental associations. Biodiversity Science, 26, 941-950. DOI: 10.17520/biods.2018125.
| 相关假说 Hypothesis | 环境变量 Environmental variable | 变量缩写 Abbreviation |
|---|---|---|
| 能量假说 Energy availability | 年均温度 Annual mean temperature (℃) | BIO1 |
| 平均日温差 Mean diurnal range (℃) | BIO2 | |
| 等温性 Isothermality (℃) | BIO3 | |
| 季节性温度变化 Temperature seasonality | BIO4 | |
| 最高气温 Max temperature of warmest month (℃) | BIO5 | |
| 最低气温 Min temperature of coldest month (℃) | BIO6 | |
| 年均温差 Temperature annual range (℃) | BIO7 | |
| 最湿季平均温度 Mean temperature of wettest quarter (℃) | BIO8 | |
| 最干季平均温度 Mean temperature of driest quarter (℃) | BIO9 | |
| 最暖季平均温度 Mean temperature of warmest quarter (℃) | BIO10 | |
| 最冷季平均温度 Mean temperature of coldest quarter (℃) | BIO11 | |
| 年均日照时数(白昼长的百分比) Mean annual sunshine (percent of daylength) | SUNP | |
| 年均霜日频率 Mean annual frost-day frequency (days) | FF | |
| 年均潜在蒸散量 Mean annual potential evapotranspiration (mm/yr) | PET | |
| 年均风速 Mean annual wind speed (m/s) | WIND | |
| 水分假说 Water availability | 年均降雨量 Annual precipitation (mm/yr) | BIO12 |
| 最湿月平均降雨量 Precipitation of wettest month (mm/yr) | BIO13 | |
| 最干月平均降雨量 Precipitation of driest month (mm/yr) | BIO14 | |
| 季节性降雨量 Precipitation seasonality | BIO15 | |
| 最湿季平均降雨量 Precipitation of wettest quarter (mm/yr) | BIO16 | |
| 最干季平均降雨量 Precipitation of driest quarter (mm/yr) | BIO17 | |
| 最暖季平均降雨量 Precipitation of warmest quarter (mm/yr) | BIO18 | |
| 最冷季平均降雨量 Precipitation of coldest quarter (mm/yr) | BIO19 | |
| 年均相对湿度 Mean annual relative humidity (%) | REH | |
| 生产力假说 Productive energy | 归一化植被指数 Normalized difference vegetation index | NDVI |
| 年均实际蒸散量 Mean annual actual evapotranspiration (mm/yr) | AET | |
| 年均太阳辐射量 Mean annual solar radiation (W/m2) | RAD | |
| 生境异质性 假说 Habitat heterogeneity | 海拔 Elevation | ELE |
| 植被类型数 Vegetation (number of vegetation classes/quadrat) | VEG | |
| 地貌类型 Landform | LANDF |
表1 4个假说表征的环境变量
Table 1 Environmental variables represented by the four hypotheses
| 相关假说 Hypothesis | 环境变量 Environmental variable | 变量缩写 Abbreviation |
|---|---|---|
| 能量假说 Energy availability | 年均温度 Annual mean temperature (℃) | BIO1 |
| 平均日温差 Mean diurnal range (℃) | BIO2 | |
| 等温性 Isothermality (℃) | BIO3 | |
| 季节性温度变化 Temperature seasonality | BIO4 | |
| 最高气温 Max temperature of warmest month (℃) | BIO5 | |
| 最低气温 Min temperature of coldest month (℃) | BIO6 | |
| 年均温差 Temperature annual range (℃) | BIO7 | |
| 最湿季平均温度 Mean temperature of wettest quarter (℃) | BIO8 | |
| 最干季平均温度 Mean temperature of driest quarter (℃) | BIO9 | |
| 最暖季平均温度 Mean temperature of warmest quarter (℃) | BIO10 | |
| 最冷季平均温度 Mean temperature of coldest quarter (℃) | BIO11 | |
| 年均日照时数(白昼长的百分比) Mean annual sunshine (percent of daylength) | SUNP | |
| 年均霜日频率 Mean annual frost-day frequency (days) | FF | |
| 年均潜在蒸散量 Mean annual potential evapotranspiration (mm/yr) | PET | |
| 年均风速 Mean annual wind speed (m/s) | WIND | |
| 水分假说 Water availability | 年均降雨量 Annual precipitation (mm/yr) | BIO12 |
| 最湿月平均降雨量 Precipitation of wettest month (mm/yr) | BIO13 | |
| 最干月平均降雨量 Precipitation of driest month (mm/yr) | BIO14 | |
| 季节性降雨量 Precipitation seasonality | BIO15 | |
| 最湿季平均降雨量 Precipitation of wettest quarter (mm/yr) | BIO16 | |
| 最干季平均降雨量 Precipitation of driest quarter (mm/yr) | BIO17 | |
| 最暖季平均降雨量 Precipitation of warmest quarter (mm/yr) | BIO18 | |
| 最冷季平均降雨量 Precipitation of coldest quarter (mm/yr) | BIO19 | |
| 年均相对湿度 Mean annual relative humidity (%) | REH | |
| 生产力假说 Productive energy | 归一化植被指数 Normalized difference vegetation index | NDVI |
| 年均实际蒸散量 Mean annual actual evapotranspiration (mm/yr) | AET | |
| 年均太阳辐射量 Mean annual solar radiation (W/m2) | RAD | |
| 生境异质性 假说 Habitat heterogeneity | 海拔 Elevation | ELE |
| 植被类型数 Vegetation (number of vegetation classes/quadrat) | VEG | |
| 地貌类型 Landform | LANDF |
| 环境变量 Enviromental predictor | AICc | ΔAICc | Wi | t | R2 | P |
|---|---|---|---|---|---|---|
| 年均降雨量 Annual precipitation (mm/yr) | 41,710 | 0 | 1 | 48.465 | 0.232 | < 0.001 |
| 最干月平均降雨量 Precipitation of driest month (mm/yr) | 41,820 | 110 | 0 | 46.963 | 0.221 | < 0.001 |
| 日照时数(白昼长的百分比) Mean annual sunshine (percent of daylength) | 43,021 | 1,311 | 0 | -27.903 | 0.091 | 0 |
| 年均实际蒸散量 Mean annual actual evapotranspiration (mm/yr) | 43,071 | 1,361 | 0 | 26.895 | 0.085 | < 0.001 |
| 年均相对湿度 Mean annual relative humidity (%) | 43,479 | 1,769 | 0 | 17.021 | 0.036 | 0 |
| 年均风速 Mean annual wind speed | 43,666 | 1,956 | 0 | -9.861 | 0.012 | < 0.001 |
| 年均潜在蒸散量 Mean annual potential evapotranspiration (mm/yr) | 43,753 | 2,043 | 0 | 3.129 | 0.001 | 0.002 |
| 年均温度 Annual mean temperature (℃) | 43,568 | 1,858 | 0 | 14.043 | 0.025 | < 0.001 |
| 植被类型数 Vegetation (number of vegetation classes/quadrat) | 43,758 | 2,048 | 0 | -2.251 | < 0.001 | 0.024 |
| 归一化植被指数 Normalized difference vegetation index | 43,761 | 2,051 | 0 | 1.38 | < 0.001 | 0.168 |
| 年均太阳辐射量 Mean annual solar radiation (W/m2) | 43,761 | 2,051 | 0 | -1.453 | < 0.001 | 0.146 |
表2 两栖类物种丰富度和变量的线性回归分析的AICc值、统计值(t)、R2和P值
Table 2 Standardized regression coefficients of linear regression, t statistics, R2 and associated P-values for amphibian species richness against environmental predictors
| 环境变量 Enviromental predictor | AICc | ΔAICc | Wi | t | R2 | P |
|---|---|---|---|---|---|---|
| 年均降雨量 Annual precipitation (mm/yr) | 41,710 | 0 | 1 | 48.465 | 0.232 | < 0.001 |
| 最干月平均降雨量 Precipitation of driest month (mm/yr) | 41,820 | 110 | 0 | 46.963 | 0.221 | < 0.001 |
| 日照时数(白昼长的百分比) Mean annual sunshine (percent of daylength) | 43,021 | 1,311 | 0 | -27.903 | 0.091 | 0 |
| 年均实际蒸散量 Mean annual actual evapotranspiration (mm/yr) | 43,071 | 1,361 | 0 | 26.895 | 0.085 | < 0.001 |
| 年均相对湿度 Mean annual relative humidity (%) | 43,479 | 1,769 | 0 | 17.021 | 0.036 | 0 |
| 年均风速 Mean annual wind speed | 43,666 | 1,956 | 0 | -9.861 | 0.012 | < 0.001 |
| 年均潜在蒸散量 Mean annual potential evapotranspiration (mm/yr) | 43,753 | 2,043 | 0 | 3.129 | 0.001 | 0.002 |
| 年均温度 Annual mean temperature (℃) | 43,568 | 1,858 | 0 | 14.043 | 0.025 | < 0.001 |
| 植被类型数 Vegetation (number of vegetation classes/quadrat) | 43,758 | 2,048 | 0 | -2.251 | < 0.001 | 0.024 |
| 归一化植被指数 Normalized difference vegetation index | 43,761 | 2,051 | 0 | 1.38 | < 0.001 | 0.168 |
| 年均太阳辐射量 Mean annual solar radiation (W/m2) | 43,761 | 2,051 | 0 | -1.453 | < 0.001 | 0.146 |
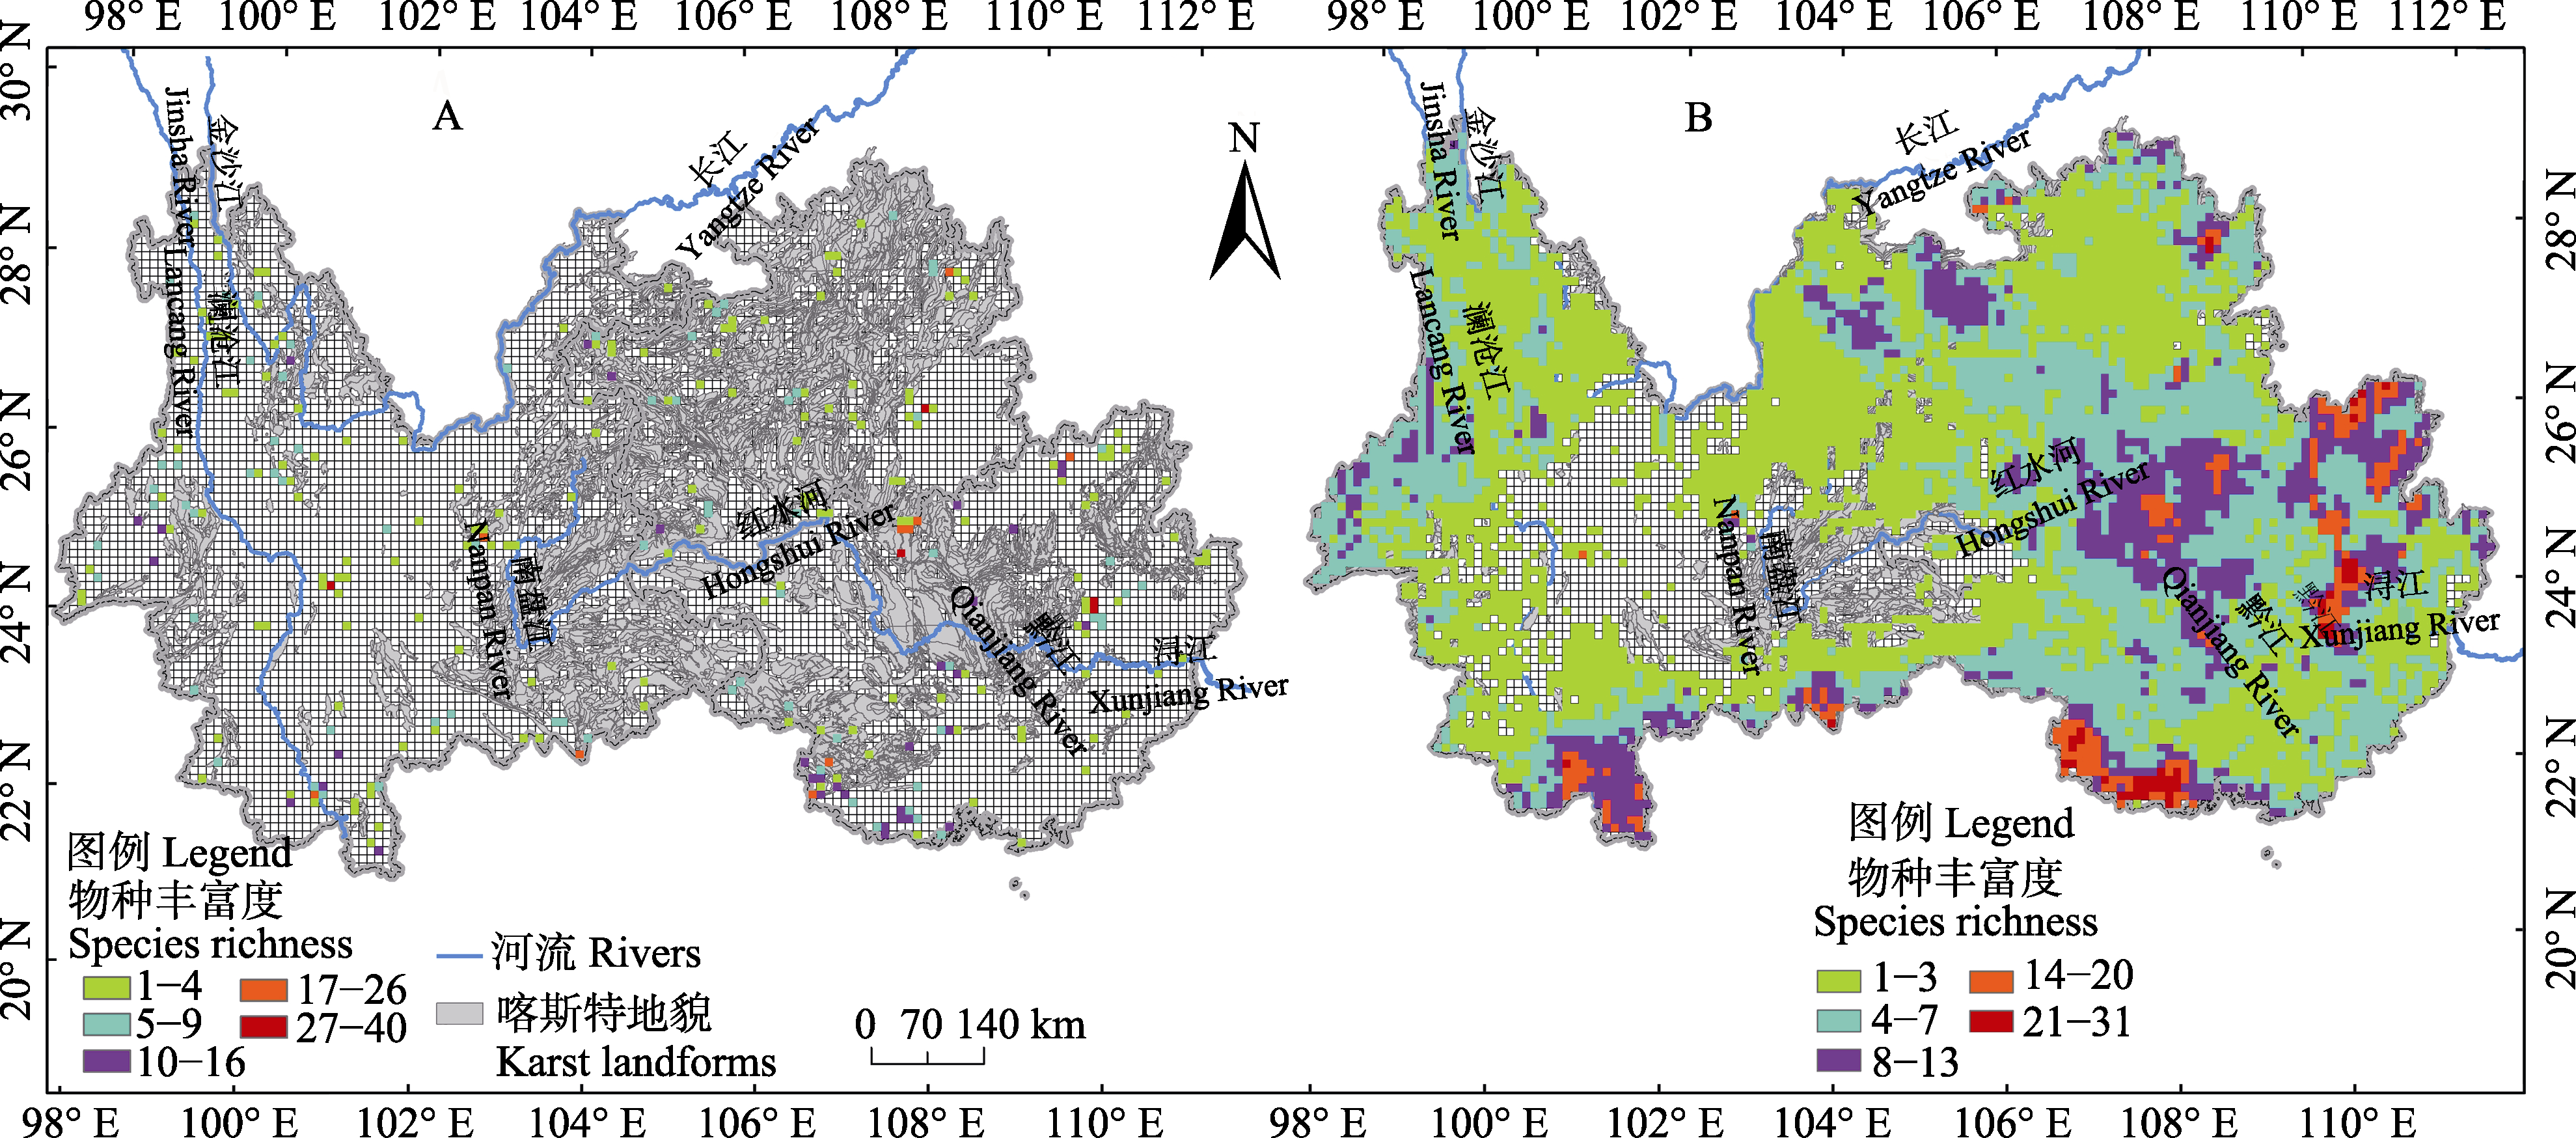
图1 西南喀斯特两栖动物物种丰富度格局图。A: 基于实际收集的数据; B: 基于MaxEnt模型预测。每个栅格面积为10 km × 10 km, 空白栅格表示无物种分布记录或未收集到数据。
Fig. 1 Species distribution modeling of amphibians in Southwest China, based on (A) the raw data of museum collections data and (B) MaxEnt species distribution modeling. The area of each cell is 10 km × 10 km. Blank cells have no specimen based on the major collections.
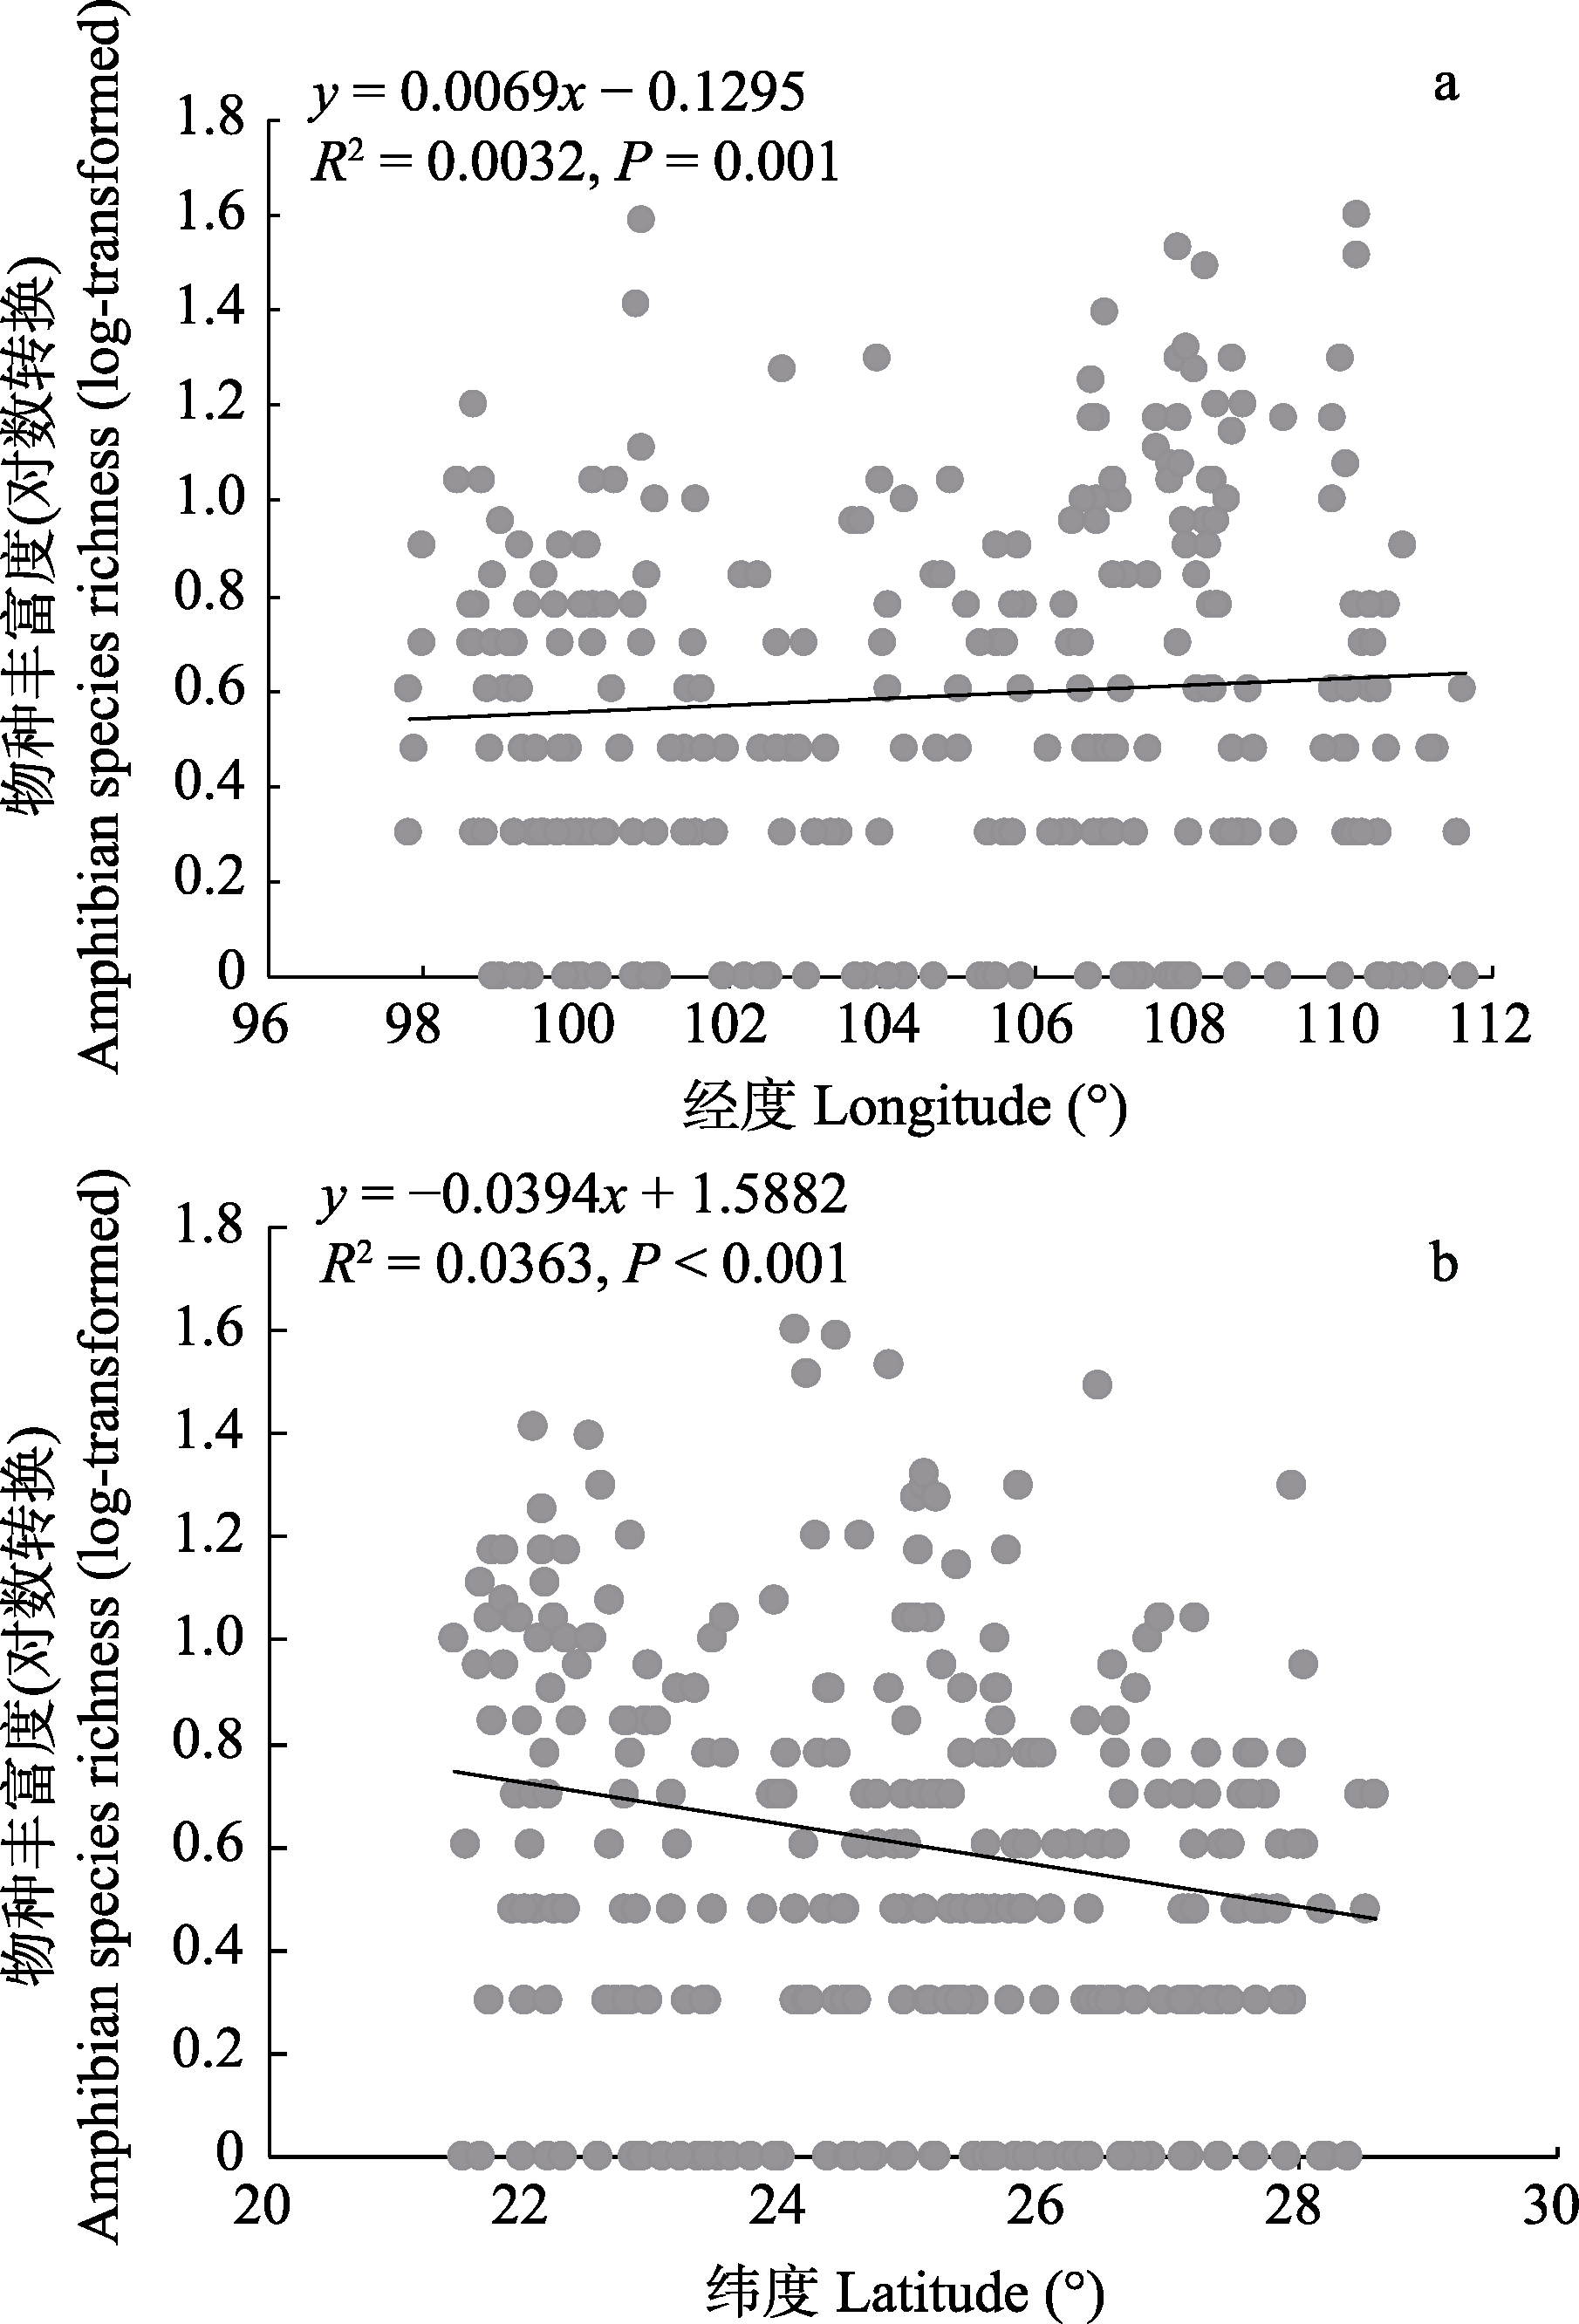
图2 基于实际收集到的经纬度点数据的两栖类物种丰富度与经度(a)和纬度(b)的关系
Fig. 2 The relationships between amphibian richness and longitude (a) and latitude (b) based on the raw data of museum collections
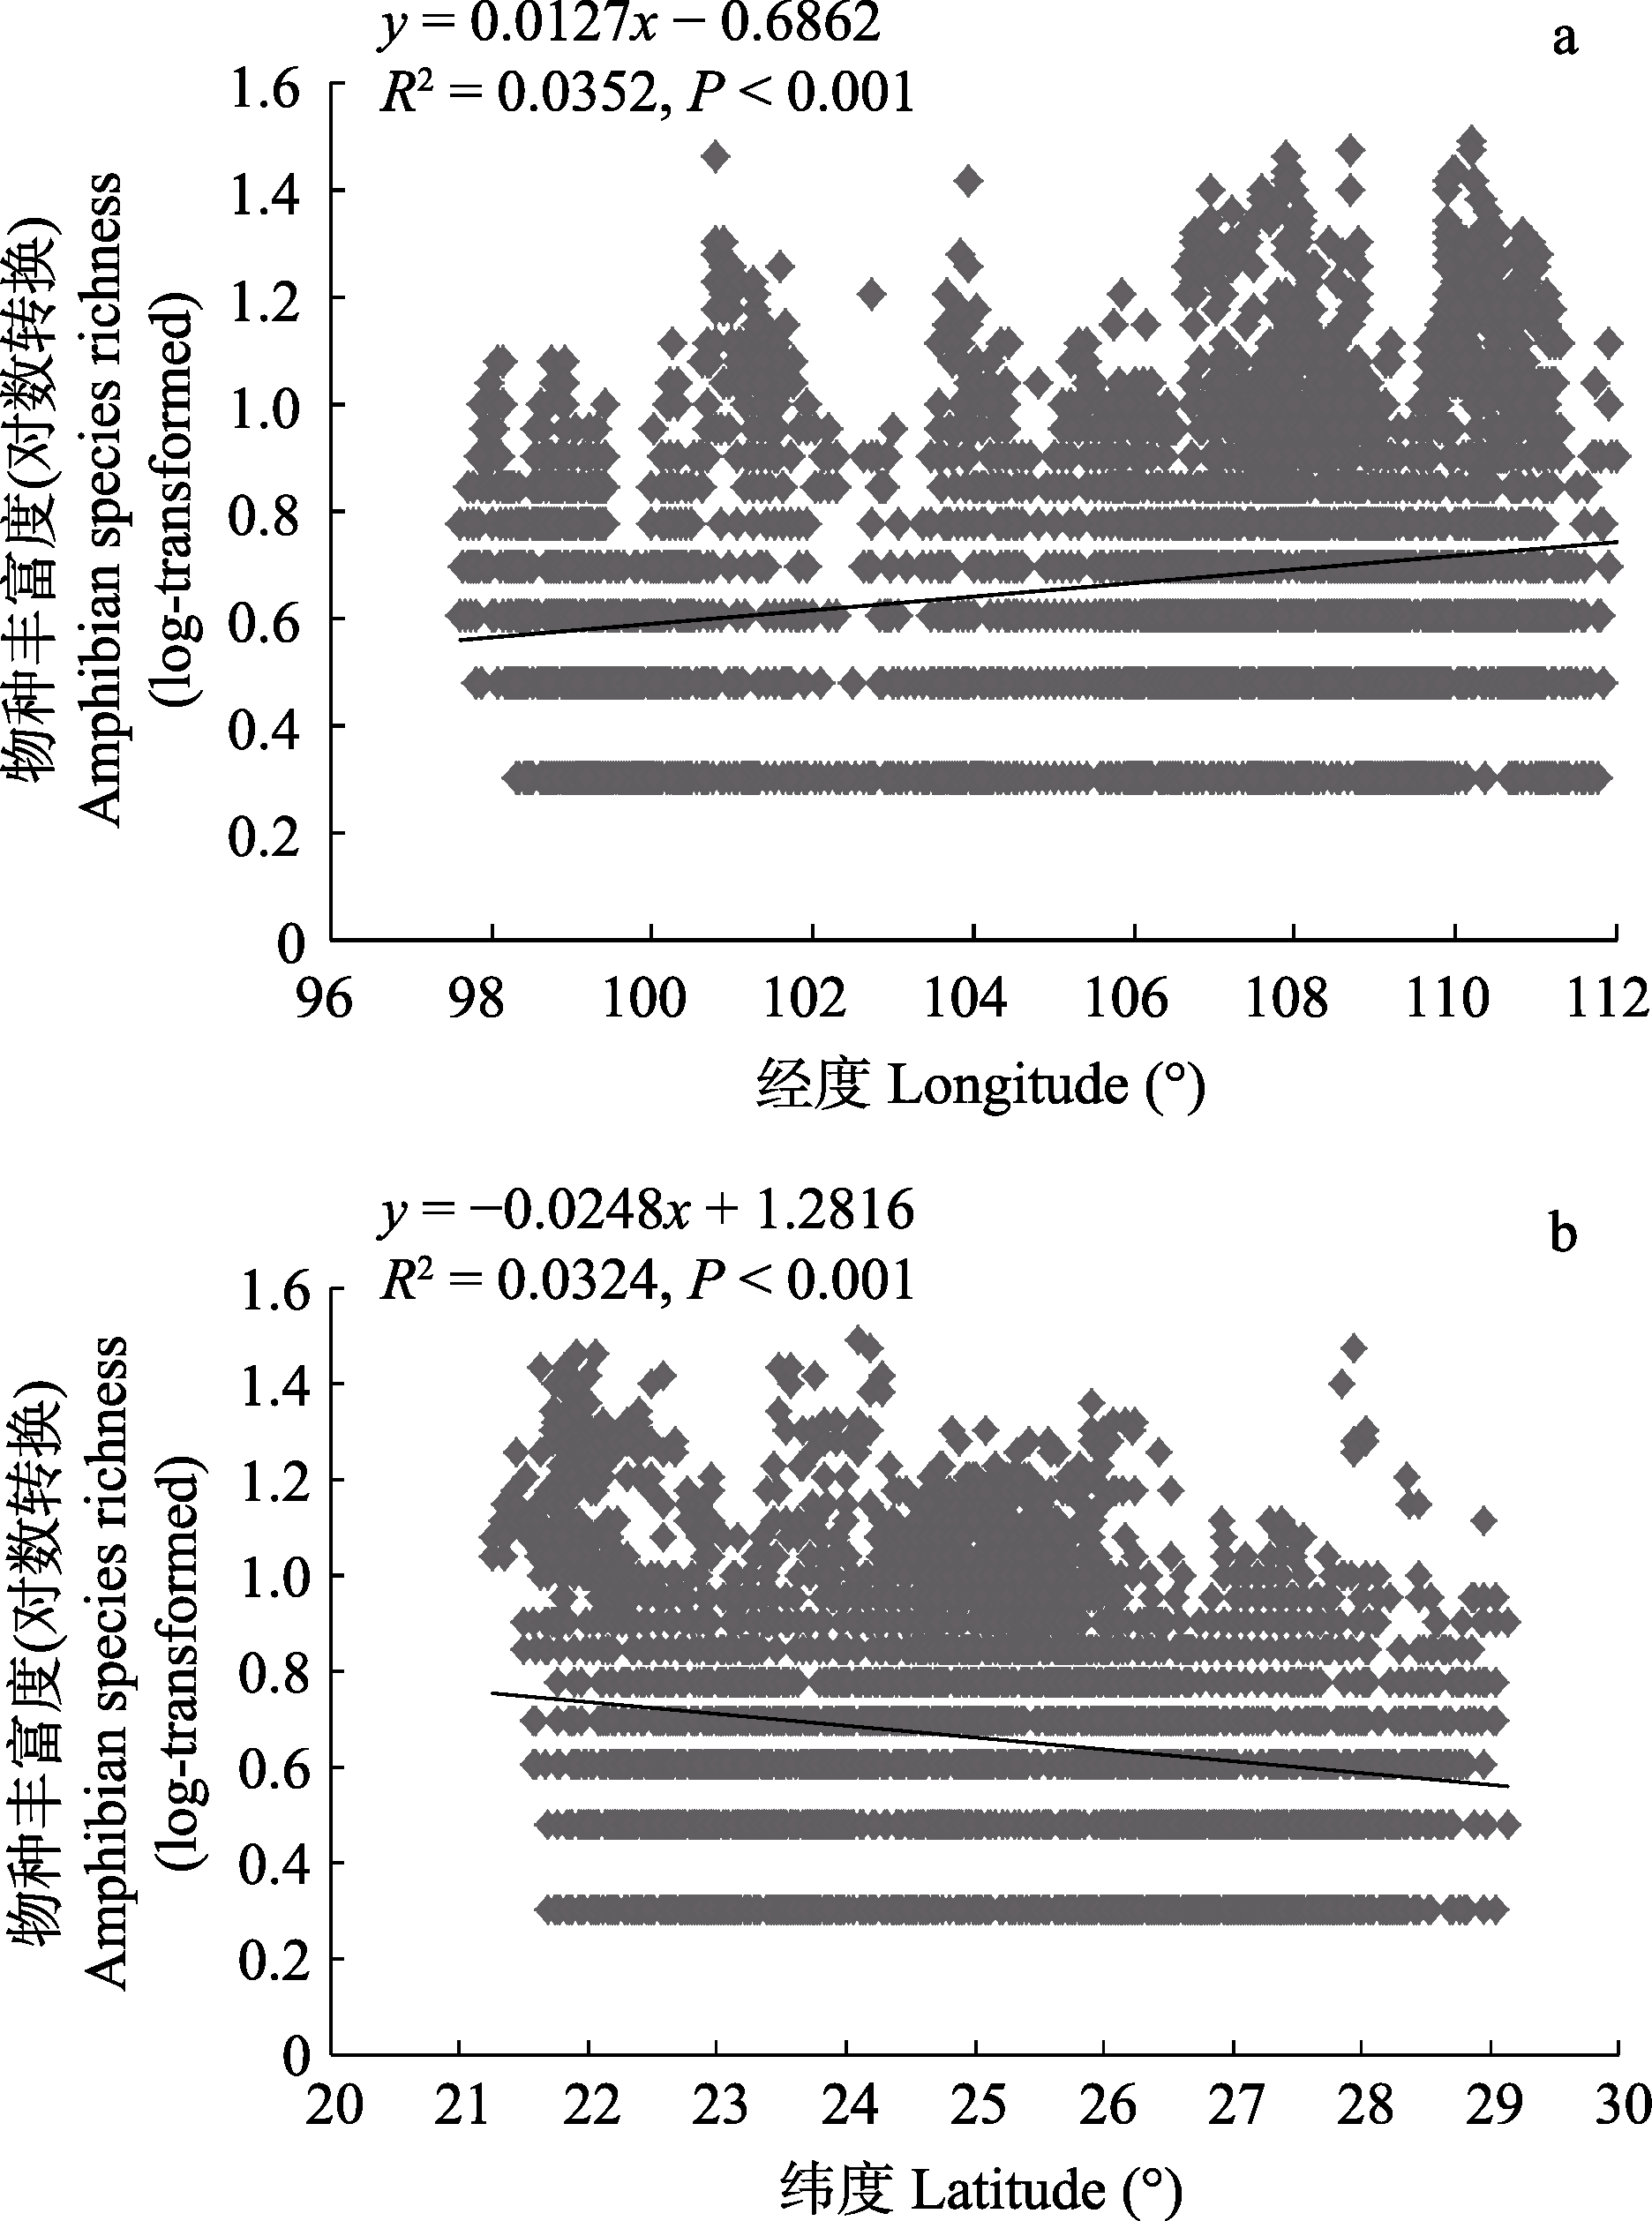
图3 基于MaxEnt模型预测的两栖类物种丰富度与经度(a)和纬度(b)的关系
Fig. 3 The relationships between amphibian richness and longitude (a) and latitude (b) based on MaxEnt species distribution modeling
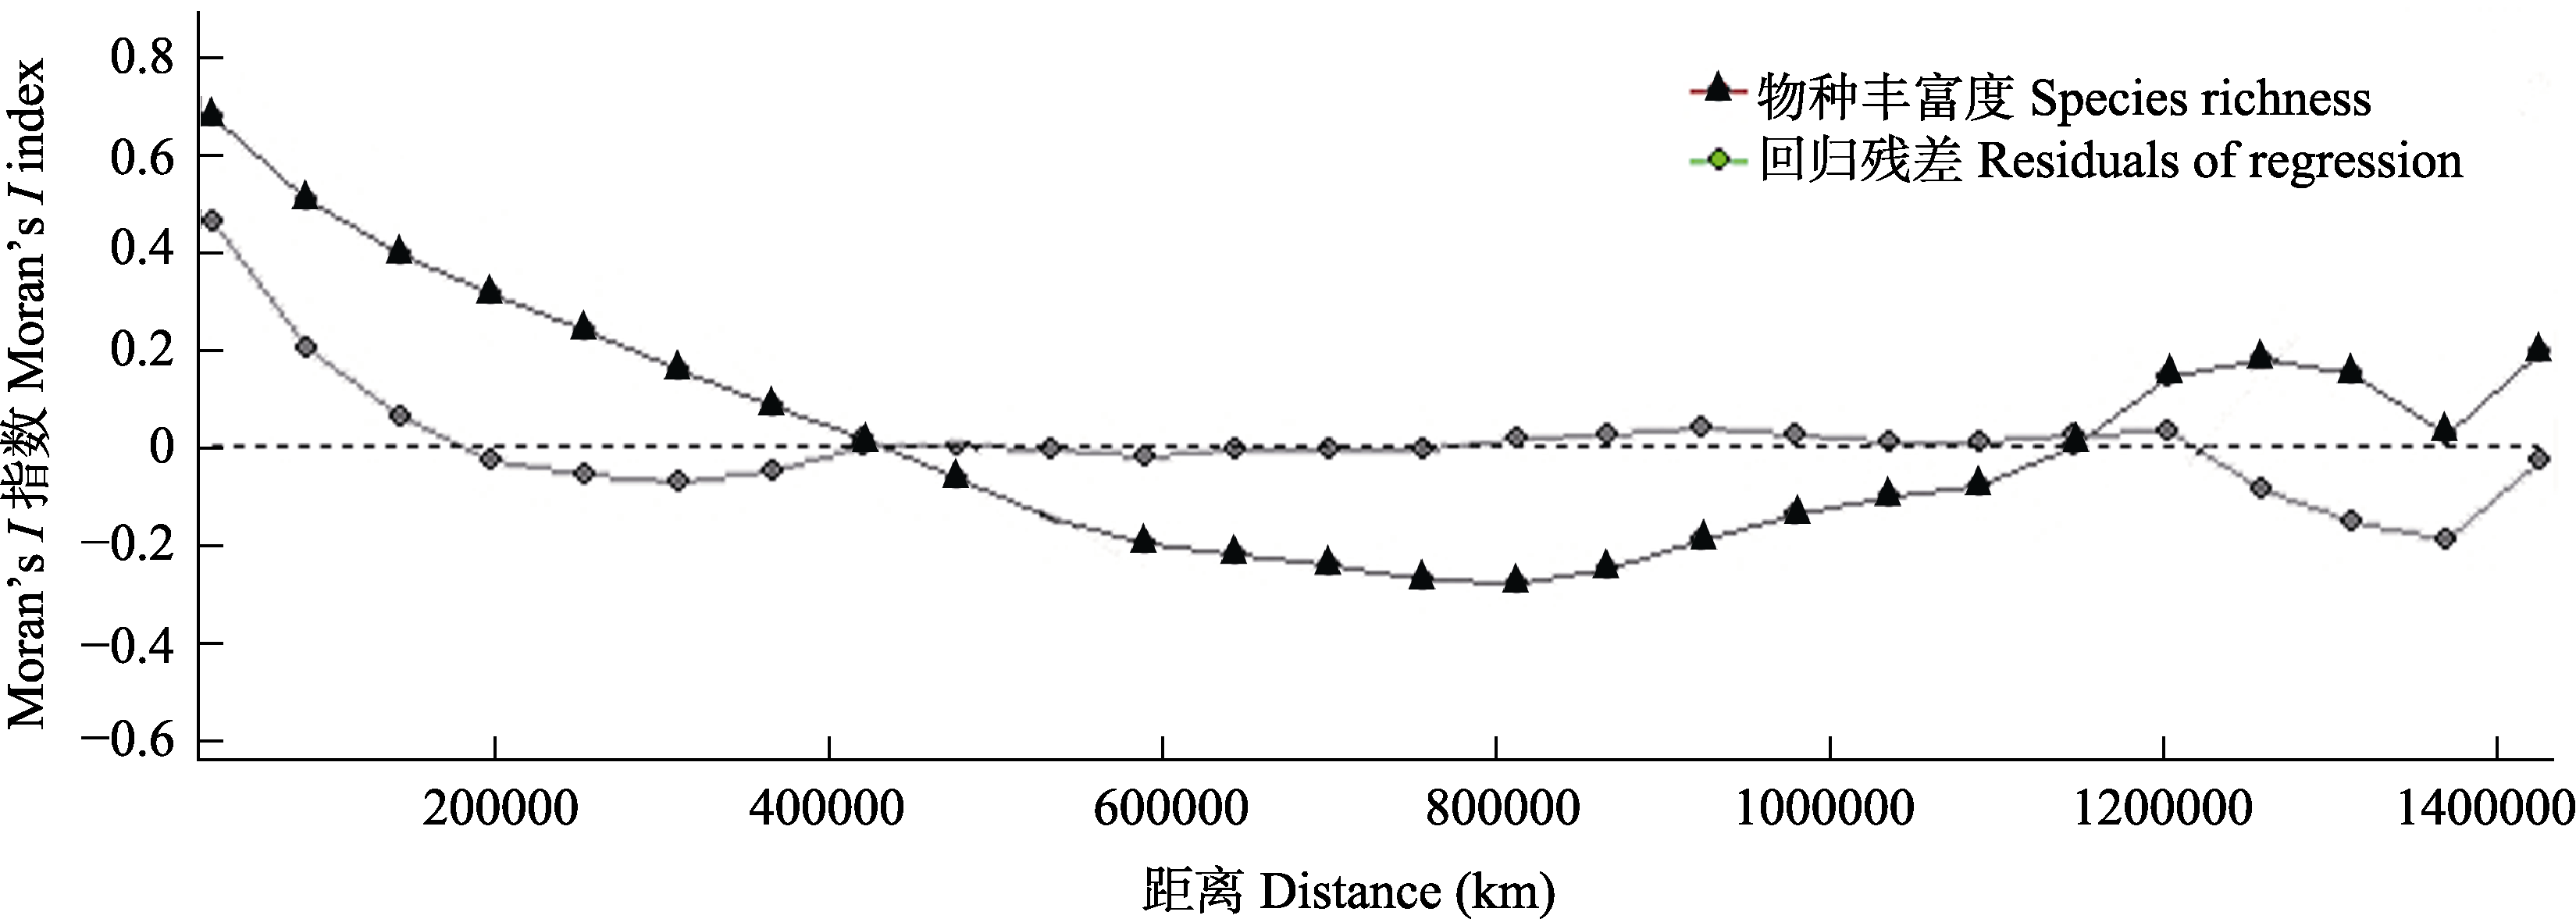
图4 两栖类的物种丰富度和环境变量的回归残差的Moran’s I指数图
Fig. 4 Moran’s I index correlogram for amphibian species richness and the residuals of multiple regression with environmental predictors
| 假说 Hypothesis | R2 | AICc | ΔAICc | K | Wi |
|---|---|---|---|---|---|
| 生产力假说 Productivity energy | 0.004 | 6,908 | 4,268 | 4 | 0 |
| 生境异质性假说 Habitat heterogeneity | 0.005 | 6,898 | 4,258 | 3 | 0 |
| 能量假说 Ambient energy | 0.173 | 5,462 | 2,822 | 5 | 0 |
| 水分-能量假说 Water-energy balance hypothesis | 0.34 | 3,706 | 1,066 | 4 | 0 |
| 混合模型 Mixed model* | 0.425 | 2,640 | 0 | 12 | 1 |
表3 基于模型选择方法的每种假说的AICc值和调整R2值
Table 3 AICc value and adjusted R2 value for each hypothesis based on model selection approach
| 假说 Hypothesis | R2 | AICc | ΔAICc | K | Wi |
|---|---|---|---|---|---|
| 生产力假说 Productivity energy | 0.004 | 6,908 | 4,268 | 4 | 0 |
| 生境异质性假说 Habitat heterogeneity | 0.005 | 6,898 | 4,258 | 3 | 0 |
| 能量假说 Ambient energy | 0.173 | 5,462 | 2,822 | 5 | 0 |
| 水分-能量假说 Water-energy balance hypothesis | 0.34 | 3,706 | 1,066 | 4 | 0 |
| 混合模型 Mixed model* | 0.425 | 2,640 | 0 | 12 | 1 |
| [1] | Ahmed SE, McInerny G, O’Hara K, Harper R, Salido L, Emmott S, Joppa LN (2015) Scientists and software—surveying the species distribution modelling community. Diversity and Distributions, 21, 258-267. |
| [2] | Ahn CH, Tateishi R (1994) Development of a global 30-minute grid potential evapotranspiration data set. Journal of the Japan Society of Photogrammetry, 33, 12-21. |
| [3] | Anderson DR, Burnham KP, Thompson WL (2000) Null hypothesis testing: Problems, prevalence, and an alternative. Journal of Wildlife Management, 64, 912-923. |
| [4] | Andrews P, O’Brien EM (2000) Climate, vegetation, and predictable gradients in mammal species richness in southern Africa. Journal of Zoology, 251, 205-231. |
| [5] | Badgley C, Fox DL (2000) Ecological biogeography of North American mammals: Species density and ecological structure in relation to environmental gradients. Journal of Biogeography, 27, 1437-1467. |
| [6] | Bohning-Gaese K (1997) Determinants of avian species richness at different spatial scales. Journal of Biogeography, 24, 49-60. |
| [7] | Buckley LB, Jetz W (2007) Environmental and historical constraints on global patterns of amphibian richness. Proceedings of the Royal Society B: Biological Sciences, 274, 1167-1173. |
| [8] | Burnham KP, Anderson DR (1998) Model Selection and Inference: A Practical in Formation Theoretic Approach. Springer-Verlag, New York. |
| [9] | Costa GC, Nogueira C, Machado RB, Colli GR (2007) Squamate richness in the Brazilian Cerrado and its environmental-climatic associations. Diversity and Distributions, 6, 714-724. |
| [10] | Currie DJ (1991) Energy and large-scale patterns of animal- and plant-species richness. The American Naturalist, 137, 27-49. |
| [11] | Diniz-Filho JAF, Bini LM, Hawkins BA (2003) Spatial autocorrelation and red herrings in geographical ecology. Global Ecology & Biogeography, 12, 53-64. |
| [12] | Fei L, Ye CY, Jiang JP (2012) Colored Atlas of Chinese Amphibians and Their Distributions. Sichuan Science and Technology Press, Chengdu. (in Chinese) |
| [费梁, 叶昌媛, 江建平 (2012) 中国两栖动物及其分布彩色图鉴. 四川科学技术出版社, 成都.] | |
| [13] | Ford DC, Williams PW (1989) Karst Geomorphology and Hydrology. Unwin Hyman, London. |
| [14] | Gaston KJ (2000) Global patterns in biodiversity. Nature, 405, 220-227. |
| [15] | Guo Q, Kelt DA, Sun Z, Liu H, Hu L, Ren H, Wen J (2013) Global variation in elevational diversity patterns. Scientific Reports, 3, 3007. |
| [16] | Hanley JA, Mcneil BJ (1982) The meaning and use of the area under a Receiver Operating Characteristic (ROC) curve. Radiology, 143, 29-36. |
| [17] | Hawkins BA, Diniz-Filho JA, Jaramillo CA, Soeller SA (2007) Climate, niche conservatism, and the global bird diversity gradient. The American Naturalist, 170, S16-S27. |
| [18] | Hawkins BA, Field R, Cornell HV, Currie DJ, Guegan JF, Kaufman DM, Kerr JT, Mittelbach GG, Oberdorff T, O’Brien EM, Porter EE, Turner JRG (2003b) Energy, water, and broad-scale geographic patterns of species richness. Ecology, 84, 3105-3117. |
| [19] | Hawkins BA, Porter EE, Diniz JAF (2003a) Productivity and history as predictors of the latitudinal diversity gradient of terrestrial birds. Ecology, 84, 1608-1623. |
| [20] | Hou MF, López-pujol J, Qin HN, Wang LS, Liu Y (2010) Distribution pattern and conservation priorities for vascular plants in Southern China: Guangxi Province as a case study. Botanical Studies, 51, 377-386. |
| [21] | Huang Y, Dai Q, Chen Y, Wan HF, Li JT, Wang YZ (2011) Lizard species richness patterns in China and its environmental associations. Biodiversity and Conservation, 7, 1399-1414. |
| [22] | Jiménez-Valverde A, Peterson AT, Soberón J, Overton JM, Arago?n P, Lobo JM (2011) Use of niche models in invasive species risk assessments. Biological Invasions, 13, 2785-2797. |
| [23] | Kerr JT, Packer L (1997) Habitat heterogeneity as a determinant of mammal species richness in high-energy regions. Nature, 385, 252-254. |
| [24] | Legendre P (1993) Spatial autocorrelation: Trouble or new paradigm. Ecology, 74, 1659-1673. |
| [25] | Li JJ, Zhou CH, Cheng WM (2009) 1 : 1000000 Geomorphological Atlas of the People’s Republic of China. Science Press, Beijing. (in Chinese) |
| [李吉均, 周成虎, 程维明 (2009) 中华人民共和国1 : 100万地貌图. 科学出版社, 北京.] | |
| [26] | Luo ZH, Tang SH, Jiang ZG, Chen J, Fang HX, Li CW (2016) Conservation of terrestrial vertebrates in a global hotspot of karst area in Southwestern China. Scientific Reports, 6, 25717. |
| [27] | Mo YM, Wei ZY, Chen WC (2014) Color Atlas of Amphibians in Guangxi. Guangxi Science and Technology Press, Nanning. (in Chinese) |
| [莫运明, 韦振逸, 陈伟才 (2014) 广西两栖动物彩色图鉴. 广西科学技术出版社, 南宁.] | |
| [28] | New M, Lister D, Hulme M, Makin I (2002) A high-resolution data set of surface climate over global land areas. Climate Research, 21, 1-25. |
| [29] | Phillips SJ, Anderson RP, Schapire RE (2006) Maximum entropy modeling of species geographic distributions. Ecological Modelling, 190, 231-259. |
| [30] | Phillips SJ, Dudík MM (2008) Modeling of species distributions with Maxent: New extensions and a comprehensive evaluation. Ecography, 31, 161-175. |
| [31] | Powney GD, Grenyer R, Orme CDL, Owens IPF, Meiri S (2010) Hot, dry and different Australian lizard richness is unlike that of mammals, amphibians, and birds. Global Ecology & Biogeography, 19, 386-396. |
| [32] | Rahbek C, Graves GR (2001) Multiscale assessment of patterns of avian species richness. Proceedings of the National Academy of Sciences, USA, 98, 4534-4539. |
| [33] | Rangel TF, Diniz-Filho JAF, Bini LM (2010) SAM: A comprehensive application for spatial analysis in macroecology. Ecography, 33, 46-50. |
| [34] | Ricklefs RE (1987) Community diversity: Relative roles of local and regional processes. Science, 235, 167-171. |
| [35] | Ruggiero A, Kitzberger T (2004) Environmental correlates of mammal species richness in South America: Effects of spatial structure, taxonomy and geographic range. Ecography, 27, 401-417. |
| [36] | Schall JJ, Pianka ER (1978) Geographical trends in numbers of species. Science, 201, 679-686. |
| [37] | Schoener TW (1976) The species-area relationship within archipelagoes: Models and evidence from island birds. Proceedings of XVI International Ornithological Congress, Australian Academy of Science, Canberra, Australia. |
| [38] | Shen YH, Yang DD, Mo XY (2014) Fauna of Hunan: Amphibian. Hunan Science and Technology Press, Changsha. (in Chinese) |
| [沈猷慧, 杨道德, 莫小阳 (2014) 湖南动物志: 两栖纲. 湖南科学技术出版社, 长沙.] | |
| [39] | Shmida A, Wilson MV (1985) Biological determinants of species diversity. Journal of Biogeography, 12, 1-20. |
| [40] | Stuart SN, Chanson JS, Cox NA, Young BE, Rodrigues AS, Fischman DL, Waller RW (2004) Status and trends of amphibian declines and extinctions worldwide. Science, 306, 1783-1786. |
| [41] | Su ZM, Li XK (2003) The types of natural vegetation in karst region of Guangxi and its classified system. Guihaia, 23, 289-293. (in Chinese with English abstract) |
| [苏宗明, 李先琨 (2003) 广西岩溶植被类型及其分类系统. 广西植物, 23, 289-293.] | |
| [42] | Terribile LC, Olalla-Tárraga MA, Morales-Castilla I, Rueda M, Vidanes RM, Rodríguez MA, Diniz-Filho JA (2009) Global richness patterns of venomous snakes reveal contrasting influences of ecology and history in two different clades. Oecologia, 159, 617-626. |
| [43] | Tognelli MF, Kelt DA (2004) Analysis of determinants of mammalian species richness in South America using spatial autoregressive models. Ecography, 27, 427-436 |
| [44] | Wang SJ, Lu HM, Zhou YC, Xie LP, Xiao DA (2007) Spatial variability of soil organic carbon and representative soil sampling method in Maolan karst virgin forest. Acta Pedologica Sinica, 44, 475-483. (in Chinese with English abstract) |
| [王世杰, 卢红梅, 周运超, 谢丽萍, 肖德安 (2007) 茂兰喀斯特原始森林土壤有机碳的空间变异性与代表性土样采集方法. 土壤学报, 44, 475-483.] | |
| [45] | Wright DH (1983) Species-energy theory: An extension of species-area theory. Oikos, 41, 496-506. |
| [46] | Wu L, Dong Q, Xu RH (1987) Amphibians in Guizhou. Guizhou People’s Press, Guiyang. (in Chinese) |
| [伍律, 董谦, 须润华 (1987) 贵州两栖类志. 贵州人民出版社, 贵阳.] | |
| [47] | Xiong KN, Xiao SZ, Liu ZQ, Chen PD (2008) Comparative analysis on world natural heritage value of South China Karst. Engineering Science, 10, 17-28. (in Chinese with English abstract) |
| [熊康宁, 肖时珍, 刘子琦, 陈品冬 (2008) “中国南方喀斯特”的世界自然遗产价值对比分析. 中国工程科学, 10, 17-28.] | |
| [48] | Yang DT, Rao DQ (2008) Amphibians and Reptiles in Yunnan. Yunnan Science and Technology Press, Kunming. (in Chinese) |
| [杨大同, 饶定齐 (2008) 云南两栖爬行动物. 云南科技出版社, 昆明.] | |
| [49] | Yuan TX, Zhang HP, Ou ZY, Tan YB (2014) Effects of topography on the diversity and distribution pattern of ground plants in karst montane forests in Southwest Guangxi, China. Chinese Journal of Applied Ecology, 25, 2803-2810. (in Chinese with English abstract) |
| [袁铁象, 张合平, 欧芷阳, 谭一波 (2014) 地形对桂西南喀斯特山地森林地表植物多样性及分布格局的影响. 应用生态学报, 25, 2803-2810.] | |
| [50] | Zheng Z, Gong DJ, Sun CX, Li XJ, Li WJ (2014) Elevational pattern of amphibian and reptile diversity in Qinling Range and explanation. Biodiversity Science, 22, 596-607. (in Chinese with English abstract) |
| [郑智, 龚大洁, 孙呈祥, 李晓军, 李万江 (2014) 秦岭两栖、爬行动物物种多样性海拔分布格局及其解释. 生物多样性, 22, 596-607.] |
| [1] | 梁健超, 陈淑甜, 何文祥, 熊春妮, 许镇洲, 黄源欣, 刘源志弘, 张浪, 胡慧建. 广州市陆生野生脊椎动物资源——编目、分布与保护[J]. 生物多样性, 2026, 34(5): 25422-. |
| [2] | 夏东坡, 李静, 田军东, 黄中豪, 伍乘风, 陈仕望, 李进华. 中国野生猕猴属动物的研究进展[J]. 生物多样性, 2026, 34(3): 25460-. |
| [3] | 黄莉, 刘志发, 龚粤宁, 李步杭, 张健. 广东南岭16个1 ha森林动态监测样地植物群落组成与结构[J]. 生物多样性, 2026, 34(3): 25357-. |
| [4] | 罗熙, 王啟芳, 王建佳, 杨倩曦, 方鸿飞, 洪淼, 张琦, 蔡灵, 周曦杰, 黄丁勇, 郑新庆. 福建东山海域新记录种揭示我国北缘造礁石珊瑚群落多样性[J]. 生物多样性, 2026, 34(2): 25335-. |
| [5] | 周婷婷, 张浩淼, 王浩杰, 廖健, 陈晓丹, 杨楠, 韩博平, 刘振元. 广东省蜻蜓目物种多样性空间格局及关键影响因素[J]. 生物多样性, 2026, 34(2): 25337-. |
| [6] | 乔慧捷. 物种分布模型在宏观生态学和生物地理学中应用的思考[J]. 生物多样性, 2026, 34(1): 25238-. |
| [7] | 刘振元, 周婷婷, 王伟民, 韩博平, 谢志才. 城市化对深圳地区河流大型底栖无脊椎动物群落物种多样性和功能多样性的影响机制[J]. 生物多样性, 2025, 33(9): 25135-. |
| [8] | 冯缨, 宋凤, 金光照, Komiljon Tojibaev, 葛学军. 中亚荒漠区沙拐枣属的分布格局与物种多样性[J]. 生物多样性, 2025, 33(8): 25086-. |
| [9] | 范平, 温知新, 宋刚. 气候因子和人类活动对两栖及哺乳动物不同遗传多样性指标的影响[J]. 生物多样性, 2025, 33(8): 25022-. |
| [10] | 杨洋, 邹睿, 谯娅琴, 孟想, 涂飞云. 海南省陆生哺乳动物物种多样性[J]. 生物多样性, 2025, 33(8): 25044-. |
| [11] | 章洋, 王彦平. SLOSS争论研究进展: 分析方法、理论机制及保护实践[J]. 生物多样性, 2025, 33(7): 25081-. |
| [12] | 潘正东, 林熙戎, 薛华, 胡治颖, 郭弘艺, 张亚, 吴阿娜, 唐文乔. 上海主要内陆水体鱼类物种多样性本底及群落结构[J]. 生物多样性, 2025, 33(6): 24290-. |
| [13] | 彭文, 邓泽帅, 郑文宝, 龚凌轩, 曾玉枫, 孟昊, 陈军, 杨道德. eDNA技术在两栖动物调查中的应用: 以湖南莽山国家级自然保护区为例[J]. 生物多样性, 2025, 33(6): 24552-. |
| [14] | 张璐璐, 任昭杰, 于宁宁, 赵奉熙, 赵遵田. 甘肃省苔藓植物名录[J]. 生物多样性, 2025, 33(6): 24451-. |
| [15] | 吴晓晴, 张美惠, 葛苏婷, 李漫淑, 达良俊, 宋坤, 沈国春, 张健. 上海近自然林重建过程中木本植物物种多样性与地上生物量的时空动态: 以闵行区生态岛为例[J]. 生物多样性, 2025, 33(5): 24444-. |
| 阅读次数 | ||||||
|
全文 |
|
|||||
|
摘要 |
|
|||||
备案号:京ICP备16067583号-7
Copyright © 2026 版权所有 《生物多样性》编辑部
地址: 北京香山南辛村20号, 邮编:100093
电话: 010-62836137, 62836665 E-mail: biodiversity@ibcas.ac.cn
![]()