
Biodiv Sci ›› 2021, Vol. 29 ›› Issue (6): 790-797. DOI: 10.17520/biods.2021011 cstr: 32101.14.biods.2021011
• Technology and Methodology • Previous Articles Next Articles
Yi Zou*( )
)
Received:2021-01-08
Accepted:2021-04-26
Online:2021-06-20
Published:2021-06-08
Contact:
Yi Zou
Yi Zou. The calculation of β-diversity for different sample sizes[J]. Biodiv Sci, 2021, 29(6): 790-797.
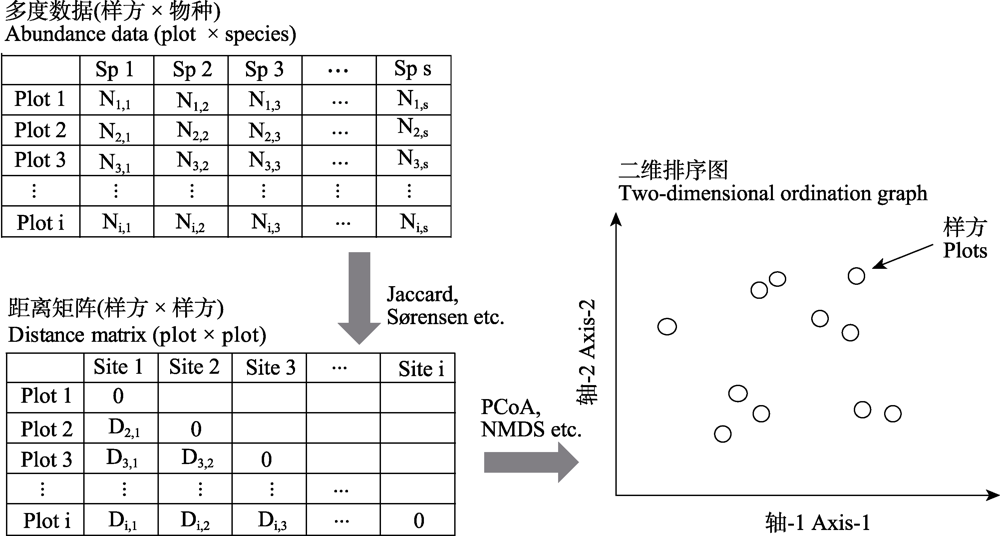
Fig. 1 Flow chart for converting plot × species multi-dimensional data into a two-dimensional ordination graph. The raw data can be calculated into a pair-wised distance matrix. The distance matrix can be descended into a two-dimensional ordination graph. One point in the ordination graph represents a sampling plot, while the distance between the points represents that the species composition between plot is dissimilar (distance is far) or similar (distance is relatively close).
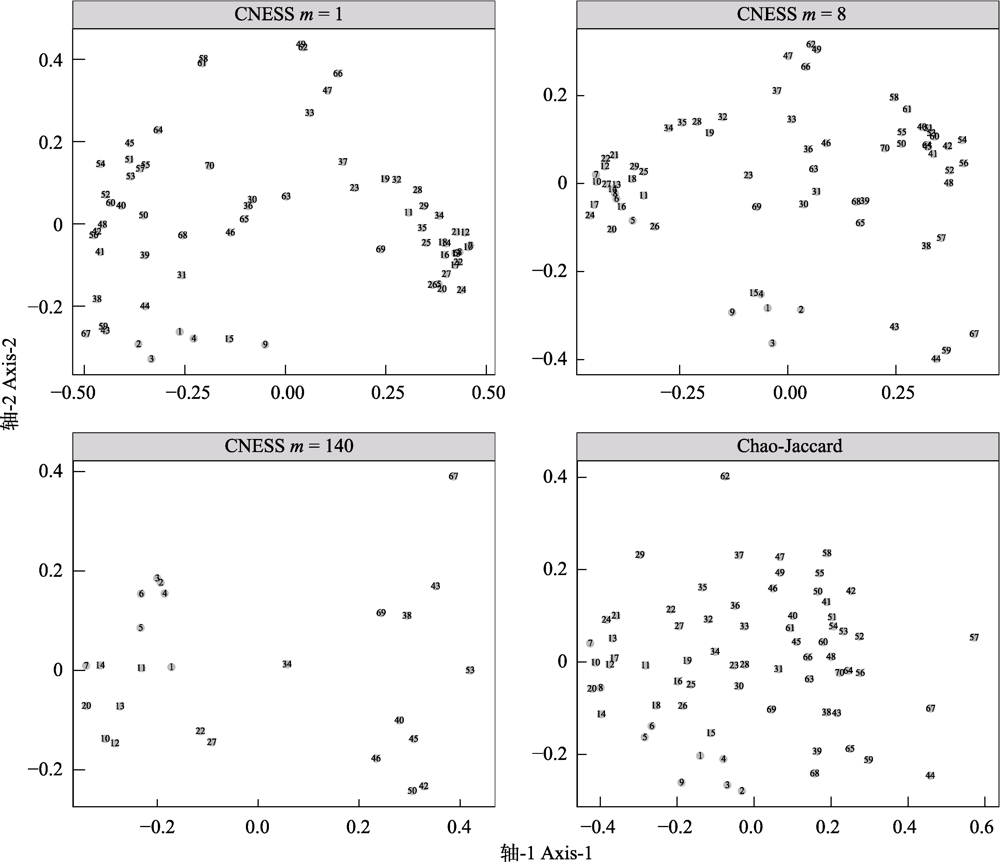
Fig. 2 Two-dimensional principal coordinates analysis (PCoA) plots based on chord-normalized expected species shared (CNESS) index with different sampling size parameter (m= 1, 8, 140) and based on the Chao-Jaccard index
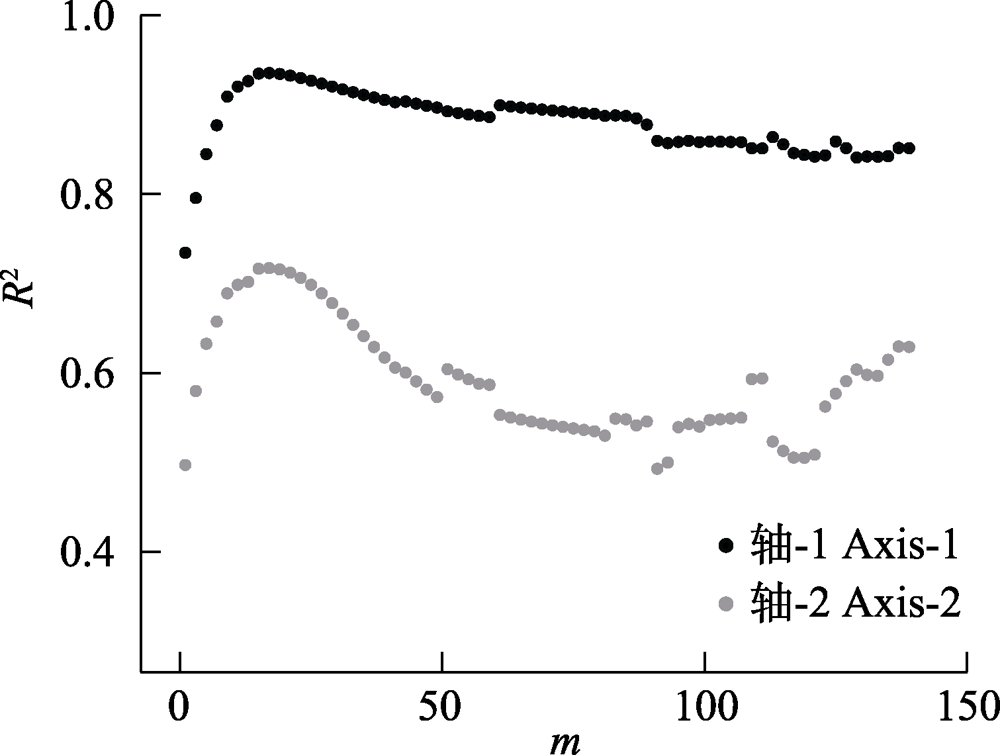
Fig. 3 Linear regression value (R2) between respective axes (Axis-1 and Axis-2) that generated by chord-normalized expected species shared (CNESS) index based and Chao-Jaccard based principal coordinates analysis (PCoA) plots at different m values
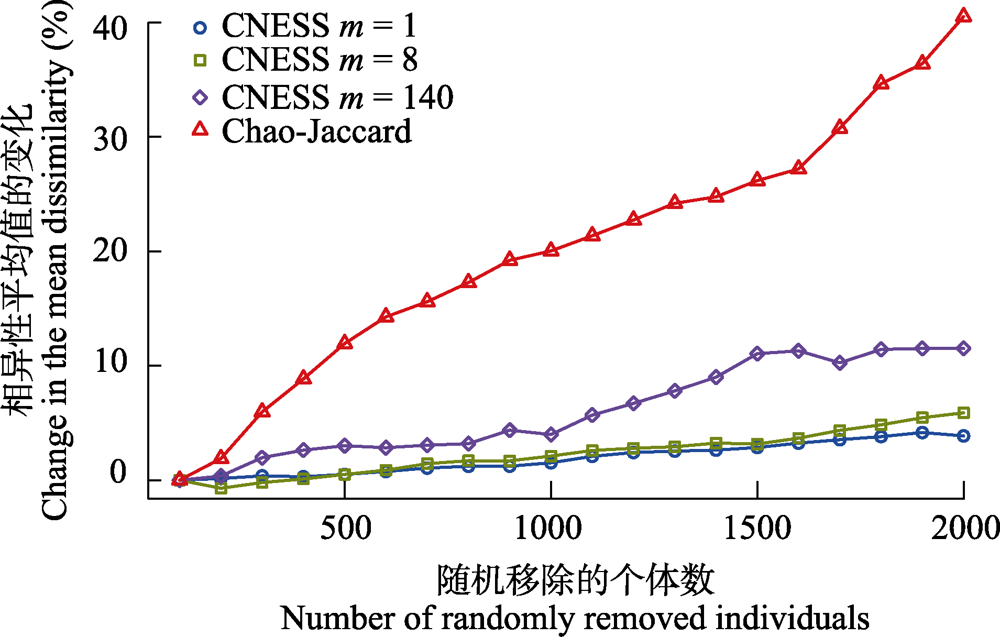
Fig. 4 Relationship between the changes of mean dissimilarity distance with the number of individuals randomly removed from the dataset for chord-normalized expected species shared (CNESS) index with different m value (m = 1, 8 and 140) and the Chao-Jaccard index
| [1] |
Beck J, Vun Khen C (2007) Beta-diversity of geometrid moths from northern Borneo: Effects of habitat, time and space. Journal of Animal Ecology, 76,230-237.
DOI URL |
| [2] |
Bonifácio P, Martínez Arbizu P, Menot L (2020) Alpha and beta diversity patterns of polychaete assemblages across the nodule province of the eastern Clarion-Clipperton Fracture Zone (equatorial Pacific). Biogeosciences, 17,865-886.
DOI URL |
| [3] | Borcard D, Legendre P (1994) Environmental control and spatial structure in ecological communities: An example using oribatid mites (Acari, Oribatei)(equatorial Pacific). Environmental and Ecological Statistics, 1,37-61. |
| [4] |
Chao A, Chazdon RL, Colwell RK, Shen TJ (2005) A new statistical approach for assessing similarity of species composition with incidence and abundance data. Ecology Letters, 8,148-159.
DOI URL |
| [5] | Chao A, Chiu C (2016) Species richness: Estimation and comparison. In: Wiley StatsRef: Statistics Reference Online (eds Balakrishnan N, Colton T, Everitt B, Piegorsch W, Ruggeri F, Teugels JL), pp. 1-26. John Wiley & Sons, Inc. |
| [6] |
Chen SB, Ouyang ZY, Xu WH, Xiao Y (2010) A review of beta diversity studies. Biodiversity Science, 18,323-335. (in Chinese with English abstract)
DOI |
|
陈圣宾, 欧阳志云, 徐卫华, 肖燚 (2010) Beta多样性研究进展. 生物多样性, 18,323-335.]
DOI |
|
| [7] |
Colwell RK, Chao A, Gotelli NJ, Lin SY, Mao CX, Chazdon RL, Longino JT (2012) Models and estimators linking individual-based and sample-based rarefaction, extrapolation and comparison of assemblages. Journal of Plant Ecology, 5,3-21.
DOI URL |
| [8] | Duan MC, Liu YH, Wang CL, Axmacher JC, Li LT, Yu ZR (2012) Diversity of geometrid moth (Lepidoptera: Geometridae) in cropland and reforested semi-natural habitats at different altitudes of Bashang Plateau, Hebei Province of China. Chinese Journal of Applied Ecology, 23,785-790. (in Chinese with English abstract) |
| 段美春, 刘云慧, 王长柳, Axmacher JC, 李良涛, 宇振荣 (2012) 坝上地区不同海拔农田和恢复半自然生境下尺蛾多样性. 应用生态学报, 23,785-790.] | |
| [9] | Gallagher ED (1998) Compah96. http://www.es.umb.edu/faculty/edg/files/pub/COMPAH.EXE (accessed on 2013-09-01) |
| [10] |
Grassle JF, Smith W (1976) A similarity measure sensitive to the contribution of rare species and its use in investigation of variation in marine benthic communities. Oecologia, 25,13-22.
DOI URL |
| [11] |
Hurlbert SH (1971) The nonconcept of species diversity: A critique and alternative parameters. Ecology, 52,577-586.
DOI PMID |
| [12] |
Koleff P, Gaston KJ, Lennon JJ (2003) Measuring beta diversity for presence-absence data. Journal of Animal Ecology, 72,367-382.
DOI URL |
| [13] |
Legendre P, Gallagher ED (2001) Ecologically meaningful transformations for ordination of species data. Oecologia, 129,271-280.
DOI PMID |
| [14] | Legendre P, Legendre L (2012) Numerical Ecology, 3rd edn. Elsevier, Amsterdam, |
| [15] |
Liu YH, Axmacher JC, Wang CL, Li LT, Yu ZR (2010) Ground beetles (Coleoptera: Carabidae) in the intensively cultivated agricultural landscape of Northern China—Implications for biodiversity conservation. Insect Conservation and Diversity, 3,34-43.
DOI URL |
| [16] | Ma KP (1994) Measurement of biotic community diversity. I. α diversity (Part 1). Chinese Biodiversity, 2,162-168. (in Chinese) |
| 马克平 (1994) 生物群落多样性的测度方法. I. α多样性的测度方法(上). 生物多样性, 2,162-168.] | |
| [17] | Melo AS (2014) CommEcol: Community Ecology Analyses. R package version 1.6.5. http://CRAN.R-project.org/package=CommEcol. (accessed on 2021-02-01) |
| [18] | Menot L (2019) ness: Hypergeometric standardization and probabilistic measures of similarity for community ecology. R package version 0.1.0, Zenodo. https://doi.org/10.5281/zenodo.3254750. (accessed on 2021-02-01) |
| [19] | Oksanen J, Blanchet FG, Kindt R, Legendre P, Minchin PR, O'Hara RB, Simpson GL, Solymos P, Stevens MRH, Wagner H (2018) vegan: Community Ecology Package. R package version 2.5-6. 10.1111/j.1654-1103.2003.tb02228.x. (accessed on 2021-02-01) |
| [20] | R Core Team (2020) R: A Language and Environment for Statistical Computing. Version 3.6.3, R Foundation for Statistical Computing, Vienna, Austria. |
| [21] | Schroeder PJ, Jenkins DG (2018) How robust are popular beta diversity indices to sampling error? Ecosphere, 9,e02100. |
| [22] |
Si XF, Zhao YH, Chen CW, Ren P, Zeng D, Wu LB, Ding P (2017) Beta-diversity partitioning: Methods, applications and perspectives. Biodiversity Science, 25,464-480. (in Chinese with English abstract)
DOI URL |
|
斯幸峰, 赵郁豪, 陈传武, 任鹏, 曾頔, 吴玲兵, 丁平 (2017) Beta多样性分解: 方法、应用与展望. 生物多样性, 25,464-480.]
DOI |
|
| [23] |
Simberloff D (1972) Properties of the rarefaction diversity measurement. The American Naturalist, 106,414-418.
DOI URL |
| [24] |
Smith W, Grassle JF (1977) Sampling properties of a family of diversity measures. Biometrics, 33,283-292.
DOI URL |
| [25] | Trueblood DD, Gallagher ED, Gould DM (1994) Three stages of seasonal succession on the Savin Hill Cove mudflat, Boston Harbor. Limnology and Oceanography,1440-1454. |
| [26] |
Tuomisto H (2010) A diversity of beta diversities: Straightening up a concept gone awry. Part 2. Quantifying beta diversity and related phenomena. Ecography, 33,23-45.
DOI URL |
| [27] |
Whittaker RH (1960) Vegetation of the Siskiyou Mountains, Oregon and California. Ecological Monographs, 30,279-338.
DOI URL |
| [28] |
Zou Y, Axmacher JC (2020) The Chord-Normalized Expected Species Shared (CNESS)-distance represents a superior measure of species turnover patterns. Methods in Ecology and Evolution, 11,273-280.
DOI |
| [29] | Zou Y, Axmacher JC (2021) Estimating the number of species shared by incompletely sampled communities. Ecography, 44,ecog.05625. |
| [30] |
Zou Y, Sang WG, Zhou HC, Huang LY, Axmacher JC (2014) Altitudinal diversity patterns of ground beetles (Coleoptera: Carabidae) in the forests of Changbai Mountain, Northeast China. Insect Conservation and Diversity, 7,161-171.
DOI URL |
| [1] | Hailong Zhang, Haiyan Nie, Mengmeng Liu, Meicai Wei, Zejian Li. Diversity patterns and influencing factors of sawflies in Mt. Wuyanling, Zhejiang Province, China [J]. Biodiv Sci, 2026, 34(5): 25459-. |
| [2] | Tingting Zhou, Haomiao Zhang, Haojie Wang, Jian Liao, Xiaodan Chen, Nan Yang, Bo-Ping Han, Zhenyuan Liu. Geographical patterns and key influence factors of Odonata species diversity in Guangdong Province [J]. Biodiv Sci, 2026, 34(2): 25337-. |
| [3] | Jiqi Gu, Jiangshan Lai, Ying Wang, Haoran Wu, Xue Zhang, Xiaotong Song, Xiaoming Shao, Anru Lou. Theoretical foundations, methodological advances, and applications of joint species distribution models with a focus on the HMSC framework in ecology [J]. Biodiv Sci, 2026, 34(1): 25364-. |
| [4] | Yi Zou. Alpha-diversity index selection: Simulation comparison under unequal sampling [J]. Biodiv Sci, 2026, 34(1): 25278-. |
| [5] | Shining Cao, Bohang Yu, Jingwen Li, Yiming Feng, Qi Lu, Jianming Wang. Distribution patterns and drivers of plant taxonomic, functional, and phylogenetic β-diversity in the black gobi desert region of China [J]. Biodiv Sci, 2025, 33(8): 25134-. |
| [6] | Nong Qiaoyi, Cao Jun, Cheng Wenda, Peng Yanqiong. Comparative study of monitoring methods for Apoidea resources and diversity [J]. Biodiv Sci, 2025, 33(4): 25057-. |
| [7] | Liu Zhixiang, Xie Hua, Zhang Hui, Huang Xiaolei. Functional diversity and regulation of cuticular hydrocarbons in social insects [J]. Biodiv Sci, 2025, 33(2): 24302-. |
| [8] | Zhenyuan Liu, Haomiao Zhang, Tingting Zhou, Yuxin Tan, Bo-Ping Han. A dataset on the checklist and geographical distributions of Odonata from Guangdong, China [J]. Biodiv Sci, 2025, 33(10): 25348-. |
| [9] | Qi Wu, Xiaoqing Zhang, Yuting Yang, Yibo Zhou, Yi Ma, Daming Xu, Xingfeng Si, Jian Wang. Spatio-temporal changes in biodiversity of epiphyllous liverworts in Qingyuan Area of Qianjiangyuan-Baishanzu National Park, Zhejiang Province [J]. Biodiv Sci, 2024, 32(4): 24010-. |
| [10] | Yaoqi Chen, Jingjing Guo, Guojun Cai, Yili Ge, Yu Liao, Zheng Dong, Hui Fu. Evolution characteristics of submerged macrophyte community diversity in the middle and lower reaches of the Yangtze River in the past seventy years (1954-2021) [J]. Biodiv Sci, 2024, 32(3): 23319-. |
| [11] | Zhirong Feng, Youcheng Chen, Yanqiong Peng, Li Li, Bo Wang. Ecological network analysis: From metacommunity to metanetwork [J]. Biodiv Sci, 2023, 31(8): 23171-. |
| [12] | Xiaocheng Chen, Pengzhan Zhang, Bin Kang, Linshan Liu, Liang Zhao. Species and functional diversity of the passerine birds in the Tibetan Plateau based on specimens from the collection of Northwest Institute of Plateau Biology, Chinese Academy of Sciences [J]. Biodiv Sci, 2023, 31(5): 22638-. |
| [13] | Yanping Wang, Minchu Zhang, Chengxiu Zhan. A review on the nested distribution pattern (nestedness): Analysis methods, mechanisms and conservation implications [J]. Biodiv Sci, 2023, 31(12): 23314-. |
| [14] | Yiru Han, Qiqi Xue, Houjuan Song, Jingyu Qi, Ruihe Gao, Shaopeng Cui, Lina Men, Zhiwei Zhang. Diversity and influencing factors of flower-visiting insects in the Yanshan area [J]. Biodiv Sci, 2022, 30(3): 21448-. |
| [15] | Jian Zhang, Hongzhi Kong, Xiaolei Huang, Shenglei Fu, Liangdong Guo, Qinghua Guo, Fumin Lei, Zhi Lü, Yurong Zhou, Keping Ma. Thirty key questions for biodiversity science in China [J]. Biodiv Sci, 2022, 30(10): 22609-. |
| Viewed | ||||||
|
Full text |
|
|||||
|
Abstract |
|
|||||
Copyright © 2026 Biodiversity Science
Editorial Office of Biodiversity Science, 20 Nanxincun, Xiangshan, Beijing 100093, China
Tel: 010-62836137, 62836665 E-mail: biodiversity@ibcas.ac.cn