
生物多样性 ›› 2011, Vol. 19 ›› Issue (2): 168-177. DOI: 10.3724/SP.J.1003.2011.10107 cstr: 32101.14.SP.J.1003.2011.10107
所属专题: 中国的森林生物多样性监测
程佳佳1,2, 米湘成2, 马克平2, 张金屯1,*( )
)
收稿日期:2010-04-28
接受日期:2010-08-12
出版日期:2011-03-20
发布日期:2011-06-01
通讯作者:
张金屯
作者简介:*E-mail: zhangjt@bnu.edu.cn;基金资助:
Jiajia Cheng1,2, Xiangcheng Mi2, Keping Ma2, Jintun Zhang1,*()
Received:2010-04-28
Accepted:2010-08-12
Online:2011-03-20
Published:2011-06-01
Contact:
Jintun Zhang
摘要:
为揭示物种多度格局随尺度的变化规律, 探讨多度格局形成的机理及生态学过程, 作者以古田山亚热带常绿阔叶林24 ha固定监测样地为背景, 采用断棍模型(broken stick model)、对数正态模型(lognormal distribution model)、生态位优先占领模型(preemption model)、Zipf模型(Zipf model)、Zipf-Mandelbrot模型(Zipf-Mandelbrot model)及中性理论模型(neutral model), 对不同尺度下的物种多度分布格局进行拟合, 并采用AIC检验和卡方检验选择最优拟合模型。结果表明, 不同尺度上适合的物种-多度曲线模型不同; 在取样边长为10 m和20 m时, 除中性模型外的5个模型均不能被拒绝, 它们均适合小尺度下的格局, 这表明在小的尺度上生态位过程对物种-多度曲线的格局贡献较大; 在取样边长为40 m时, 最适合的模型为对数正态模型; 取样边长为60 m和80 m时, Zipf-Mandelbrot模型为最优拟合模型; 在取样边长为100 m时, 尽管Zipf-Mandelbrot模型有最小的AIC值, 但卡方检验拒绝了除中性模型外的5个模型; 中性理论模型除了边长为10 m和20 m尺度以外, 在其他尺度上均比前面5种模型的预测效果更好。因此在研究物种多度分布规律时必须注意空间尺度的影响。研究结果表明随着尺度的增加, 中性过程成为决定物种-多度曲线格局的主要生态过程。
程佳佳, 米湘成, 马克平, 张金屯 (2011) 亚热带常绿阔叶林群落物种多度分布格局对取样尺度的响应. 生物多样性, 19, 168-177. DOI: 10.3724/SP.J.1003.2011.10107.
Jiajia Cheng, Xiangcheng Mi, Keping Ma, Jintun Zhang (2011) Responses of species-abundance distribution to varying sampling scales in a subtropical broad-leaved forest. Biodiversity Science, 19, 168-177. DOI: 10.3724/SP.J.1003.2011.10107.
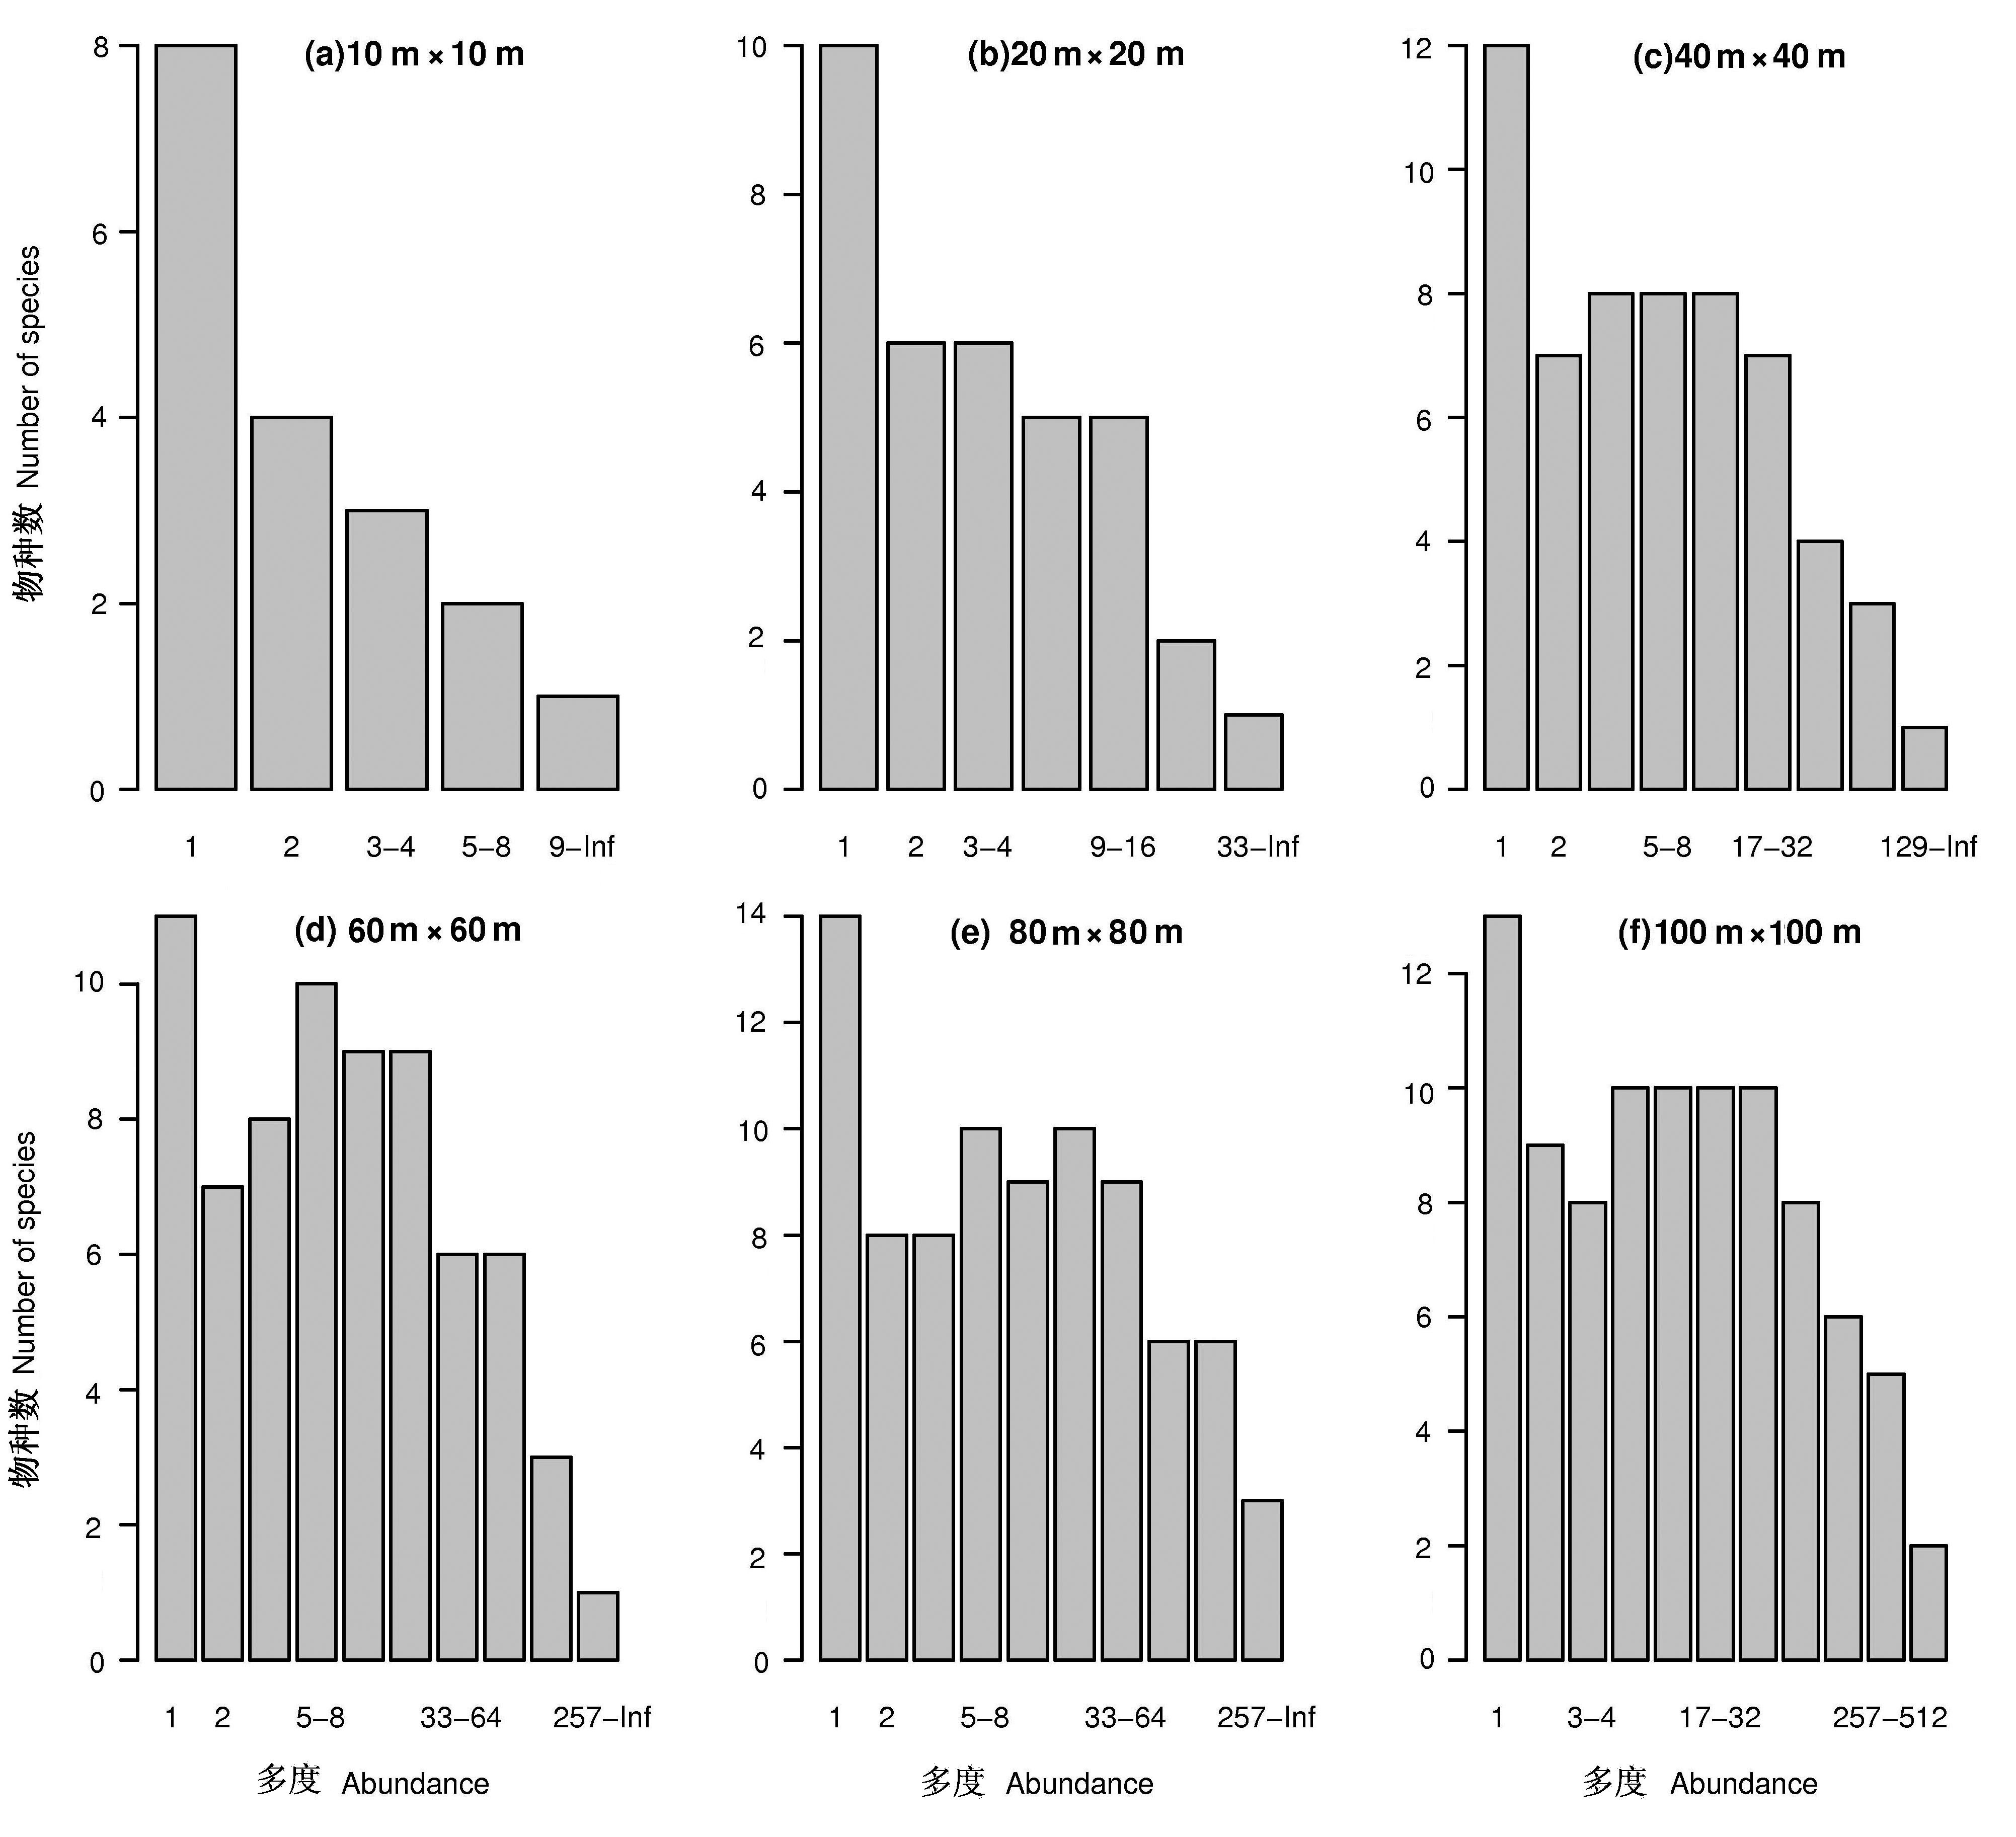
图1 古田山样地内不同尺度下物种-多度直方图。 (a)至(f)分别代表取样尺度为10 m×10 m, 20 m×20 m, 40 m×40 m, 60 m×60 m, 80 m×80 m, 100 m×100 m。
Fig. 1 Species-abundance diagram at different scales in the Gutianshan forest plot. (a) to (f) represent scales at 10 m×10 m, 20 m×20 m, 40 m× 40 m, 60 m× 60 m, 80 m× 80 m, 100 m× 100 m, respectively.
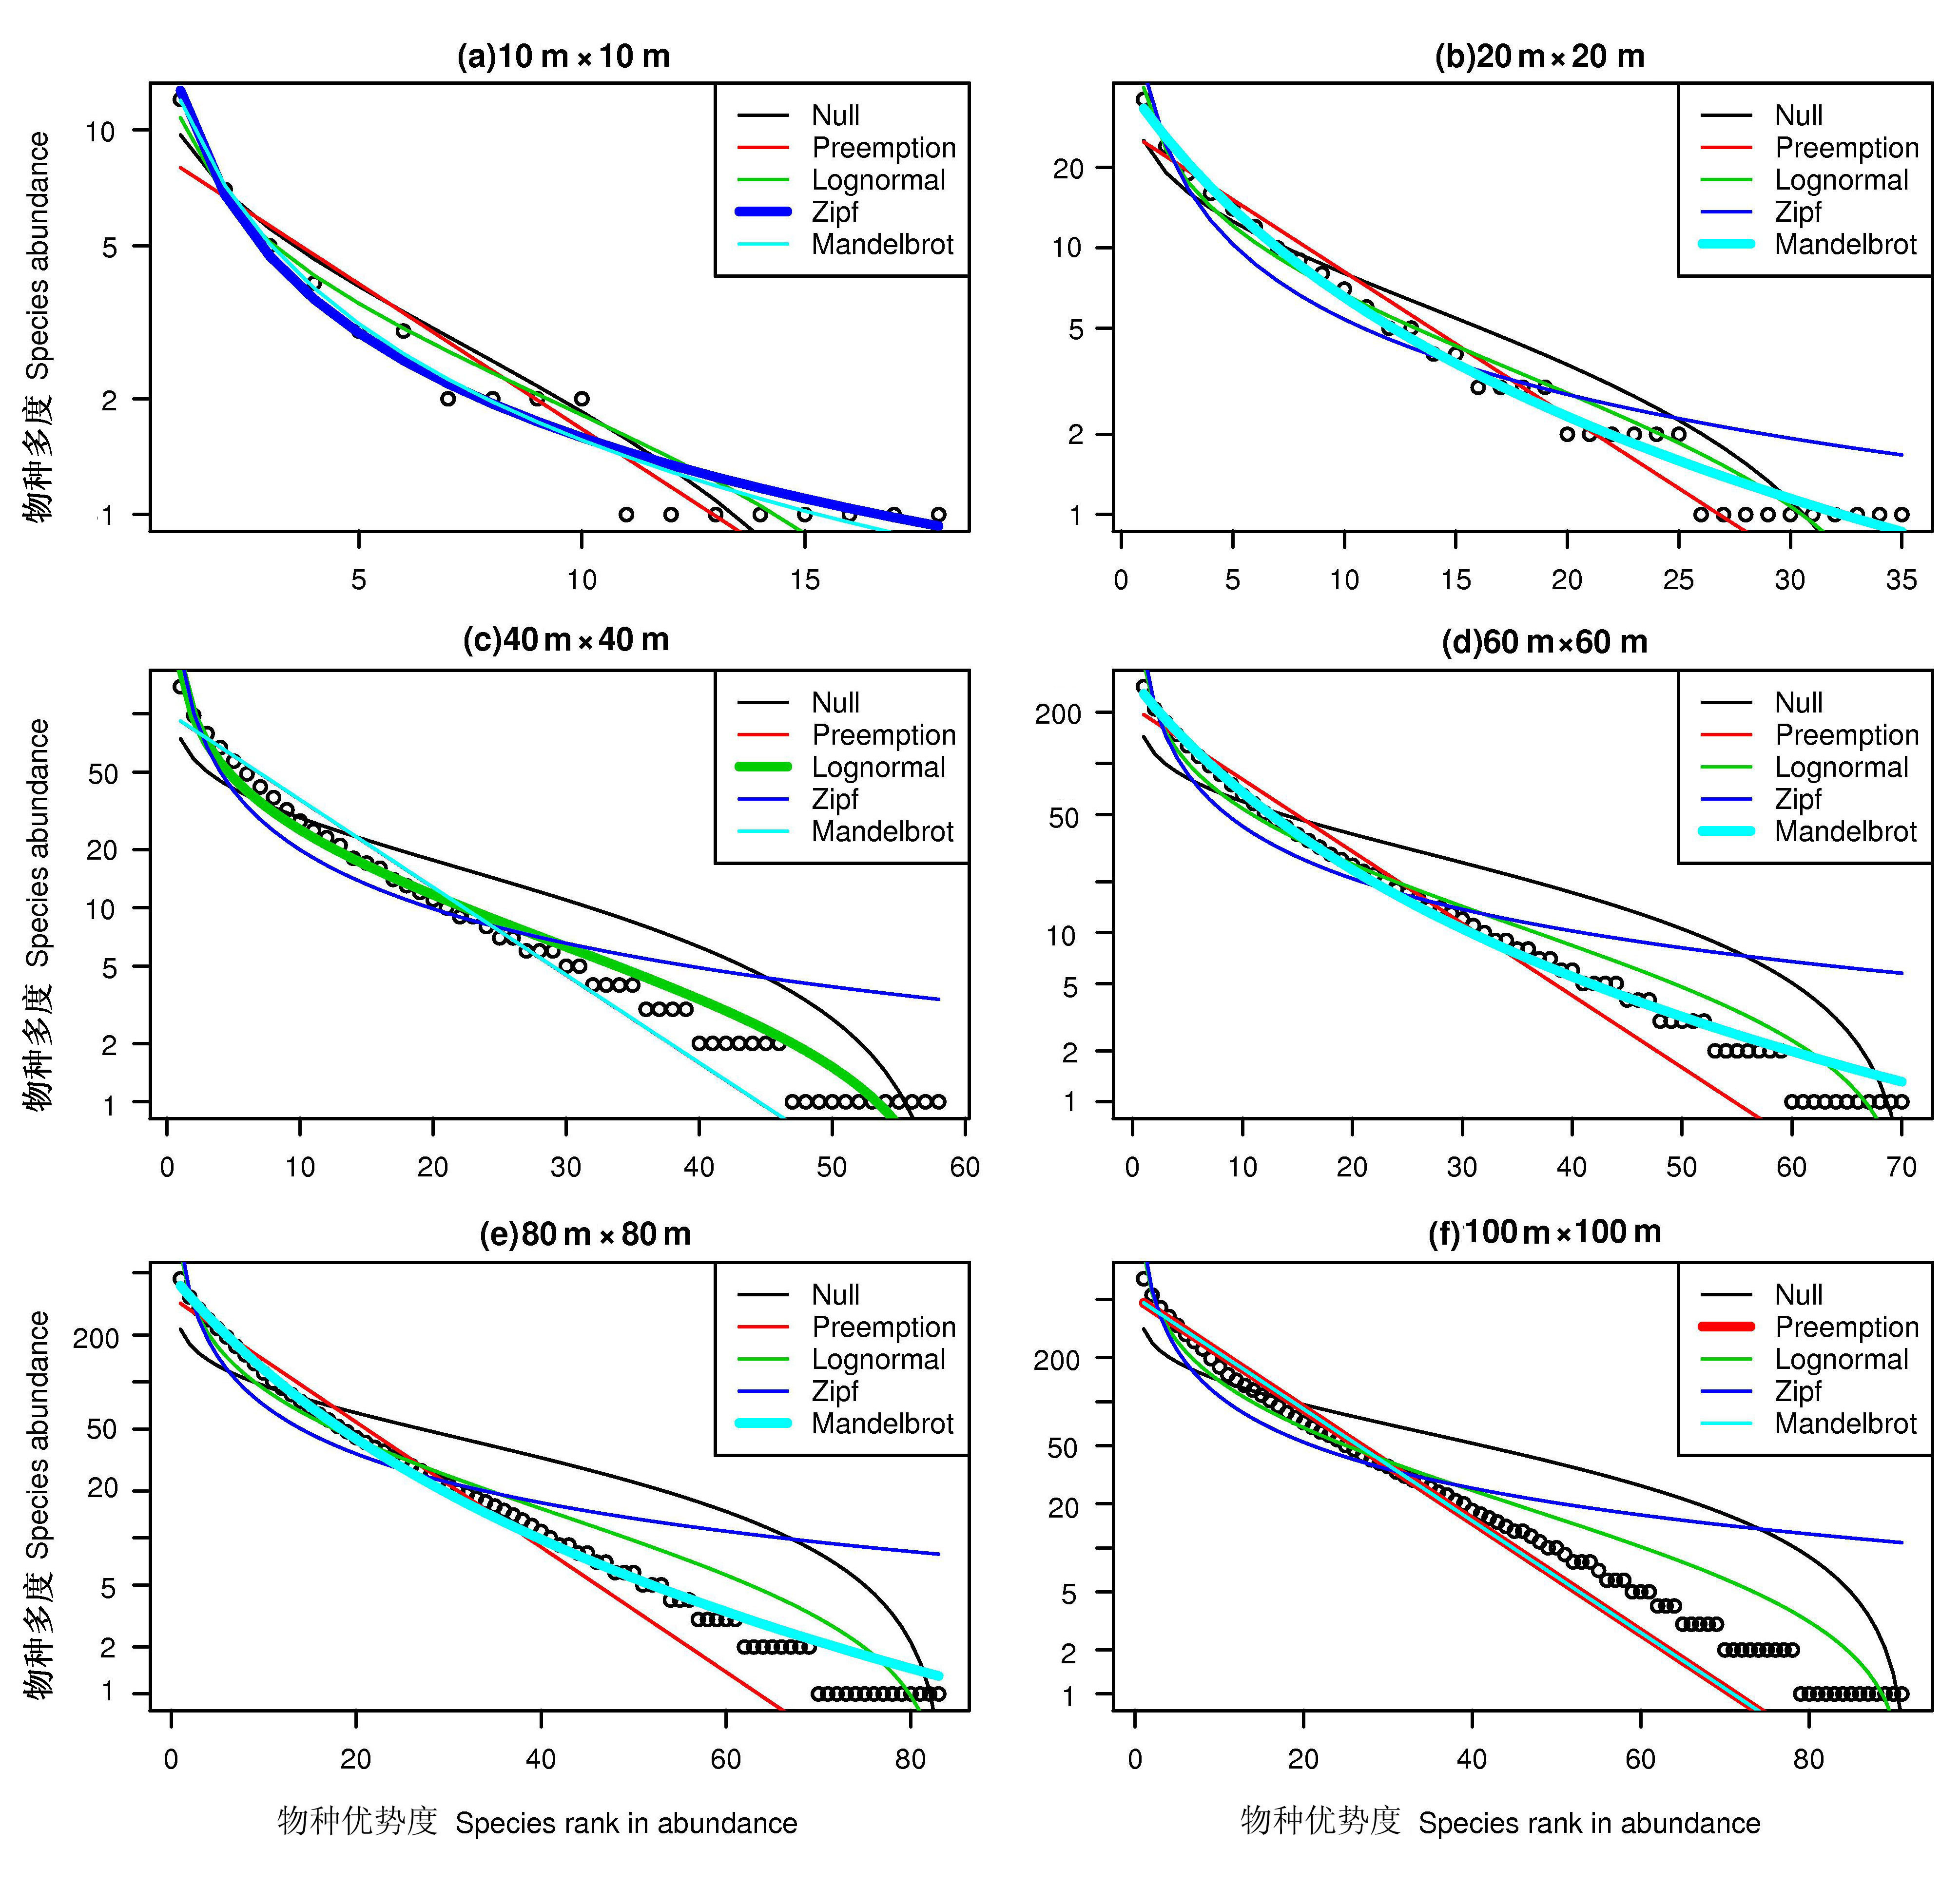
图2 古田山样地内物种-多度分布及模型拟合。 (a)到(f)分别代表取样尺度10 m×10 m, 20 m×20 m, 40 m×40 m, 60 m×60 m, 80 m×80 m, 100 m×100 m, 观测值以点表示, 加粗的线代表最优拟合的模型, 图中Null模型指Broken stick模型。
Fig. 2 Species-abundance distribution and fitting of five models at different scales in the Gutianshan forest plot. (a) to (f) represent rank-abundance plot and fitting of five models, the side length is 10 m×10 m, 20 m×20 m, 40 m×40 m, 60 m×60 m, 80 m×80 m, 100 m×100 m, respectively. Observed values are shown by points and the bold line represents the best fit, Null model represents the broken stick model.
| 尺度 Scale (m) | 断棍模型 Broken-stick model | 生态位优先占领模型Preemption model | 对数正态分布模型Lognormal model | Zipf模型 Zipf model | Zipf-Mandelbrot模型 Zipf-Mandelbrot model | |||||||||
|---|---|---|---|---|---|---|---|---|---|---|---|---|---|---|
| AIC值 AIC value | χ2 | AIC值 AIC value | χ2 | AIC值 AIC value | χ2 | AIC值 AIC value | χ2 | AIC值 AIC value | χ2 | |||||
| 10×10 | 52.56 | 8.43 | 53.49 | 4.79 | 53.46 | 2.56 | 52.02 | 0.68 | 53.86 | 0.53 | ||||
| 20×20 | 127.13 | 19.88 | 121.55 | 11.64 | 118.45 | 5.76 | 128.69 | 14.66 | 117.01 | 1.54 | ||||
| 40×40 | 426.65 | 211.94** | 269.89 | 61.44 | 248.21 | 30.58 | 345.71 | 116.99** | 273.88 | 61.28 | ||||
| 60×60 | 951.82 | 652.60** | 396.91 | 123.38** | 394.56 | 101.89** | 677.38 | 351.25** | 303.00 | 10.66 | ||||
| 80×80 | 1846.73 | 1447.40** | 532.84 | 202.88** | 611.01 | 241.87** | 1189.97 | 744.67** | 380.09 | 20.27 | ||||
| 100×100 | 2960.34 | 2473.56** | 690.07 | 315.33** | 830.5 | 391.90** | 1789.58 | 1213.33** | 694.07 | 315.22** | ||||
表1 不同尺度下5种模型的AIC值和χ2值
Table 1 AIC values of different models and χ2 fitting test at different sample scales
| 尺度 Scale (m) | 断棍模型 Broken-stick model | 生态位优先占领模型Preemption model | 对数正态分布模型Lognormal model | Zipf模型 Zipf model | Zipf-Mandelbrot模型 Zipf-Mandelbrot model | |||||||||
|---|---|---|---|---|---|---|---|---|---|---|---|---|---|---|
| AIC值 AIC value | χ2 | AIC值 AIC value | χ2 | AIC值 AIC value | χ2 | AIC值 AIC value | χ2 | AIC值 AIC value | χ2 | |||||
| 10×10 | 52.56 | 8.43 | 53.49 | 4.79 | 53.46 | 2.56 | 52.02 | 0.68 | 53.86 | 0.53 | ||||
| 20×20 | 127.13 | 19.88 | 121.55 | 11.64 | 118.45 | 5.76 | 128.69 | 14.66 | 117.01 | 1.54 | ||||
| 40×40 | 426.65 | 211.94** | 269.89 | 61.44 | 248.21 | 30.58 | 345.71 | 116.99** | 273.88 | 61.28 | ||||
| 60×60 | 951.82 | 652.60** | 396.91 | 123.38** | 394.56 | 101.89** | 677.38 | 351.25** | 303.00 | 10.66 | ||||
| 80×80 | 1846.73 | 1447.40** | 532.84 | 202.88** | 611.01 | 241.87** | 1189.97 | 744.67** | 380.09 | 20.27 | ||||
| 100×100 | 2960.34 | 2473.56** | 690.07 | 315.33** | 830.5 | 391.90** | 1789.58 | 1213.33** | 694.07 | 315.22** | ||||
| 尺度 Scale (m×m) | 物种数 Species number | 个体数 Individual number | 基础多样性指数 Fundamental diversity index | 迁移率 Migration rate | χ2 | df |
|---|---|---|---|---|---|---|
| 10×10 | 18 | 50 | 11.333 | 0.187834 | 2.342523 | 17 |
| 20×20 | 35 | 213 | 102.585 | 0.066637 | 3.400393 | 34 |
| 40×40 | 58 | 929 | 238.531 | 0.016876 | 7.143612 | 57 |
| 60×60 | 70 | 2082 | 14.983 | 0.558533 | 14.07298 | 69 |
| 80×80 | 83 | 3616 | 514.771 | 0.004573 | 30.10417 | 82 |
| 100×100 | 91 | 5623 | 360.503 | 0.00317 | 29.41639 | 90 |
表2 不同尺度下中性模型预测参数及χ2值
Table 2 Predicted parameters of neutral theory and χ2 fitting test at different sample scales
| 尺度 Scale (m×m) | 物种数 Species number | 个体数 Individual number | 基础多样性指数 Fundamental diversity index | 迁移率 Migration rate | χ2 | df |
|---|---|---|---|---|---|---|
| 10×10 | 18 | 50 | 11.333 | 0.187834 | 2.342523 | 17 |
| 20×20 | 35 | 213 | 102.585 | 0.066637 | 3.400393 | 34 |
| 40×40 | 58 | 929 | 238.531 | 0.016876 | 7.143612 | 57 |
| 60×60 | 70 | 2082 | 14.983 | 0.558533 | 14.07298 | 69 |
| 80×80 | 83 | 3616 | 514.771 | 0.004573 | 30.10417 | 82 |
| 100×100 | 91 | 5623 | 360.503 | 0.00317 | 29.41639 | 90 |
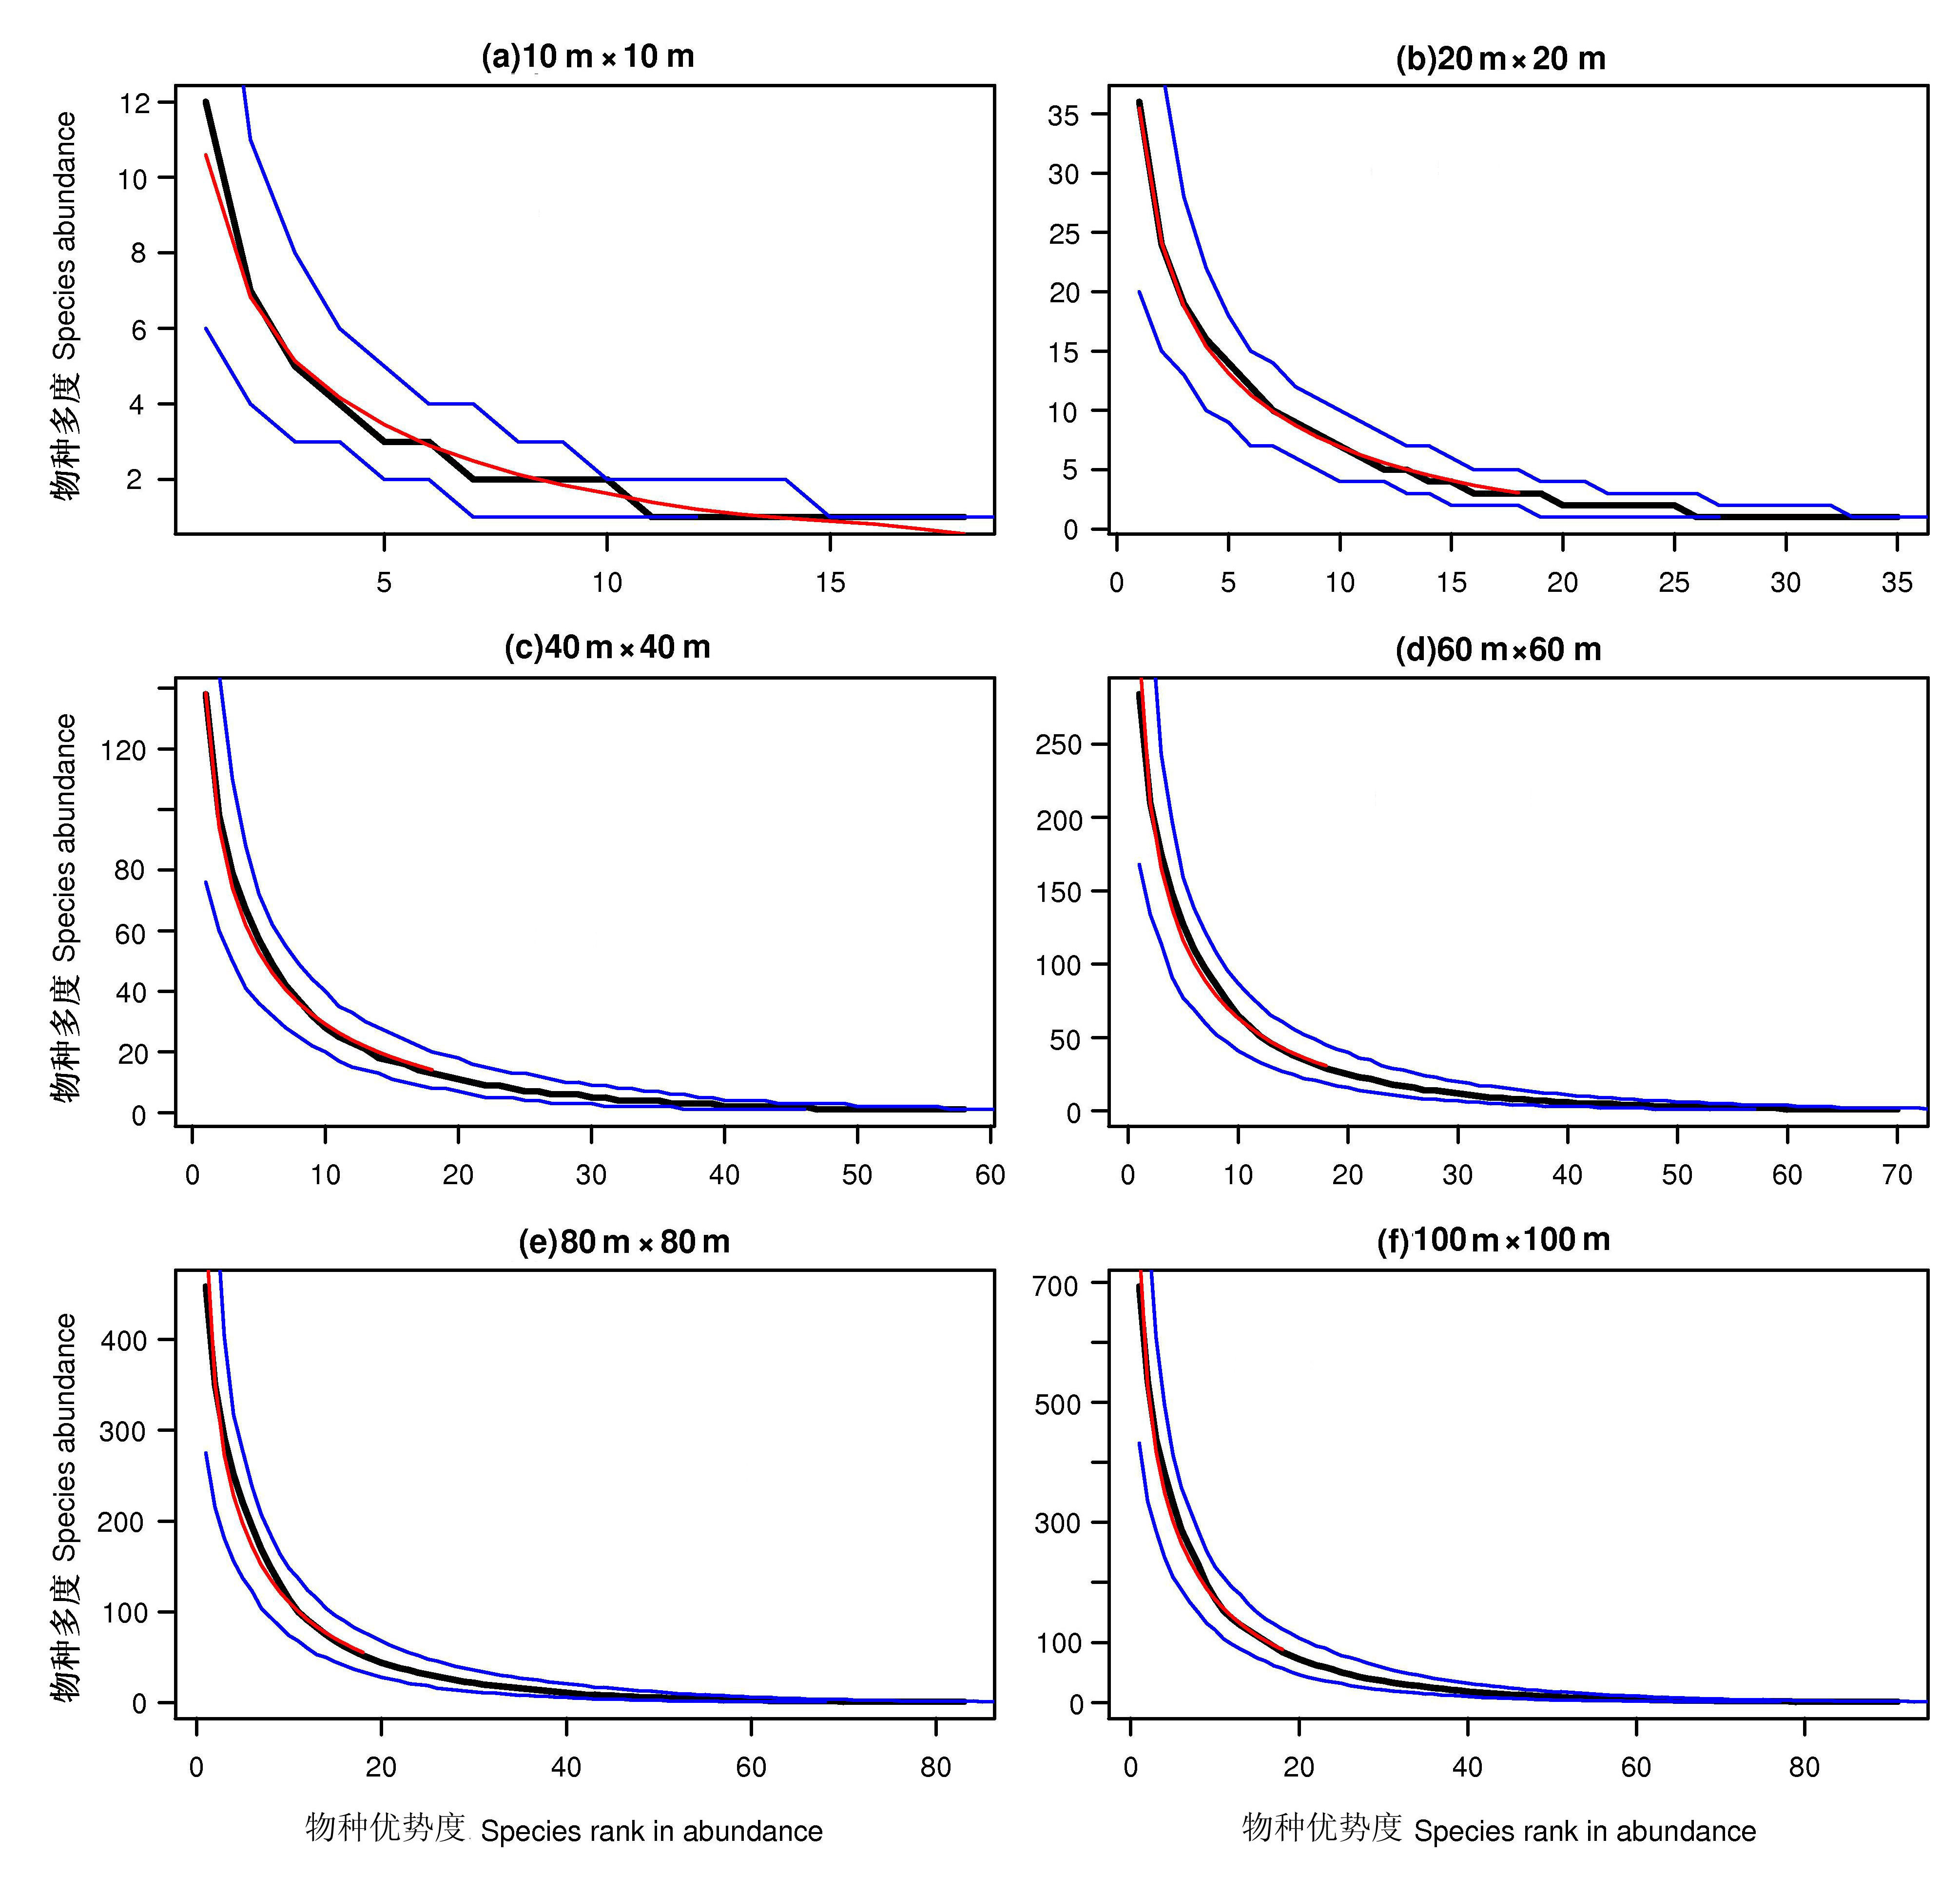
图3 中性模型模拟群落置信区间检验结果。 (a)至(f)分别代表取样尺度为10 m×10 m, 20 m×20 m, 40 m×40 m, 60 m×60 m, 80 m×80 m, 100 m×100 m。黑色线条表示实际观测多度分布曲线; 蓝色线条表示中性预测分布的95%置信区间的多度分布;红色线条表示中性模型预测多度分布。
Fig. 3 The tests of the neutral model by confidence interval method. (a) to (f) represent tests of the neutral theory of which the side length is 10 m, 20 m, 40 m, 60 m, 80 m, 100 m, respectively. Black lines are observed rank-abundance curves; Blue lines are 95%-confidence intervals; Red lines are expected rank-abundance curves by the standard neutral model.
| [1] | Burnham KP, Anderson DR (2002) Model Selection and Multi-Model Inference. A Practical Information—Theoretic Approach, 2nd edn. Springer-Verlag, New York. |
| [2] | Chave J (2004) Neutral theory and community ecology. Ecology Letters, 7, 241-253. |
| [3] | Chave J, Jabot F (2008) TeTame 2.0. http://www.edb.ups- tlse.fr/equipe1/tetame.htm (accessed 2009-09-20) |
| [4] | Chen JH (陈建华), Feng ZJ (冯志坚) (2002) Study on geographical compositions of seed plant flora in Gutianshan Mountain of Zhejiang Province. Journal of East China Normal University (Nature Science Edition) (华东师范大学学报: 自然科学版), (1), 104-111. (in Chinese with English abstract) |
| [5] | Du XG (杜晓光), Zhou SR (周淑荣) (2008) Testing the neutral theory of plant communities in subalpine meadow. Journal of Plant Ecology (Chinese Version) (植物生态学报), 32, 347-354. (in Chinese with English abstract) |
| [6] | Etienne RS (2005) A new sampling formula for neutral biodiversity. Ecology Letters, 8, 253-260. |
| [7] | Feng Y (冯云), Ma KM (马克明), Zhang YX (张育新), Qi J (祁建), Zhang JY (张洁瑜) (2007) Species abundance distribution of Quercus liaotungensis forest along altitudinal gradient in Dongling Mountain, Beijing. Acta Ecologica Sinica (生态学报), 27, 4743-4750. (in Chinese with English abstract) |
| [8] | Fisher RA, Corbe AS, Williams CB (1943) The relation between the number of species and the number of individuals in a random sample of an animal population. Journal of Animal Ecology, 12, 42-58. |
| [9] | Frontier S (1985) Diversity and structure in aquatic ecosystems. In: Oceanography and Marine Biology: An Annual Review (ed. Rnes M), pp. 253-312. Aberdeen University Press, Aberdeen. |
| [10] | Gong GQ (宫贵权), Cheng JM (程积民), Mi XC (米湘成), Chen SW (陈声文), Fang T (方腾) (2007) Habitat associations of wood species in the Gutianshan subtropical broad-leaved evergreen forest. Science of Soil and Water Conservation (中国水土保持科学), 5, 79-83. (in Chinese with English abstract) |
| [11] |
Green JL (2007) A statistical theory for sampling species abundances. Ecology Letters, 10, 1037-1045.
DOI URL PMID |
| [12] | Guo XY (郭逍宇), Zhang JT (张金屯), Gong HL (宮辉力), Zhang GL (张桂莲), Dong Z (董志) (2007) Species abundance patterns of artificial vegetation in Antaibao Open Mine. Scientia Silvae Sinicae (林业科学), 43(3), 118-121. (in Chinese with English abstract) |
| [13] |
Harpole WS, Tilman D (2006) Non-neutral patterns of species abundance in grassland communities. Ecology Letters, 9, 15-23.
DOI URL PMID |
| [14] | Hu ZH (胡正华), Yu MJ (于明坚), Ding BY (丁炳扬), Fang T (方腾), Qian HY (钱海源), Chen QC (陈启瑺) (2003) Types of evergreen broad-leaved forests and their species diversity in Gutian Mountain National Nature Reserve. Chinese Journal of Applied Environmental Biology (应用与环境生物学报), 9, 341-345. (in Chinese with English abstract) |
| [15] | Hubbell SP (2001) The unified neutral theory of biodiversity and biogeography. In: Monographs in Population Biology, p. 375. Princeton University Press, Princeton. |
| [16] | Hubbell SP (2005) Neutral theory in community ecology and the hypothesis of functional equivalence. Functional Ecology, 19, 166-172. |
| [17] |
Hubbell SP (2006) Neutral theory and the evolution of ecological equivalence. Ecology, 87, 1387-1398.
URL PMID |
| [18] | Hubbell SP, Borda-De-Água L (2004) The unified neutral theory of biodiversity and biogeography: reply. Ecology, 85, 3175-3178. |
| [19] |
Legendre P, Mi XC, Ren HB, Ma KP, Sun IF, Yu MJ, He FL (2009) Partitioning beta diversity in a subtropical broad- leaved forest of China. Ecology, 90, 663-674.
URL PMID |
| [20] | Liao CZ (廖成章), Xu YX (徐永兴), Liu J (柳江), Yan SJ (闫淑君), Bi XL (毕晓丽) (2004) Application of various patterns to the study on relative abundance of bird species in the Jiangshi Natural Reserve Zone of Fujian Province. Chinese Journal of Eco-Agriculture (中国生态农业学报), 12(2), 36-39. (in Chinese with English abstract) |
| [21] | Lou LH (楼炉焕), Jin SH (金水虎) (2000) Spermatophyta flora of Gutianshan Nature Reserve in Zhejiang. Journal of Beijing Forestry University (北京林业大学学报), 22(5), 33-39. (in Chinese with English abstract) |
| [22] | Ma KM (马克明) (2003) Advances of the study on species abundance pattern. Acta Phytoecologica Sinica (植物生态学报), 27, 412-426. (in Chinese with English abstract) |
| [23] | MacArthur RH (1957) On the relative abundance of bird species. Proceedings of the National Academy of Sciences, USA, 43, 293-295. |
| [24] | May RM (1975) Patterns of species abundance and diversity. In: Ecology and Evolution of Communities (eds Cody ML, Diamond JM), pp. 81-120. Harvard University Press, Cambridge. |
| [25] |
McGill BJ, Etienne RS, Gray JS, Alonso D, Anderson MJ, Benecha HK, Dornelas M, Enquist BJ, Green JL, He FL, Hurlbert AH, Magurran AE, Marquet PA, Maurer BA, Ostling A, Soykan CU, Ugland KI, White EP (2007) Species abundance distributions: moving beyond single prediction theories to integration within an ecological framework. Ecology Letters, 10, 995-1015.
DOI URL PMID |
| [26] |
McGill BJ, Maurer BA, Weiser MD (2006) Empirical evalua- tion of neutral theory. Ecology, 87, 1411-1423.
DOI URL PMID |
| [27] | Motomura I (1932) On the statistical treatment of communities. Zoological Magazine(Tokyo), 44, 379-383. (in Japanese) |
| [28] | Norris JL III, Pollock KH (1998) Non-parametric MLE for Poisson species abundance models allowing for heter- ogeneity between species. Environmental and Ecological Statistics, 5, 391-402. |
| [29] | Oksanen J, Kindt R, Legendre P, O'Hara B, Simpson GL, Solymos P, Henry M, Stevens H, Wagner H (2008) vegan: Community Ecology Package. R package version 1.15-0. http://cran.r-project.org/, http://vegan.r-forge.r-project.org/ |
| [30] | Preston FW (1948) The commonness, and rarity, of species. Ecology, 29, 254-283. |
| [31] | Purves DW, Pacala SW (2005) Ecological drift in niche- structured communities: neutral pattern does not imply neutral process. In: Biotic Interactions in Tropics: Their Roles in Maintenance of Species Diversity (eds Burslem D, Pinard M, Hartley S), pp.107-140. Cambridge University Press, Cambridge. |
| [32] | R Development Core Team (2008) R: A Language and Environment for Statistical Computing. R Foundation for Statistical Computing, Vienna, Austria. http://www.R-project. org/ (accessed 2010-03-11) |
| [33] | Romanuk TN, Kolasa J (2002) Environmental variability alters the relationship between species richness and community variability in natural rock pool microcosms. Ecoscience, 9, 55-62. |
| [34] | Song XF (宋喜芳), Li JP (李建平), Hu XY (胡希远) (2009) Model selection criterion AIC and its application in ANOVA. Journal of Northwest A & F University(Nature Science Edition)(西北农林科技大学学报(自然科学版)), 37(2), 88-92. (in Chinese with English abstract) |
| [35] | The PARI Group (2008) PARI/GP version 2.3.4. http://pari. math.u-bordeaux.fr/(accessed 2010-03-20) |
| [36] | Watkins AJ, Wilson JB (1994) Plant community structure, and its relation to the vertical complexity of communities: dominance/diversity and spatial rank consistency. Oikos, 70, 91-98. |
| [37] | Wilson JB (1991) Methods for fitting dominance/diversity curves. Journal of Vegetation Science, 2, 35-46. |
| [38] | Wu ZY (吴征镒) (1980) Vegetation of China (中国植被). Science Press, Beijing. (in Chinese) |
| [39] | Zhang JT (1999) Species abundance patterns in some broad- leaved deciduous forests in New York, USA. Acta Phytoecologica Sinica (植物生态学报), 23, 481-489. |
| [40] | Zhou SR (周淑荣), Zhang DY (张大勇) (2006) Neutral theory in community ecology. Journal of Plant Ecology (植物生态学报), 30, 868-877. (in Chinese with English abstract) |
| [41] | Zhu Y (祝燕), Zhao GF (赵谷风), Zhang LW (张俪文) , Shen GC (沈国春), Mi XC (米湘成), Ren HB (任海保), Yu MJ (于明坚), Chen JH (陈建华), Chen SW (陈声文), Fang T (方腾), Ma KP (马克平) (2008) Community composition and structure of Gutianshan forest dynamic plot in a mid-subtropical evergreen broad-leaved forest, East China. Journal of Plant Ecology (Chinese Version)(植物生态学报), 32, 262-273. (in Chinese with English abstract) |
| [1] | 徐伟强, 苏强. 分形模型与一般性物种多度分布关系的检验解析:以贝类和昆虫群落为例[J]. 生物多样性, 2024, 32(4): 23410-. |
| [2] | 张旋, 徐颖, 杨颜慈, 赵艳玲, 门中华, 王永龙. 孑遗植物半日花叶际真菌群落的多样性与构建机制[J]. 生物多样性, 2024, 32(3): 23384-. |
| [3] | 宋亮, 吴毅, 胡海霞, 刘文耀, 中村彰宏, 陈亚军, 马克平. 基于塔吊的林冠科学研究进展及展望[J]. 生物多样性, 2023, 31(12): 23363-. |
| [4] | 康佳鹏, 韩路, 冯春晖, 王海珍. 塔里木荒漠河岸林不同生境群落物种多度分布格局[J]. 生物多样性, 2021, 29(7): 875-886. |
| [5] | 刘旻霞, 李全弟, 蒋晓轩, 夏素娟, 南笑宁, 张娅娅, 李博文. 甘南亚高寒草甸稀有种对物种多样性和物种多度分布格局的贡献[J]. 生物多样性, 2020, 28(2): 107-116. |
| [6] | 方晓峰, 杨庆松, 刘何铭, 马遵平, 董舒, 曹烨, 袁铭皎, 费希旸, 孙小颖, 王希华. 天童常绿阔叶林中常绿与落叶物种的物种多度分布格局[J]. 生物多样性, 2016, 24(6): 629-638. |
| [7] | 张姗, 蔺菲, 原作强, 匡旭, 贾仕宏, 王芸芸, 索炎炎, 房帅, 王绪高, 叶吉, 郝占庆. 长白山阔叶红松林草本层物种多度分布格局及其季节动态[J]. 生物多样性, 2015, 23(5): 641-648. |
| [8] | 牛克昌, 刘怿宁, 沈泽昊, 何芳良, 方精云. 群落构建的中性理论和生态位理论[J]. 生物多样性, 2009, 17(6): 579-593. |
| 阅读次数 | ||||||
|
全文 |
|
|||||
|
摘要 |
|
|||||
备案号:京ICP备16067583号-7
Copyright © 2026 版权所有 《生物多样性》编辑部
地址: 北京香山南辛村20号, 邮编:100093
电话: 010-62836137, 62836665 E-mail: biodiversity@ibcas.ac.cn
![]()