
Biodiv Sci ›› 2012, Vol. 20 ›› Issue (1): 76-85. DOI: 10.17520/biods.2011131 cstr: 32101.14.biods.2011131
• Methodologies • Previous Articles Next Articles
Kunchi Lai1, Youhua Cheng1, Yuehchih Chen1, Yousheng Li2, Kwangtsao Shao1,*( )
)
Received:2011-07-29
Accepted:2012-01-15
Online:2012-01-20
Published:2012-02-14
Contact:
Kwangtsao Shao
Kunchi Lai, Youhua Cheng, Yuehchih Chen, Yousheng Li, Kwangtsao Shao. Applying cluster analysis and Google Maps in the study of large-scale species occurrence data[J]. Biodiv Sci, 2012, 20(1): 76-85.
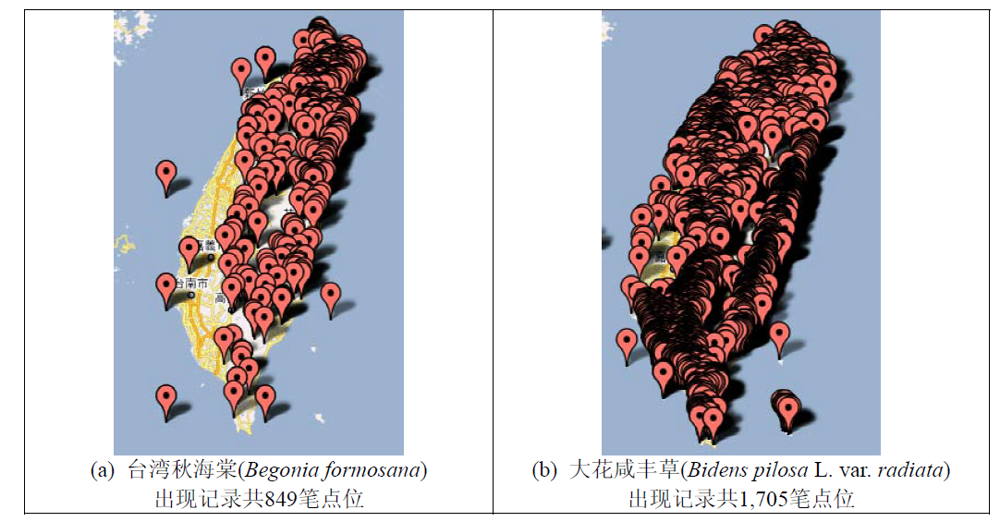
Fig. 1 Display of species occurrence data on the maps
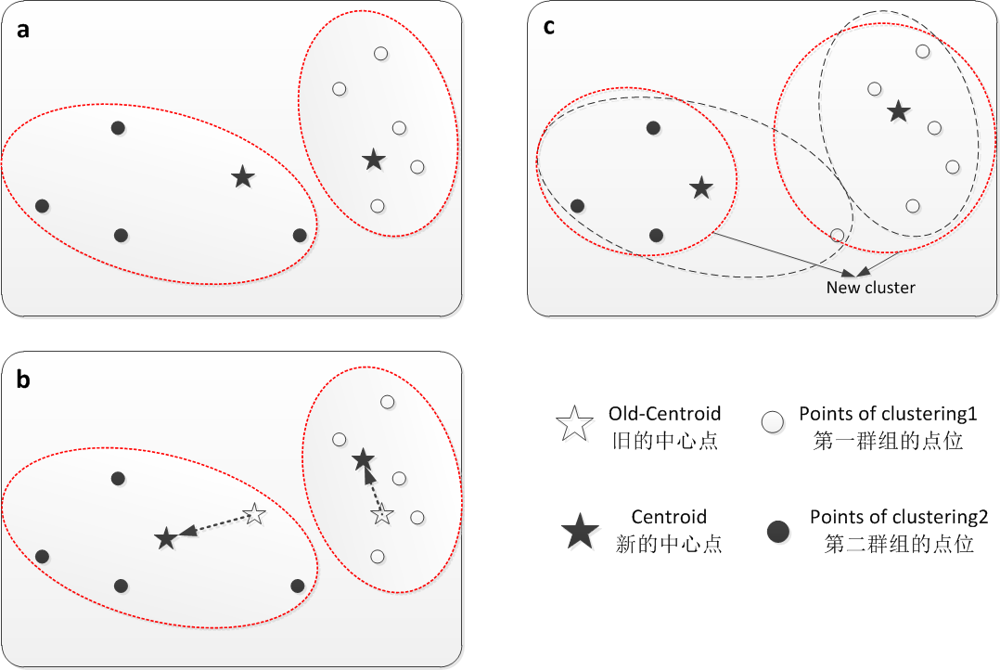
Fig. 2 The concept of K-means algorithm
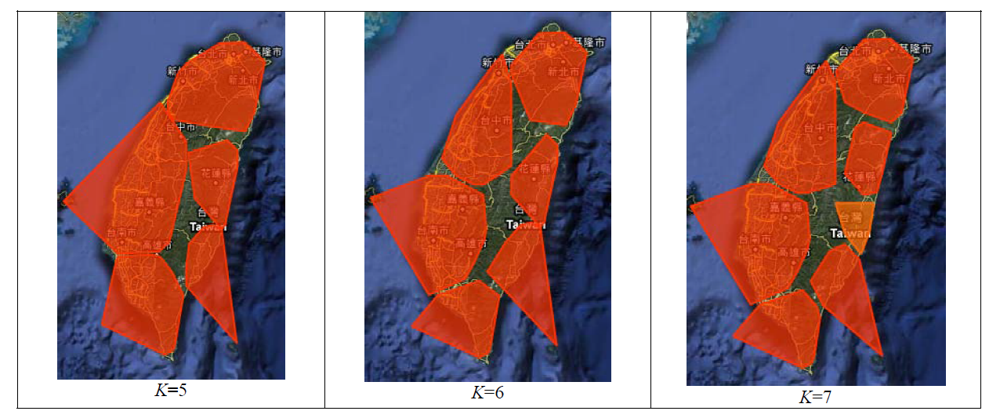
Fig. 3 Cluster analysis of Cyprinidae using different K-values
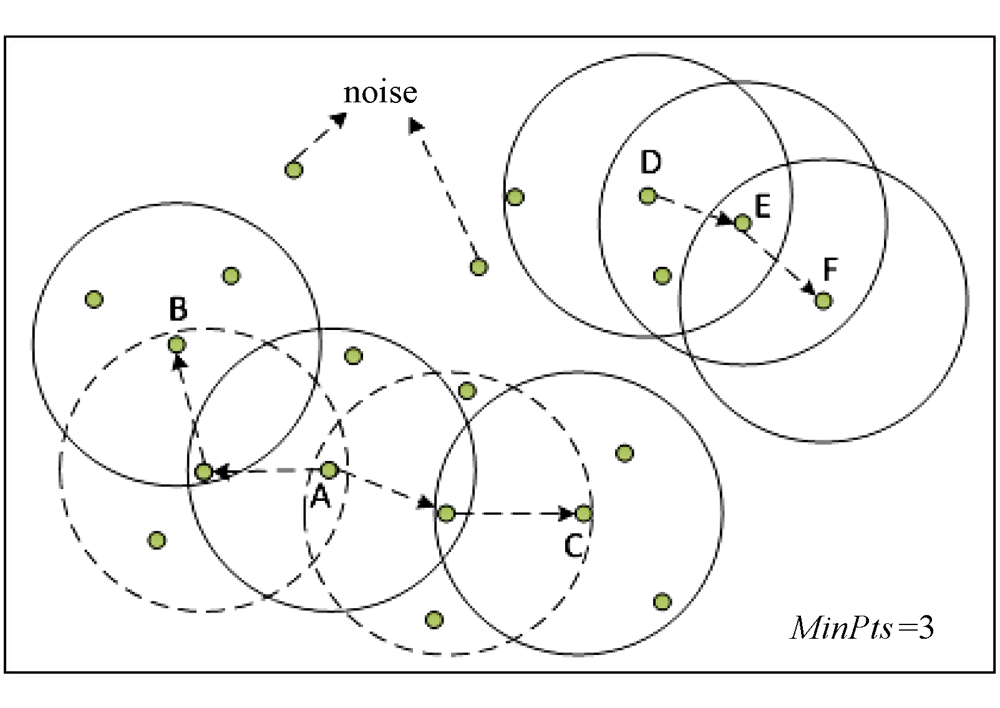
Fig. 4 Density-reachable and density-connected in DBSCAN clustering
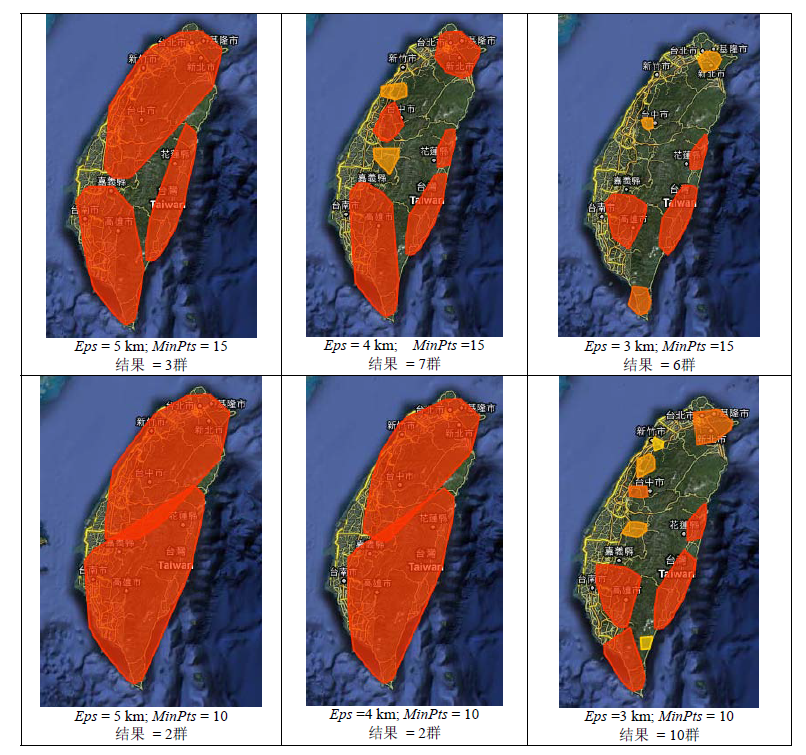
Fig. 5 Cluster analysis of Cyprinidae in Taiwan using different combinations of Eps and MinPts
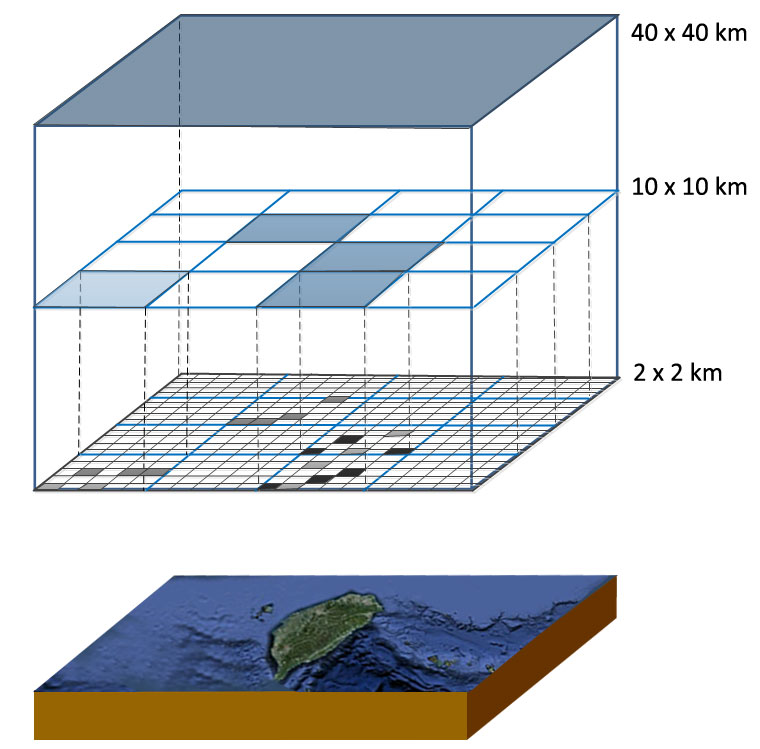
Fig. 6 The hierarchical structure of Statistical Information Grid (STING)
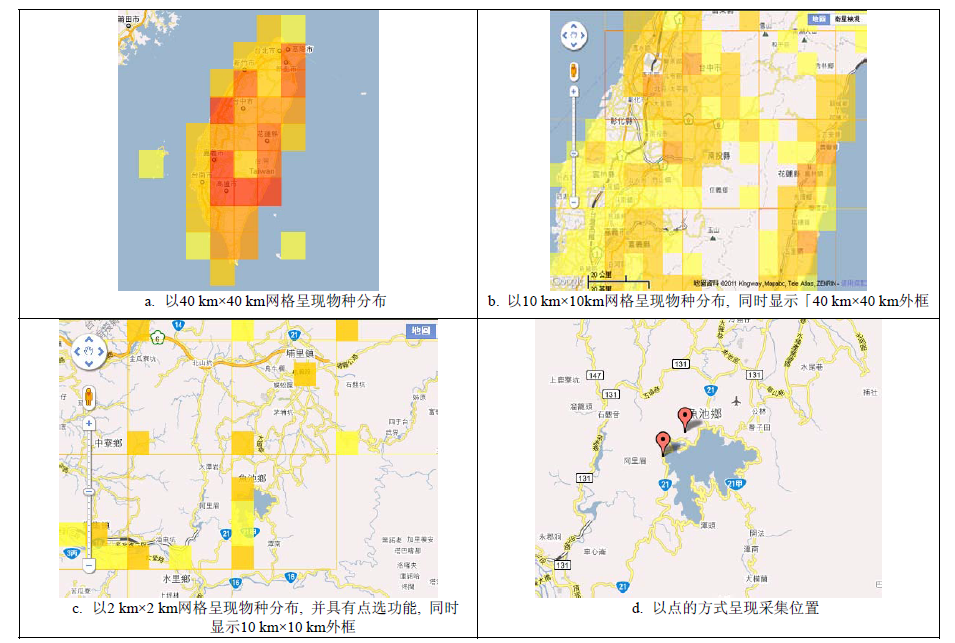
Fig. 7 Converts the coordinates of species occurrence data into colored grid squares of different spatial scales
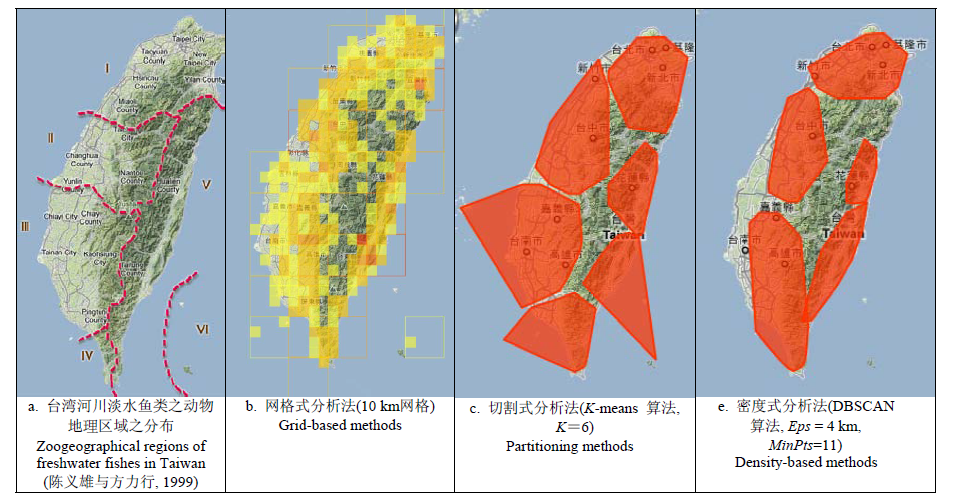
Fig. 8 Zoogeographical regions of freshwater fishes in Taiwan compare with three different cluster analysis methods
| 网格式分析法 Grid-based methods | 切割式分析法 Partitioning methods | 密度式分析法 Density-based methods | |
|---|---|---|---|
| 参数设定 Parameter settings | 容易, 只需决定每层网格边长 Easy; only need to determine length of grid for each level | 容易, 只需决定分的群数(K) Easy; only need to determine K | 困难, 需要反复调整MinPts与Eps两参数 Hard; need to adjust MinPtsandEpsrepetitively |
| 计算效能 Computing efficiency | 快。时间复杂度为O(n) Fast; time complexity is O(n) | 慢。时间复杂度为O(kmn) Slowest; time complexity isO(kmn) | 中。时间复杂度为O(nlgn) Slow; time complexity isO(nlgn) |
| 噪声或偏离值处理 Processing of noise or outliers | 无 No | 无 No | 有 Yes |
| 与Google Map的可视化呈现(此处是指Google Map上程序撰写的难易度) Programming for Google map visualizations | 较为困难 Hard | 较为容易 Easy | 较为容易 Easy |
| 依据地图分辨率而改变聚类分析结果(具有阶层变化) Display of cluster analysis results on a map using different scales | 有, 以本研究为例提供3种网格尺度 Easy; the study has three different spatial scales | 无 No | 无 No |
| 呈现物种分布的概括 Presentation of species distribution | 不容易看出 Difficult to spot distribution | 接近 Easy to spot and more precise | 较接近 Easy to spot and most precise |
Table 1 Comparison of three different cluster analysis methods: a case study of Cyprinidae distribution
| 网格式分析法 Grid-based methods | 切割式分析法 Partitioning methods | 密度式分析法 Density-based methods | |
|---|---|---|---|
| 参数设定 Parameter settings | 容易, 只需决定每层网格边长 Easy; only need to determine length of grid for each level | 容易, 只需决定分的群数(K) Easy; only need to determine K | 困难, 需要反复调整MinPts与Eps两参数 Hard; need to adjust MinPtsandEpsrepetitively |
| 计算效能 Computing efficiency | 快。时间复杂度为O(n) Fast; time complexity is O(n) | 慢。时间复杂度为O(kmn) Slowest; time complexity isO(kmn) | 中。时间复杂度为O(nlgn) Slow; time complexity isO(nlgn) |
| 噪声或偏离值处理 Processing of noise or outliers | 无 No | 无 No | 有 Yes |
| 与Google Map的可视化呈现(此处是指Google Map上程序撰写的难易度) Programming for Google map visualizations | 较为困难 Hard | 较为容易 Easy | 较为容易 Easy |
| 依据地图分辨率而改变聚类分析结果(具有阶层变化) Display of cluster analysis results on a map using different scales | 有, 以本研究为例提供3种网格尺度 Easy; the study has three different spatial scales | 无 No | 无 No |
| 呈现物种分布的概括 Presentation of species distribution | 不容易看出 Difficult to spot distribution | 接近 Easy to spot and more precise | 较接近 Easy to spot and most precise |
| [1] | Chapman AD (2005) Uses of primary species-occurrence data, version 1.0, Global Biodiversity Information Facility. |
| [2] | Chen IS (陈义雄), Fang LS (方力行) (1999) The Freshwater and Estuarine Fishes of Taiwan (台湾淡水及河口鱼类志). Museum of Marine Biology and Aquarium, Taiwan. (in Chinese) |
| [3] | Encyclopedia of Life (2011) Retrieved from http://www.eol.org, Accessed 2011-07-01. |
| [4] | Ester M, Kriegel HP, Sander J, Xu X (1998) Clustering for mining in large spatial databases. Special Issue on Data Mining, KI-Journal, ScienTec Publishing, 1,1-7. |
| [5] | Flemons P, Guralnick R, Krieger J, Ranipeta A, Neufeld D (2007) A web-based GIS tool for exploring the world's biodiversity: The Global Biodiversity Information Facility Mapping and Analysis Portal Application (GBIF-MAPA). Ecological Informatics, 2(1),49-60. |
| [6] | GBIF Data Portal (2011) Retrieved from http://data.gbif.org, Accessed 2011-07-01. |
| [7] | Han J, Kamber M (2006) Data Mining: Concepts and Techniques, 2nd edn. Morgan Kaufmann Publishers, Amsterdam. |
| [8] |
Hijmans RJ, Spooner DM (2001) Geographic distribution of wild potato species. American Journal of Botany, 88,2101-2112.
URL PMID |
| [9] |
Hill AW, Guralnick RP, Flemons P, Beaman R, Wieczorek J, Ranipeta A, Chavan V, Remsen D (2009) Location, location, location: utilizing pipelines and services to more effectively georeference the world’s biodiversity data. BMC Bioinformatics, 10,S3.
URL PMID |
| [10] | Hill AW, Otegui J, Ariño AH, Guralnick RP (2010) GBIF Position Paper on Future Directions and Recommendations for Enhancing Fitness-for-Use Across the GBIF Network, version 1.0. Copenhagen: Global Biodiversity Information Facility, 25. |
| [11] | Jaffe A, Naaman M, Tassa T, Davis M (2006) Generating summaries and visualization for large collections of geo-referenced photographs. In: Proceedings of the 8th ACM International Workshop on Multimedia Information Retrieval, pp.89-98. |
| [12] | Liu X, Hui Y, Sun W, Liang H (2007) Towards Service Composition Based on Mashup. In: 2007 IEEE Congress on Services,332-339. |
| [13] | Miller HJ, Han J (2009) Geographic Data Mining and Knowledge Discovery, 2nd edn. CRC Press. |
| [14] | Mucke E (2009) Computing Prescriptions: Quickhull: Computing Convex Hulls Quickly. Computing in Science Engineering, 11(5),54-57. |
| [15] | Peterson AT, Knapp S, Guralnick R, Soberón J, Holder MT (2010) The big questions for biodiversity informatics. Systematics and Biodiversity, 8(2),159-168. |
| [16] | Proj4 (2011) Retrieved from http://trac.osgeo.org/proj/, Accessed 2011-07-01. |
| [17] | Shao KT, Peng CI, Yen E, Lai KC, Wang MC, Lin J, Yang A, Chen SY (2007) Integration of biodiversity databases in Taiwan and linkage to global databases. Data Science Journal, 6,S2-S10. |
| [18] | Shao KT (邵广昭), Lai KC (赖昆祺), Lin YC (林永昌), Ko CJ (柯智仁), Lee H (李瀚), Hung LY (洪铃雅), Chen YC (陈岳智), Chen LS (陈丽西) (2010) Experience and strategy of biodiversity data integration in Taiwan, Biodiversity Science (生物多样性), 18,444-453. (in Chinese with English abstract) |
| [19] | Tang M, Zhou Y, Cui P, Wang W, Li J, Zhang H, Hou Y, Yan B (2009) Discovery of migration habitats and routes of wild bird species by clustering and association analysis. Advan- ced Data Mining and Applications, 5678,288-301. |
| [20] | Wu X, Kumar V, Quinlan JR, Ghosh J, Yang Q, Motoda H, McLachlan GJ, Ng A, Liu B, Yu PS, Zhou ZH, Steinbach M, Hand DJ, Steinberg D (2008) Top 10 algorithms in data mining. Knowledge and Information Systems, 14(1),1-37. |
| [21] | Zang N, Rosson MB, Nasser V (2008) Mashups: who? what? why? Proceedings of CHI '08 Extended Abstracts on Human Factors in Computing Systems, 3171-3176. |
| [1] | Shang Huadan, Zhang Chuqing, Wang Mei, Pei Wenya, Li Guohong, Wang Hongbin. Species diversity and geographic distribution of poplar pests in China [J]. Biodiv Sci, 2025, 33(2): 24370-. |
| [2] | Xiangzhang Wu, Fumin Lei, Yiyi Shan, Jing Yu. Distribution pattern of bryophyte diversity and environmental impact factors in urban parks of Shanghai [J]. Biodiv Sci, 2024, 32(2): 23364-. |
| [3] | Chenchen Ding, Dongni Liang, Wenpei Xin, Chunwang Li, Eric I. Ameca, Zhigang Jiang. A dataset on the morphological, life-history and ecological traits of the mammals in China [J]. Biodiv Sci, 2022, 30(2): 21520-. |
| [4] | Tongyi Liu, Jing Chen, Liyun Jiang, Gexia Qiao. Annual report of new taxa for Chinese Hemiptera and 28 other orders of Insecta in 2020 [J]. Biodiv Sci, 2021, 29(8): 1050-1057. |
| [5] | Dan Liu, Zhongling Guo, Xiaoyang Cui, Chunnan Fan. Comparison of five associations of Taxus cuspidata and their species diversity [J]. Biodiv Sci, 2020, 28(3): 340-349. |
| [6] | Fengzhen Wang, Yi Tang. Determination of key species in the food web and their impact on the robustness [J]. Biodiv Sci, 2019, 27(10): 1132-1137. |
| [7] | Fenglin Zhang,Xin Wang,Jian Zhang. Biodiversity information resources. II. Environmental data [J]. Biodiv Sci, 2018, 26(1): 53-65. |
| [8] | Jian Zhang. Biodiversity science and macroecology in the era of big data [J]. Biodiv Sci, 2017, 25(4): 355-363. |
| [9] | Xin Wang, Fenglin Zhang, Jian Zhang. Biodiversity information resources. I. Species distribution, catalogue, phylogeny, and life history traits [J]. Biodiv Sci, 2017, 25(11): 1223-1238. |
| [10] | Xiaozhi Lin, Dongmei Li, Huanzhang Liu, Hongsheng Lin, Shaorong Yang, Hanjin Fan, Rushu Wen. Fish species diversity and its seasonal variations in the Chaozhou section of Hanjiang River, Guangdong Province [J]. Biodiv Sci, 2016, 24(2): 185-194. |
| [11] | Lisong Wang, Vincent S Smith, Hongrui Zhang, Xianchun Zhang. Scratchpads 2.0: a virtual research environment for biodiversity sciences in the Internet era [J]. Biodiv Sci, 2014, 22(3): 264-276. |
| [12] | Kwangtsao Shao, Han Lee, Yungchang Lin, Kunchi Lai. A review of marine biodiversity information resources [J]. Biodiv Sci, 2014, 22(3): 253-263. |
| [13] | Bo Zhou, Haidong Jiang, Xiuxin Zhang, Jingqi Xue, Yantong Shi. Morphological diversity of some introduced tree peony cultivars [J]. Biodiv Sci, 2011, 19(5): 543-550. |
| [14] | Chunnan Li, Hairui Cui, Weibo Wang. Genetic diversity in rhizosphere soil microbes detected with SRAP markers [J]. Biodiv Sci, 2011, 19(4): 485-493. |
| [15] | Kwangtsao Shao, Kunchi Lai, Yungchang Lin, Chihjen Ko, Han Lee, Lingya Hung, Yuehchih Chen, Leesea Chen. Experience and strategy of biodiversity data integration in Taiwan [J]. Biodiv Sci, 2010, 18(5): 444-453. |
| Viewed | ||||||
|
Full text |
|
|||||
|
Abstract |
|
|||||
Copyright © 2026 Biodiversity Science
Editorial Office of Biodiversity Science, 20 Nanxincun, Xiangshan, Beijing 100093, China
Tel: 010-62836137, 62836665 E-mail: biodiversity@ibcas.ac.cn