
Biodiv Sci ›› 2026, Vol. 34 ›› Issue (4): 25287. DOI: 10.17520/biods.2025287 cstr: 32101.14.biods.2025287
• Technology and Methodology • Previous Articles Next Articles
Ziyi Kong1,2,3, Degang Wang1,2,3, Jiantao Wang4, Zhiyong Pei5, Jing Sun6, Changchun Zhang1,2,3,*( ), Junguo Zhang1,2,3,*()
Received:2025-07-20
Accepted:2025-10-22
Online:2026-04-20
Published:2026-05-27
Contact:
*E-mail: zhangchangchun@bjfu.edu.cn; zhangjunguo@bjfu.edu.cn
Supported by:Ziyi Kong, Degang Wang, Jiantao Wang, Zhiyong Pei, Jing Sun, Changchun Zhang, Junguo Zhang. Wildlife pose estimation based on the SCD-HRNet model and its application in biodiversity monitoring: A case study of the Saihanwula Region, Inner Mongolia[J]. Biodiv Sci, 2026, 34(4): 25287.
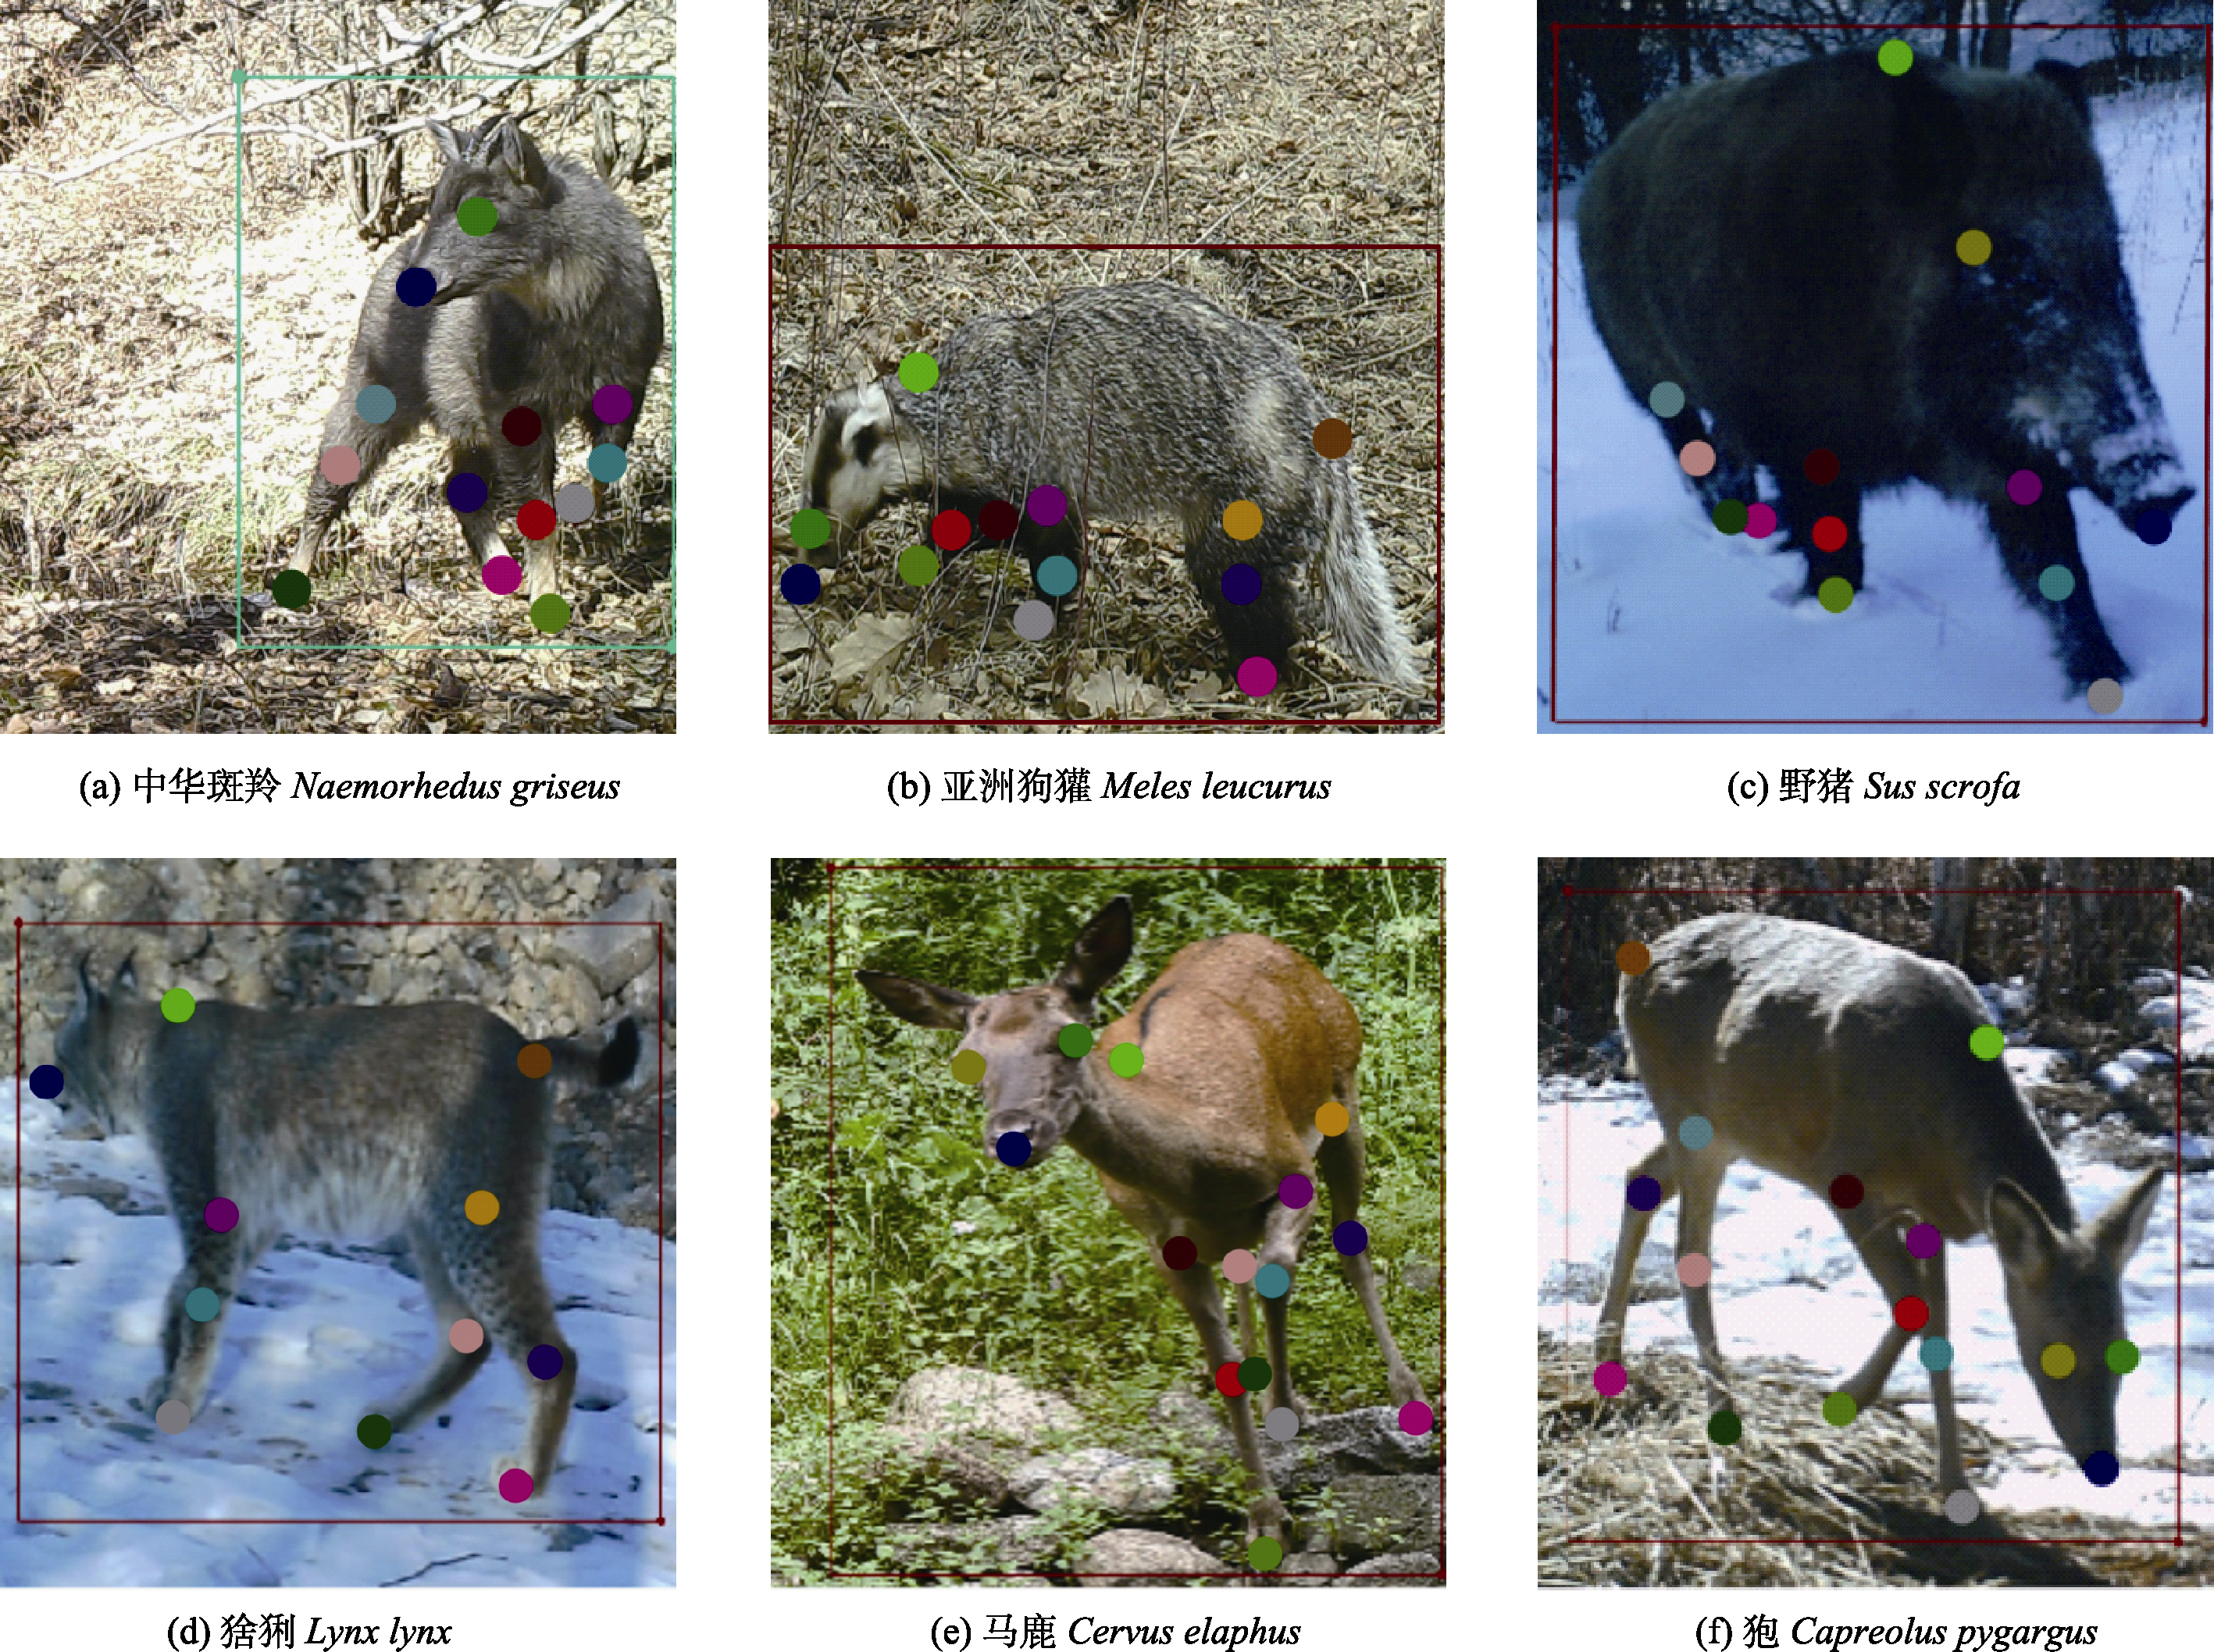
Fig. 1 Data annotation diagram. Seventeen key points covering the head, limbs, and torso are used to identify behavioral patterns such as feeding, moving, and resting. To improve visualization, all displayed key annotation points have been enlarged.
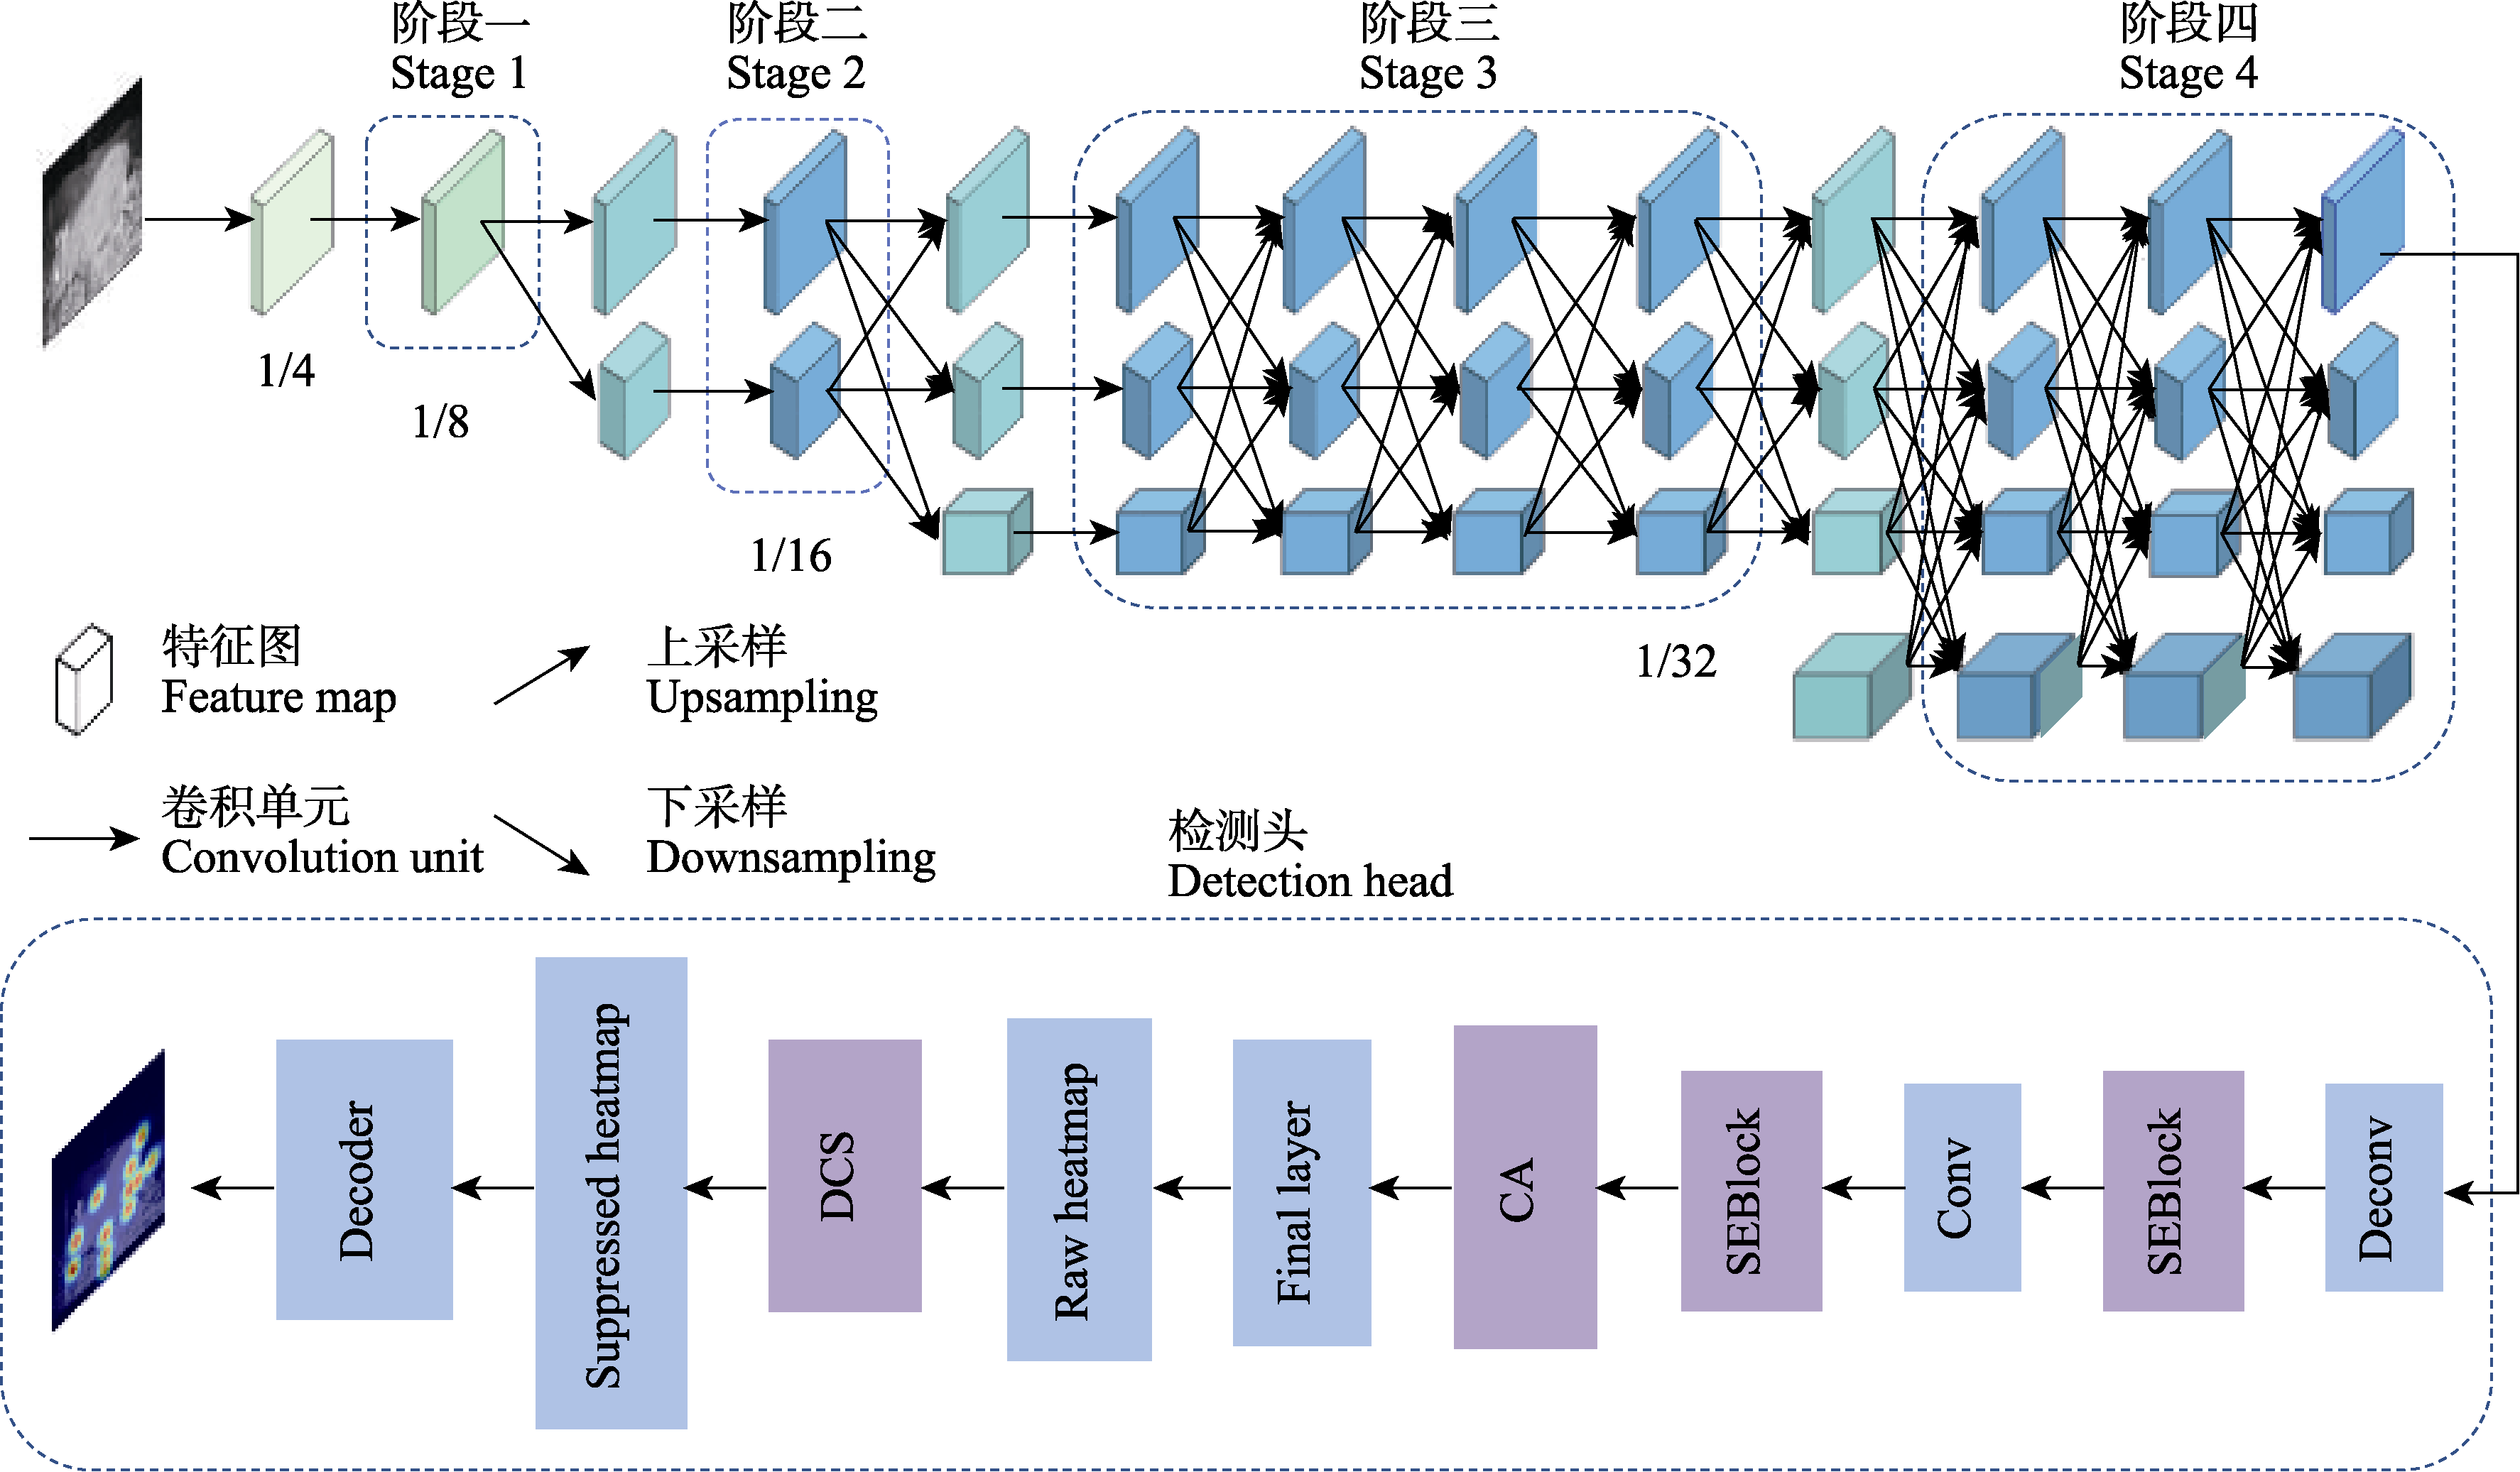
Fig. 2 Structure of SCD-HRNet model. Final layer, Final output layer; Conv, Convolution; SEBlock, Squeeze-and-excitation blocks; Deconv, Transposed convolution (deconvolution). The network, built on HRNet, introduces squeeze-and-excitation (SE) attention mechanism, coordinate attention (CA) mechanism, and dynamic confidence suppression (DCS) modules to improve keypoint detection accuracy for pose estimation in complex backgrounds.
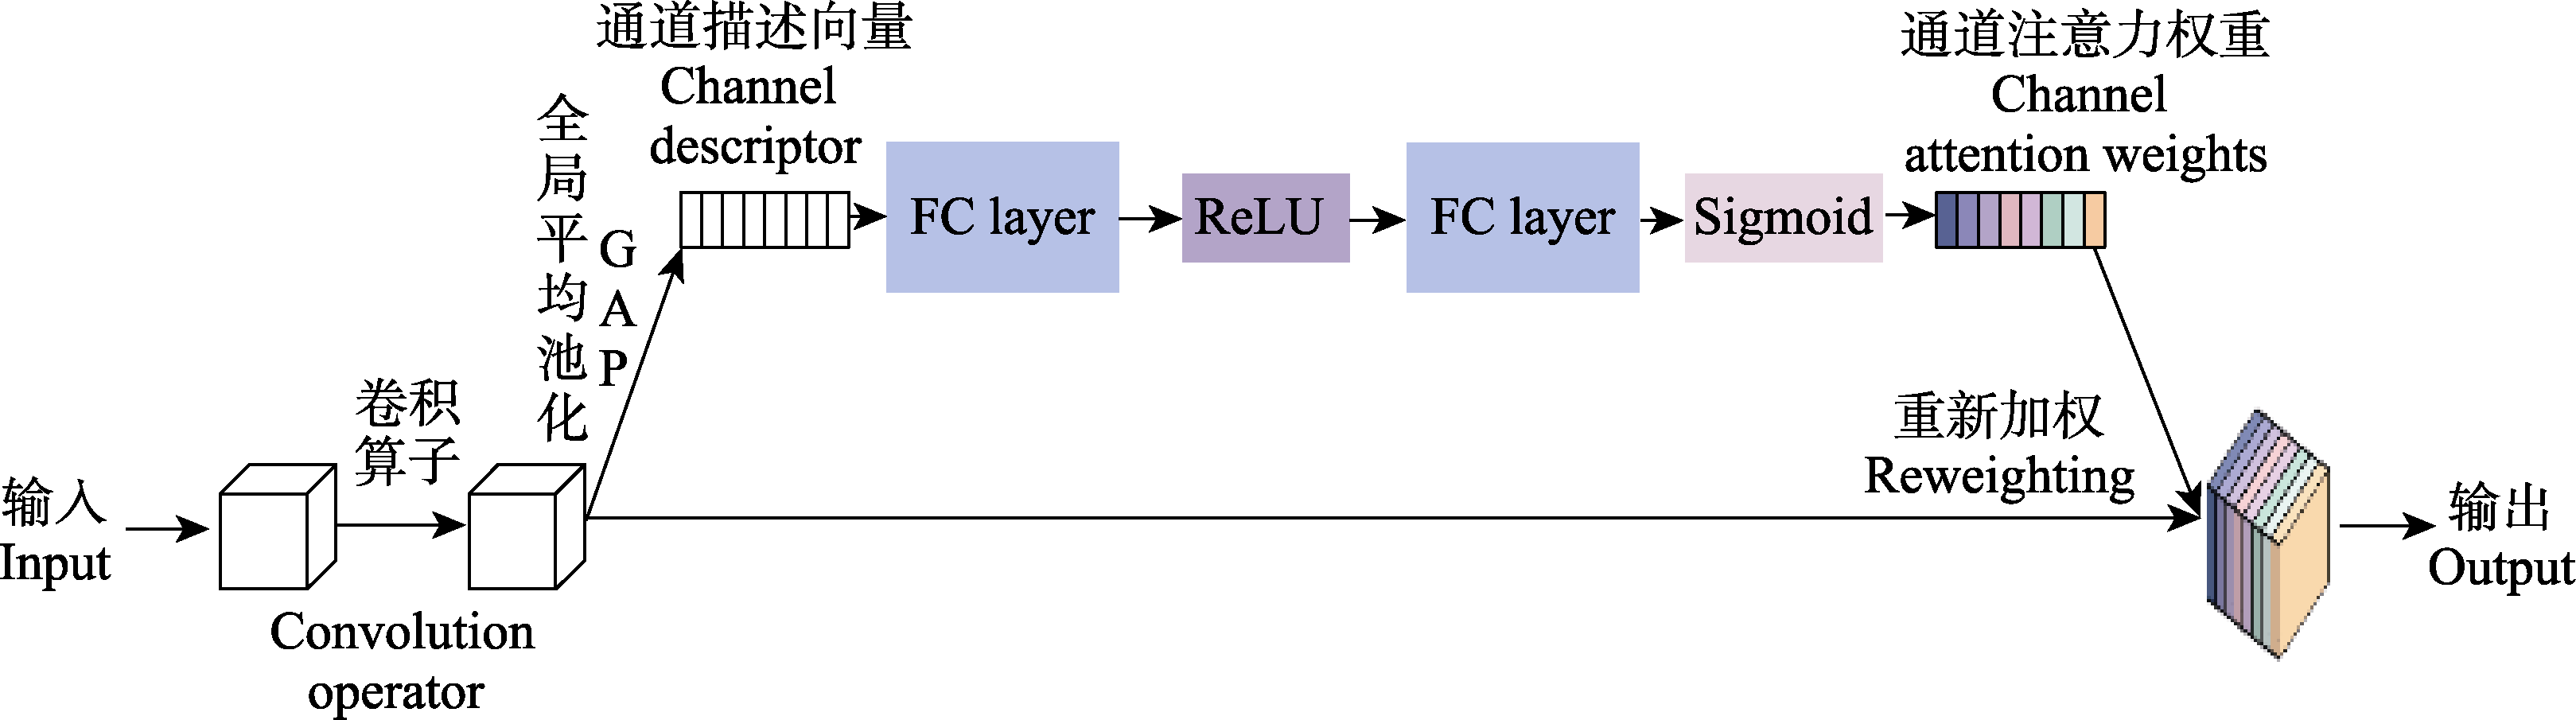
Fig. 3 Structure of squeeze-and-excitation (SE) attention mechanism. FC layer, Fully connected layer; ReLU, Rectified linear unit activation; Sigmoid, Sigmoid function. The module applies global average pooling to squeeze spatial information, then uses a fully connected layer to learn channel-wise importance weights, and re-calibrates the original feature map at the channel level, thereby improving robustness to illumination changes.
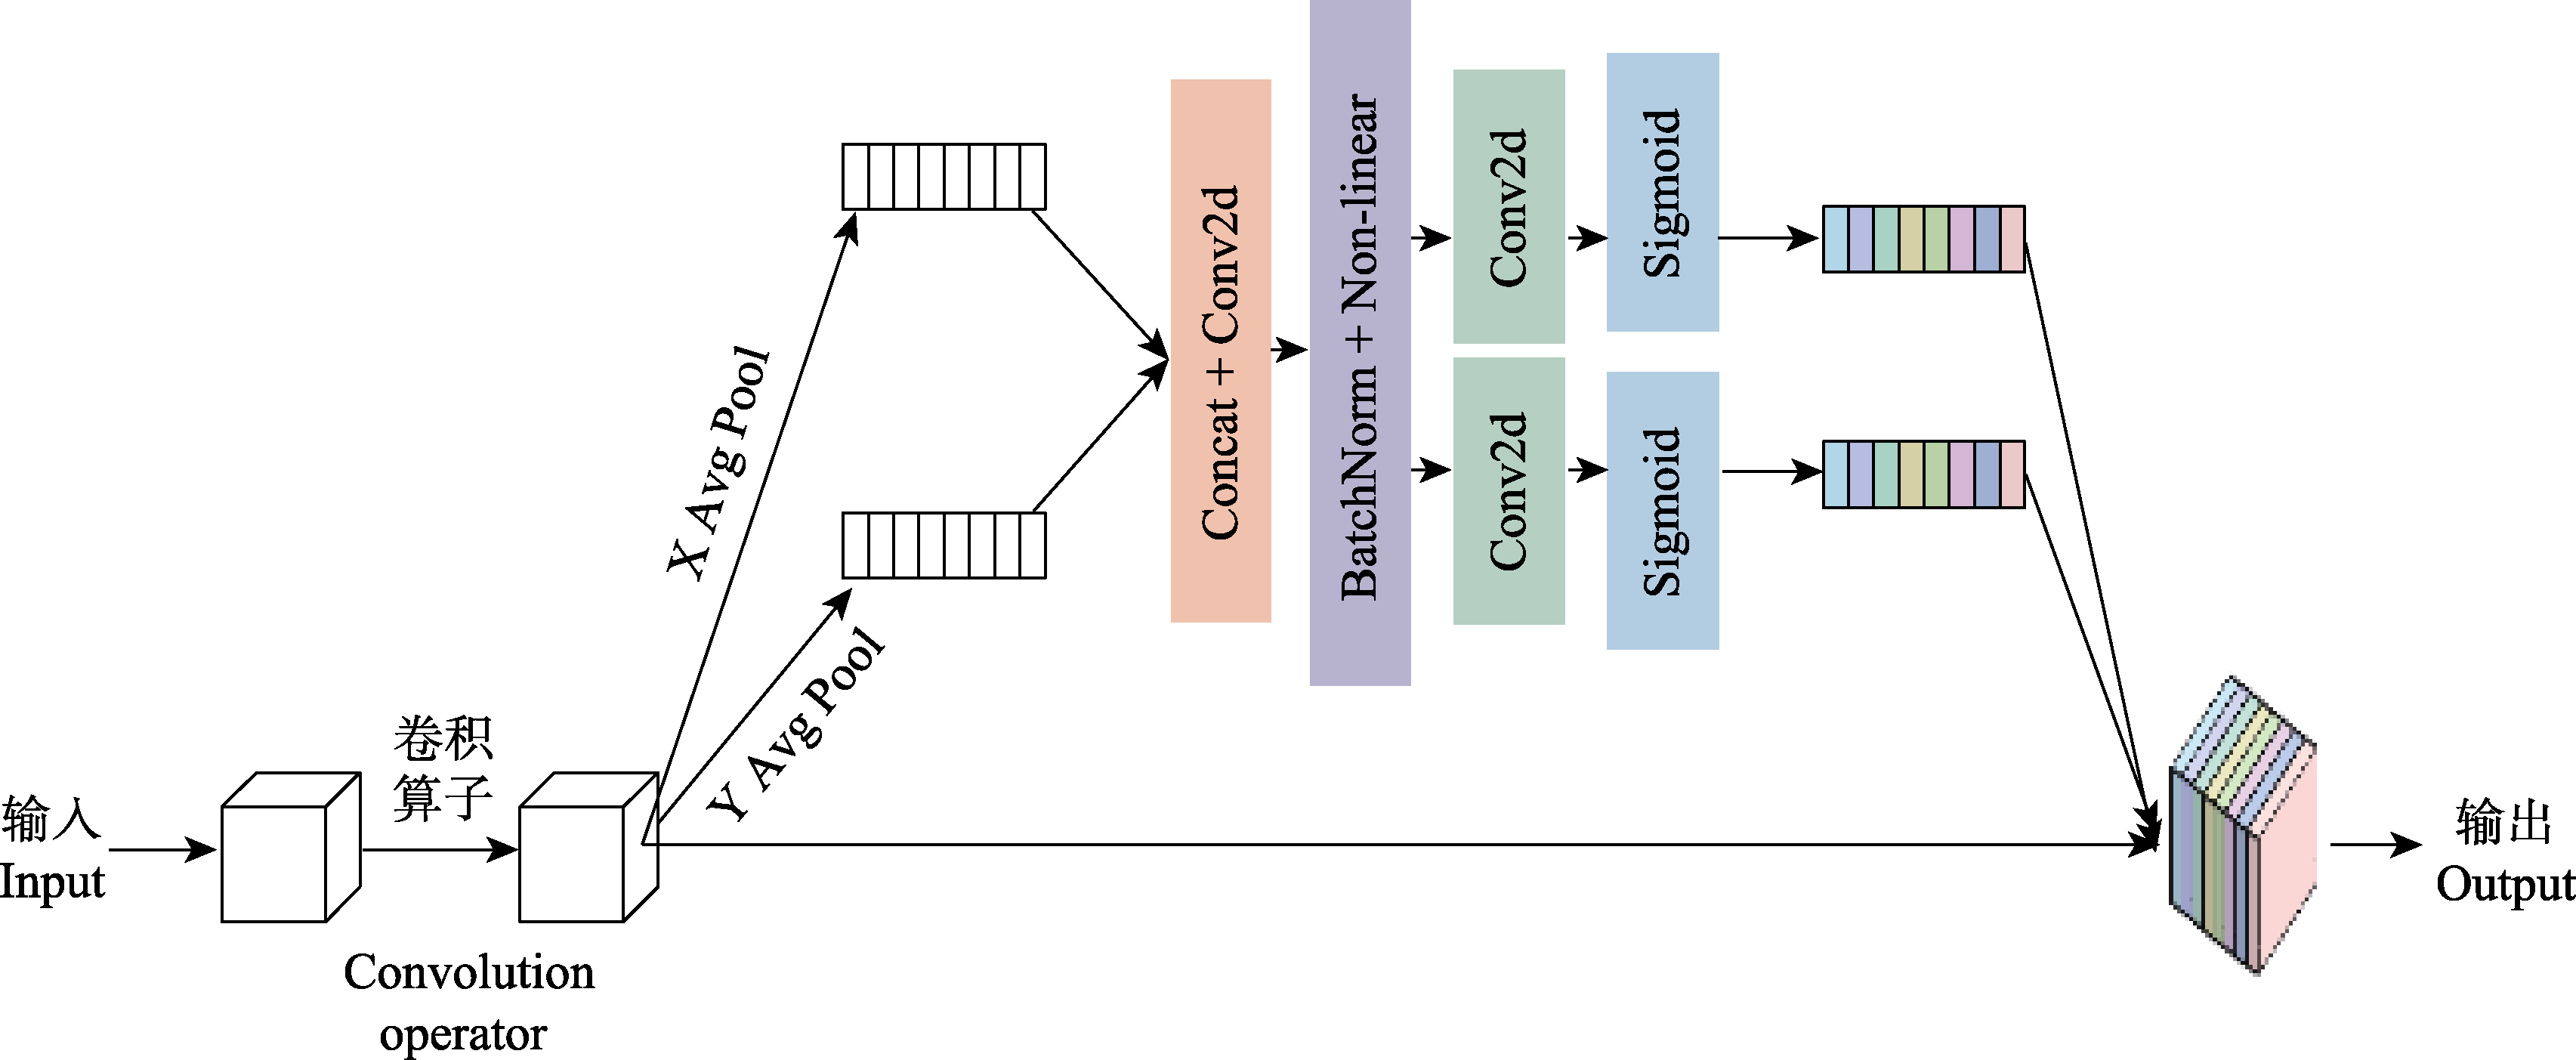
Fig. 4 Coordinate attention mechanism structure diagram. X Avg Pool, Average pooling along the x-axis; Y Avg Pool, Average pooling along the y-axis; Concat, Concatenation; Conv2d, 2D convolution; BatchNorm, Batch normalization; Non-linear, Non-linear activation function; Sigmoid, Sigmoid function. This module decomposes channel attention into two 1D feature-encoding paths along the horizontal and vertical spatial directions, thereby precisely preserving spatial positional information within the channel-attention mechanism.
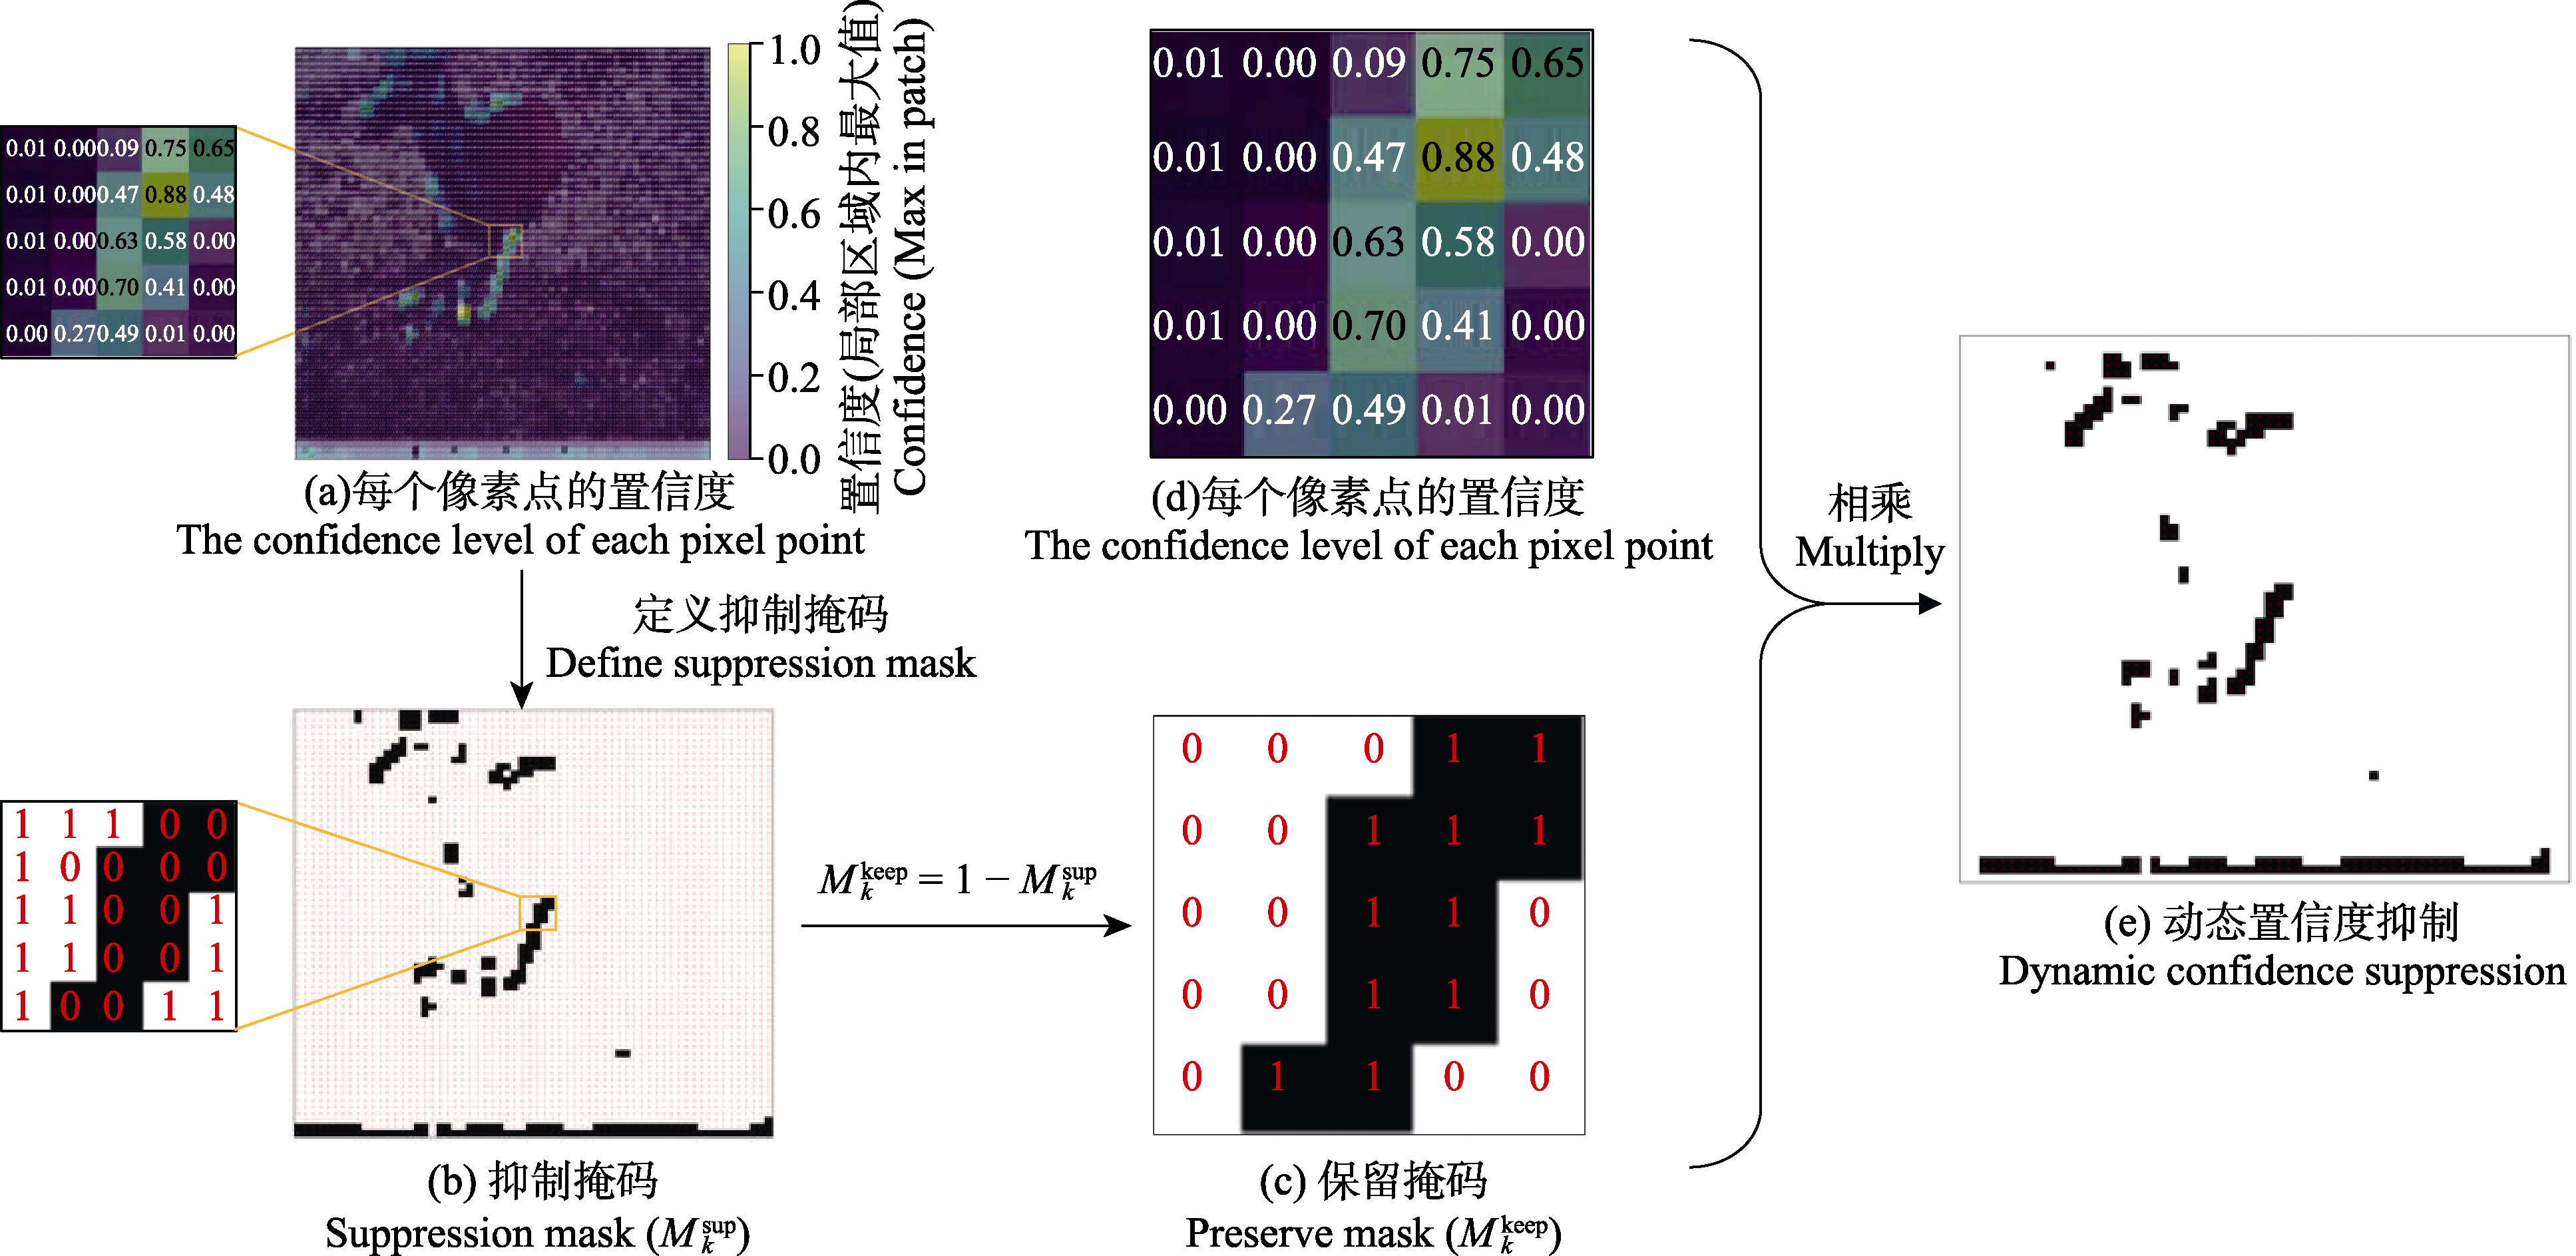
Fig. 5 Flowchart of the dynamic confidence suppression (DCS) module
| 实验类型 Type of experiment | SE | CA | DCS | AP (%) | AP50 (%) | AP75 (%) | APM (%) | APL (%) | AR (%) |
|---|---|---|---|---|---|---|---|---|---|
| 完整数据集消融实验 Ablation study on the full dataset | - | - | - | 81.47 | 85.11 | 83.24 | 86.64 | 78.74 | 83.43 |
| √ | - | - | 81.93 | 85.33 | 83.86 | 87.20 | 79.23 | 84.02 | |
| - | √ | - | 82.06 | 84.96 | 83.95 | 87.03 | 80.46 | 84.00 | |
| - | - | √ | 81.95 | 84.90 | 83.47 | 87.06 | 79.55 | 83.72 | |
| √ | √ | - | 82.40 | 85.26 | 83.91 | 87.65 | 80.15 | 84.25 | |
| √ | - | √ | 82.22 | 85.22 | 83.86 | 86.34 | 79.74 | 84.03 | |
| - | √ | √ | 82.25 | 85.80 | 84.10 | 87.57 | 80.05 | 84.14 | |
| √ | √ | √ | 82.61 | 85.19 | 84.39 | 88.15 | 80.48 | 84.68 | |
| 低光照子集消融实验 Ablation study on the low-light subset | - | - | - | 26.56 | 28.05 | 27.67 | 20.59 | 24.02 | 26.39 |
| √ | - | - | 26.78 | 28.03 | 28.03 | 20.36 | 24.43 | 26.59 | |
| - | √ | - | 26.75 | 28.05 | 27.72 | 19.94 | 24.50 | 26.59 | |
| - | - | √ | 26.68 | 28.05 | 28.05 | 19.77 | 24.45 | 26.52 | |
| √ | √ | √ | 26.85 | 28.05 | 28.05 | 19.77 | 24.56 | 26.52 | |
| 运动伪影与模糊子集消融实验 Ablation study on the motion blur and artifact subset | - | - | - | 25.57 | 28.55 | 28.55 | 0.00 | 27.10 | 25.41 |
| √ | - | - | 25.77 | 31.68 | 27.72 | 0.00 | 27.23 | 25.72 | |
| - | √ | - | 26.24 | 31.02 | 27.08 | 0.00 | 27.63 | 26.15 | |
| - | - | √ | 26.03 | 32.39 | 27.72 | 0.00 | 27.48 | 26.04 | |
| √ | √ | √ | 26.47 | 31.85 | 27.08 | 0.00 | 27.98 | 26.25 | |
| 遮挡子集消融实验 Ablation study on the occlusion subset | - | - | - | 21.31 | 27.21 | 20.58 | 26.54 | 20.68 | 22.56 |
| √ | - | - | 21.53 | 26.97 | 23.10 | 27.48 | 21.00 | 22.54 | |
| - | √ | - | 21.67 | 27.19 | 23.62 | 26.61 | 21.23 | 22.88 | |
| - | - | √ | 22.10 | 27.52 | 23.29 | 27.18 | 21.21 | 23.23 | |
| √ | √ | √ | 22.13 | 27.36 | 23.86 | 25.21 | 21.16 | 23.12 |
Table 1 Ablation study results on different subsets. Under the same training/test split and training strategy, squeeze-and-excitation (SE) attention mechanism, coordinate attention (CA), and dynamic confidence suppression (DCS) modules were progressively incorporated into the baseline HRNet-W48, and the corresponding performance changes were reported. In the table, “√/-” indicate enabled/disabled, respectively; all other settings follow the baseline. AP, Average precision; AP50, Average precision calculated at an object keypoint similarity (OKS) threshold of 0.50; AP75: Average precision calculated at an OKS threshold of 0.75; APM, Average precision for medium objects; APL, Average precision for large objects; AR, Average recall.
| 实验类型 Type of experiment | SE | CA | DCS | AP (%) | AP50 (%) | AP75 (%) | APM (%) | APL (%) | AR (%) |
|---|---|---|---|---|---|---|---|---|---|
| 完整数据集消融实验 Ablation study on the full dataset | - | - | - | 81.47 | 85.11 | 83.24 | 86.64 | 78.74 | 83.43 |
| √ | - | - | 81.93 | 85.33 | 83.86 | 87.20 | 79.23 | 84.02 | |
| - | √ | - | 82.06 | 84.96 | 83.95 | 87.03 | 80.46 | 84.00 | |
| - | - | √ | 81.95 | 84.90 | 83.47 | 87.06 | 79.55 | 83.72 | |
| √ | √ | - | 82.40 | 85.26 | 83.91 | 87.65 | 80.15 | 84.25 | |
| √ | - | √ | 82.22 | 85.22 | 83.86 | 86.34 | 79.74 | 84.03 | |
| - | √ | √ | 82.25 | 85.80 | 84.10 | 87.57 | 80.05 | 84.14 | |
| √ | √ | √ | 82.61 | 85.19 | 84.39 | 88.15 | 80.48 | 84.68 | |
| 低光照子集消融实验 Ablation study on the low-light subset | - | - | - | 26.56 | 28.05 | 27.67 | 20.59 | 24.02 | 26.39 |
| √ | - | - | 26.78 | 28.03 | 28.03 | 20.36 | 24.43 | 26.59 | |
| - | √ | - | 26.75 | 28.05 | 27.72 | 19.94 | 24.50 | 26.59 | |
| - | - | √ | 26.68 | 28.05 | 28.05 | 19.77 | 24.45 | 26.52 | |
| √ | √ | √ | 26.85 | 28.05 | 28.05 | 19.77 | 24.56 | 26.52 | |
| 运动伪影与模糊子集消融实验 Ablation study on the motion blur and artifact subset | - | - | - | 25.57 | 28.55 | 28.55 | 0.00 | 27.10 | 25.41 |
| √ | - | - | 25.77 | 31.68 | 27.72 | 0.00 | 27.23 | 25.72 | |
| - | √ | - | 26.24 | 31.02 | 27.08 | 0.00 | 27.63 | 26.15 | |
| - | - | √ | 26.03 | 32.39 | 27.72 | 0.00 | 27.48 | 26.04 | |
| √ | √ | √ | 26.47 | 31.85 | 27.08 | 0.00 | 27.98 | 26.25 | |
| 遮挡子集消融实验 Ablation study on the occlusion subset | - | - | - | 21.31 | 27.21 | 20.58 | 26.54 | 20.68 | 22.56 |
| √ | - | - | 21.53 | 26.97 | 23.10 | 27.48 | 21.00 | 22.54 | |
| - | √ | - | 21.67 | 27.19 | 23.62 | 26.61 | 21.23 | 22.88 | |
| - | - | √ | 22.10 | 27.52 | 23.29 | 27.18 | 21.21 | 23.23 | |
| √ | √ | √ | 22.13 | 27.36 | 23.86 | 25.21 | 21.16 | 23.12 |
| 方法 Method | 主干网络 Backbone network | AP (%) | AP50 (%) | AP75 (%) | APM (%) | APL (%) | AR (%) | 参考文献 References |
|---|---|---|---|---|---|---|---|---|
| SCD-HRNet | HRNet-W48 | 82.61 | 85.19 | 84.39 | 88.15 | 80.48 | 84.68 | 本研究 This study |
| HRNet | HRNet-W48 | 81.47 | 85.11 | 83.24 | 86.64 | 78.74 | 83.43 | Sun et al., |
| Simple Baseline | ResNet-50 | 81.45 | 85.66 | 83.26 | 87.60 | 78.58 | 83.14 | Xiao et al., |
| Simple Baseline | ResNet-101 | 80.81 | 85.28 | 83.40 | 87.08 | 77.87 | 82.54 | Xiao et al., |
| HRFormer | HRFormer | 80.72 | 86.95 | 85.17 | 85.52 | 77.97 | 82.82 | Yuan et al., |
| RSN | RSN-18 | 80.62 | 86.56 | 84.38 | 85.68 | 77.78 | 83.57 | Cai et al., |
| ViTPose | ViT-base | 78.08 | 86.92 | 83.89 | 85.50 | 74.47 | 80.58 | Xu et al., |
| MobileNet | MobileNetV2 | 77.47 | 87.26 | 84.09 | 83.75 | 73.54 | 80.11 | Sandler et al., |
| Shufflenet | ShufflenetV1 | 76.98 | 87.00 | 83.83 | 84.25 | 72.68 | 79.84 | Zhang et al., |
| Shufflenet | ShufflenetV2 | 75.82 | 87.10 | 82.24 | 83.64 | 71.30 | 78.66 | Ma et al., |
| RTMPose | Cspnext | 74.01 | 87.25 | 82.64 | 81.06 | 69.41 | 76.40 | Jiang et al., |
Table 2 Comparison of detection results of classical models on the Saihanwula wildlife dataset. All models adopt a top-down pose estimation framework and are evaluated on the test set. Evaluation follows the COCO Keypoint protocol. AP, Average precision; AP50, Average precision calculated at an object keypoint similarity (OKS) threshold of 0.50; AP75: Average precision calculated at an OKS threshold of 0.75; APM, Average precision for medium objects; APL, Average precision for large objects; AR, Average recall.
| 方法 Method | 主干网络 Backbone network | AP (%) | AP50 (%) | AP75 (%) | APM (%) | APL (%) | AR (%) | 参考文献 References |
|---|---|---|---|---|---|---|---|---|
| SCD-HRNet | HRNet-W48 | 82.61 | 85.19 | 84.39 | 88.15 | 80.48 | 84.68 | 本研究 This study |
| HRNet | HRNet-W48 | 81.47 | 85.11 | 83.24 | 86.64 | 78.74 | 83.43 | Sun et al., |
| Simple Baseline | ResNet-50 | 81.45 | 85.66 | 83.26 | 87.60 | 78.58 | 83.14 | Xiao et al., |
| Simple Baseline | ResNet-101 | 80.81 | 85.28 | 83.40 | 87.08 | 77.87 | 82.54 | Xiao et al., |
| HRFormer | HRFormer | 80.72 | 86.95 | 85.17 | 85.52 | 77.97 | 82.82 | Yuan et al., |
| RSN | RSN-18 | 80.62 | 86.56 | 84.38 | 85.68 | 77.78 | 83.57 | Cai et al., |
| ViTPose | ViT-base | 78.08 | 86.92 | 83.89 | 85.50 | 74.47 | 80.58 | Xu et al., |
| MobileNet | MobileNetV2 | 77.47 | 87.26 | 84.09 | 83.75 | 73.54 | 80.11 | Sandler et al., |
| Shufflenet | ShufflenetV1 | 76.98 | 87.00 | 83.83 | 84.25 | 72.68 | 79.84 | Zhang et al., |
| Shufflenet | ShufflenetV2 | 75.82 | 87.10 | 82.24 | 83.64 | 71.30 | 78.66 | Ma et al., |
| RTMPose | Cspnext | 74.01 | 87.25 | 82.64 | 81.06 | 69.41 | 76.40 | Jiang et al., |
| 方法 Method | 主干网络 Backbone network | AP (%) | AP50 (%) | AP75 (%) | APM (%) | APL (%) | AR (%) |
|---|---|---|---|---|---|---|---|
| SCD-HRNet | HRNet-W48 | 69.79 | 93.55 | 77.70 | 51.98 | 70.13 | 73.17 |
| HRNet | HRNet-W48 | 67.88 | 92.10 | 72.97 | 51.26 | 68.33 | 72.04 |
| Simple Baseline | ResNet-50 | 64.24 | 91.44 | 69.83 | 47.60 | 64.53 | 68.03 |
| Simple Baseline | ResNet-101 | 62.42 | 90.03 | 65.61 | 44.38 | 62.74 | 66.53 |
| HRFormer | HRFormer | 58.95 | 89.39 | 61.51 | 40.93 | 59.35 | 63.62 |
| RSN | RSN-18 | 58.74 | 88.28 | 61.44 | 47.14 | 59.01 | 62.88 |
| RTMPose | Cspnext | 54.75 | 88.04 | 55.61 | 44.20 | 54.99 | 58.90 |
| MobileNet | MobileNetV2 | 50.49 | 83.70 | 49.94 | 39.11 | 50.73 | 54.98 |
| Shufflenet | ShufflenetV2 | 46.68 | 82.49 | 43.64 | 30.37 | 47.02 | 51.67 |
| Shufflenet | ShufflenetV1 | 46.59 | 81.90 | 45.80 | 34.82 | 46.83 | 51.61 |
| ViTPose | ViT-base | 46.47 | 79.92 | 46.18 | 31.81 | 46.64 | 50.35 |
Table 3 Generalization test results based on the AP-10K dataset. We evaluate generalization on the AP-10K dataset, all methods are trained from scratch on the official AP-10K train/val split. AP, Average precision; AP50, Average precision calculated at an object keypoint similarity (OKS) threshold of 0.50; AP75: Average precision calculated at an OKS threshold of 0.75; APM, Average precision for medium objects; APL, Average precision for large objects; AR, Average recall.
| 方法 Method | 主干网络 Backbone network | AP (%) | AP50 (%) | AP75 (%) | APM (%) | APL (%) | AR (%) |
|---|---|---|---|---|---|---|---|
| SCD-HRNet | HRNet-W48 | 69.79 | 93.55 | 77.70 | 51.98 | 70.13 | 73.17 |
| HRNet | HRNet-W48 | 67.88 | 92.10 | 72.97 | 51.26 | 68.33 | 72.04 |
| Simple Baseline | ResNet-50 | 64.24 | 91.44 | 69.83 | 47.60 | 64.53 | 68.03 |
| Simple Baseline | ResNet-101 | 62.42 | 90.03 | 65.61 | 44.38 | 62.74 | 66.53 |
| HRFormer | HRFormer | 58.95 | 89.39 | 61.51 | 40.93 | 59.35 | 63.62 |
| RSN | RSN-18 | 58.74 | 88.28 | 61.44 | 47.14 | 59.01 | 62.88 |
| RTMPose | Cspnext | 54.75 | 88.04 | 55.61 | 44.20 | 54.99 | 58.90 |
| MobileNet | MobileNetV2 | 50.49 | 83.70 | 49.94 | 39.11 | 50.73 | 54.98 |
| Shufflenet | ShufflenetV2 | 46.68 | 82.49 | 43.64 | 30.37 | 47.02 | 51.67 |
| Shufflenet | ShufflenetV1 | 46.59 | 81.90 | 45.80 | 34.82 | 46.83 | 51.61 |
| ViTPose | ViT-base | 46.47 | 79.92 | 46.18 | 31.81 | 46.64 | 50.35 |
| 实验类型 Type of experiment | 方法 Method | 主干网络 Backbone network | AP (%) | AP50 (%) | AP75 (%) | APM (%) | APL (%) | AR (%) |
|---|---|---|---|---|---|---|---|---|
| 自建数据集 Self-constructed dataset | SCD-HRNet | HRNet-W48 | 82.63±0.07 | 85.21±0.27 | 84.16±0.17 | 88.10±0.11 | 80.51±0.50 | 84.47±0.14 |
| HRNet | HRNet-W48 | 81.59±0.16 | 85.50±0.23 | 83.38±0.14 | 86.96±0.59 | 78.87±0.35 | 83.45±0.12 | |
| Simple Baseline | ResNet-50 | 81.23±0.19 | 85.29±0.22 | 83.30±0.28 | 87.32±0.34 | 78.62±0.27 | 83.03±0.10 | |
| Simple Baseline | ResNet-101 | 80.48±0.10 | 85.20±0.15 | 82.90±0.26 | 87.09±0.26 | 77.22±0.19 | 82.41±0.08 | |
| HRFormer | HRFormer | 80.54±0.18 | 87.22±0.22 | 85.21±0.19 | 86.13±0.28 | 77.35±0.28 | 82.72±0.11 | |
| AP-10K数据集 AP-10K Dataset | SCD-HRNet | HRNet-W48 | 69.87±0.41 | 94.09±0.42 | 75.71±1.01 | 54.72±2.60 | 70.16±0.45 | 73.31±0.38 |
| HRNet | HRNet-W48 | 67.53±0.31 | 93.03±0.72 | 72.64±0.66 | 53.14±4.00 | 67.81 ±0.28 | 71.33±0.27 | |
| Simple Baseline | ResNet-50 | 63.92±0.19 | 90.78±0.34 | 69.53±0.91 | 46.86±3.87 | 64.24±0.15 | 67.83±0.14 | |
| Simple Baseline | ResNet-101 | 62.62±0.30 | 90.19±0.53 | 66.87±1.22 | 47.75±3.55 | 62.91±0.25 | 66.67±0.30 | |
| HRFormer | HRFormer | 59.27±0.44 | 89.42±0.58 | 61.76±0.32 | 47.71±1.35 | 59.58±0.47 | 63.84±0.36 |
Table 4 Experimental results of different methods on the self-built dataset and the AP-10K dataset (mean±SD).This table presents the average performance and standard deviation of various networks over five random seed experiments on two wildlife pose estimation datasets, reflecting the stability and variability of model performance. AP, Average precision; AP50, Average precision calculated at an object keypoint similarity (OKS) threshold of 0.50; AP75: Average precision calculated at an OKS threshold of 0.75; APM, Average precision for medium objects; APL, Average precision for large objects; AR, Average recall.
| 实验类型 Type of experiment | 方法 Method | 主干网络 Backbone network | AP (%) | AP50 (%) | AP75 (%) | APM (%) | APL (%) | AR (%) |
|---|---|---|---|---|---|---|---|---|
| 自建数据集 Self-constructed dataset | SCD-HRNet | HRNet-W48 | 82.63±0.07 | 85.21±0.27 | 84.16±0.17 | 88.10±0.11 | 80.51±0.50 | 84.47±0.14 |
| HRNet | HRNet-W48 | 81.59±0.16 | 85.50±0.23 | 83.38±0.14 | 86.96±0.59 | 78.87±0.35 | 83.45±0.12 | |
| Simple Baseline | ResNet-50 | 81.23±0.19 | 85.29±0.22 | 83.30±0.28 | 87.32±0.34 | 78.62±0.27 | 83.03±0.10 | |
| Simple Baseline | ResNet-101 | 80.48±0.10 | 85.20±0.15 | 82.90±0.26 | 87.09±0.26 | 77.22±0.19 | 82.41±0.08 | |
| HRFormer | HRFormer | 80.54±0.18 | 87.22±0.22 | 85.21±0.19 | 86.13±0.28 | 77.35±0.28 | 82.72±0.11 | |
| AP-10K数据集 AP-10K Dataset | SCD-HRNet | HRNet-W48 | 69.87±0.41 | 94.09±0.42 | 75.71±1.01 | 54.72±2.60 | 70.16±0.45 | 73.31±0.38 |
| HRNet | HRNet-W48 | 67.53±0.31 | 93.03±0.72 | 72.64±0.66 | 53.14±4.00 | 67.81 ±0.28 | 71.33±0.27 | |
| Simple Baseline | ResNet-50 | 63.92±0.19 | 90.78±0.34 | 69.53±0.91 | 46.86±3.87 | 64.24±0.15 | 67.83±0.14 | |
| Simple Baseline | ResNet-101 | 62.62±0.30 | 90.19±0.53 | 66.87±1.22 | 47.75±3.55 | 62.91±0.25 | 66.67±0.30 | |
| HRFormer | HRFormer | 59.27±0.44 | 89.42±0.58 | 61.76±0.32 | 47.71±1.35 | 59.58±0.47 | 63.84±0.36 |
| 实验类型 Type of experiment | 方法 Method | ΔAP (%) | 95% CI of ΔAP | P | dn |
|---|---|---|---|---|---|
| 自建数据集vs HRNet Self-constructed dataset vs HRNet | HRNet | - | - | - | - |
| ResNet-50 | -0.366 | [-0.794, +0.062] | 0.077 | -1.06 | |
| ResNet-101 | -1.112 | [-1.344, -0.880] | < 0.001 | -5.95 | |
| HRFormer | -1.056 | [-1.257, -0.855] | < 0.001 | -6.51 | |
| SCD-HRNet | +1.040 | [+0.855, +1.225] | < 0.001 | +6.99 | |
| AP-10K数据集vs HRNet AP-10K dataset vs HRNet | HRNet | - | - | - | - |
| ResNet-50 | -3.618 | [-4.029, -3.207] | < 0.001 | -10.94 | |
| ResNet-101 | -4.912 | [-5.482, -4.342] | < 0.001 | -10.70 | |
| HRFormer | -8.266 | [-9.057, -7.475] | < 0.001 | -12.98 | |
| SCD-HRNet | +2.334 | [+1.744, +2.924] | < 0.001 | +4.91 |
Table 5 Statistical significance and effect size analysis of different methods compared with HRNet on the self-constructed dataset and the AP-10K dataset. ∆AP denotes the difference in average precision (AP) compared with the baseline HRNet. The 95% CI represents the confidence interval (CI) of this difference, where a non-zero-crossing interval indicates statistical significance. The P-value assesses the statistical significance of the difference, with commonly used thresholds of P<0.05 (significant) and P<0.001 (highly significant). dn denotes the paired effect size (Cohen’s dn), which measures the magnitude of improvement, where 0.2/0.5/0.8 correspond to small/medium/large effects, respectively. Positive values indicate performance improvement, while negative values indicate performance degradation.
| 实验类型 Type of experiment | 方法 Method | ΔAP (%) | 95% CI of ΔAP | P | dn |
|---|---|---|---|---|---|
| 自建数据集vs HRNet Self-constructed dataset vs HRNet | HRNet | - | - | - | - |
| ResNet-50 | -0.366 | [-0.794, +0.062] | 0.077 | -1.06 | |
| ResNet-101 | -1.112 | [-1.344, -0.880] | < 0.001 | -5.95 | |
| HRFormer | -1.056 | [-1.257, -0.855] | < 0.001 | -6.51 | |
| SCD-HRNet | +1.040 | [+0.855, +1.225] | < 0.001 | +6.99 | |
| AP-10K数据集vs HRNet AP-10K dataset vs HRNet | HRNet | - | - | - | - |
| ResNet-50 | -3.618 | [-4.029, -3.207] | < 0.001 | -10.94 | |
| ResNet-101 | -4.912 | [-5.482, -4.342] | < 0.001 | -10.70 | |
| HRFormer | -8.266 | [-9.057, -7.475] | < 0.001 | -12.98 | |
| SCD-HRNet | +2.334 | [+1.744, +2.924] | < 0.001 | +4.91 |
| 方法 Method | 主干网络 Backbone network | 每秒十亿次浮点运算GFLOPs | 参数规模 Params | 每秒帧数 FPS |
|---|---|---|---|---|
| HRNet | HRNet-W48 | 20.99 G | 63.60 M | 25.97 |
| Simple Baseline | ResNet-50 | 7.27 G | 34.00 M | 146.15 |
| Simple Baseline | ResNet-101 | 12.13 G | 52.99 M | 83.91 |
| MobileNet | MobileNetV2 | 2.11 G | 9.57 M | 163.86 |
| RSN | RSN-18 | 3.02 G | 9.15 M | 61.75 |
| Shufflenet | ShufflenetV1 | 1.80 G | 6.94 M | 138.52 |
| Shufflenet | ShufflenetV2 | 1.82 G | 7.55 M | 141.11 |
| RTMPose | Cspnext | 2.57 G | 13.62 M | 106.11 |
| HRFormer | HRFormer | 19.50 G | 43.22 M | 16.10 |
| ViTPose | ViT-base | 25.03 G | 89.99 M | 37.38 |
| HRNet+SE | HRNet-W48 | 21.00 G | 63.60 M | 27.73 |
| HRNet+CA | HRNet-W48 | 21.00 G | 63.60 M | 28.60 |
| HRNet+DCS | HRNet-W48 | 24.03 G | 64.34 M | 28.99 |
| HRNet+SE+CA | HRNet-W48 | 21.00 G | 63.60 M | 27.24 |
| HRNet+SE+DCS | HRNet-W48 | 24.03 G | 64.35 M | 29.01 |
| HRNet+CA+DCS | HRNet-W48 | 24.03 G | 64.34 M | 29.38 |
| SCD-HRNet | HRNet-W48 | 24.03 G | 64.35 M | 27.56 |
Table 6 A comparison of Giga floating-point operations per second (GFLOPs), parameter size (Params), and frames per second (FPS) across different methods. GFLOPs reflects the theoretical computational load of a single forward pass. Params indicates the number of trainable parameters, which is generally related to storage requirements and training difficulty. FPS denotes the average real-time processing frame rate under the test environment, gauging the model’s operational speed and deployment feasibility. Lower GFLOPs and parameter size typically indicate a lighter model, while a higher FPS suggests the model is more suitable for real-time application scenarios.
| 方法 Method | 主干网络 Backbone network | 每秒十亿次浮点运算GFLOPs | 参数规模 Params | 每秒帧数 FPS |
|---|---|---|---|---|
| HRNet | HRNet-W48 | 20.99 G | 63.60 M | 25.97 |
| Simple Baseline | ResNet-50 | 7.27 G | 34.00 M | 146.15 |
| Simple Baseline | ResNet-101 | 12.13 G | 52.99 M | 83.91 |
| MobileNet | MobileNetV2 | 2.11 G | 9.57 M | 163.86 |
| RSN | RSN-18 | 3.02 G | 9.15 M | 61.75 |
| Shufflenet | ShufflenetV1 | 1.80 G | 6.94 M | 138.52 |
| Shufflenet | ShufflenetV2 | 1.82 G | 7.55 M | 141.11 |
| RTMPose | Cspnext | 2.57 G | 13.62 M | 106.11 |
| HRFormer | HRFormer | 19.50 G | 43.22 M | 16.10 |
| ViTPose | ViT-base | 25.03 G | 89.99 M | 37.38 |
| HRNet+SE | HRNet-W48 | 21.00 G | 63.60 M | 27.73 |
| HRNet+CA | HRNet-W48 | 21.00 G | 63.60 M | 28.60 |
| HRNet+DCS | HRNet-W48 | 24.03 G | 64.34 M | 28.99 |
| HRNet+SE+CA | HRNet-W48 | 21.00 G | 63.60 M | 27.24 |
| HRNet+SE+DCS | HRNet-W48 | 24.03 G | 64.35 M | 29.01 |
| HRNet+CA+DCS | HRNet-W48 | 24.03 G | 64.34 M | 29.38 |
| SCD-HRNet | HRNet-W48 | 24.03 G | 64.35 M | 27.56 |
| [1] |
An L, Ren JL, Yu T, Hai T, Jia YC, Liu YB (2023) Three-dimensional surface motion capture of multiple freely moving pigs using MAMMAL. Nature Communications, 14, 7727.
DOI PMID |
| [2] |
Barney S, Dlay S, Crowe A, Kyriazakis I, Leach M (2023) Deep learning pose estimation for multi-cattle lameness detection. Scientific Reports, 13, 4499.
DOI PMID |
| [3] |
Cai JM, He PY, Yang ZP, Li LY, Zhao QJ, Pan F (2023) A deep feature fusion-based method for bird sound recognition and its interpretability analysis. Biodiversity Science, 31, 23087.(in Chinese with English abstract)
DOI |
|
[蔡建民, 何培宇, 杨智鹏, 李露莹, 赵启军, 潘帆 (2023) 基于深度特征融合的鸟鸣识别方法及其可解释性分析. 生物多样性, 31, 23087.]
DOI |
|
| [4] | Cai YH, Wang ZC, Luo ZX, Yin BY, Du AG, Wang HQ, Zhang XY, Zhou XY, Zhou EJ, Sun J (2020) Learning delicate local representations for multi-person pose estimation. ArXiv, doi: 10.48550/arXiv.2003.04030. |
| [5] | Cao JK, Tang HY, Fang HS, Shen XY, Tai YW, Lu CW (2019) Cross-domain adaptation for animal pose estimation. arXiv, doi: 10.48550/arXiv.1908.05806. |
| [6] | Cheng G, Yuan X, Yao XW, Yan KB, Zeng QH, Xie XX, Han JW (2023) Towards large-scale small object detection: Survey and benchmarks. IEEE Transactions on Pattern Analysis and Machine Intelligence, 45, 13467-13488. |
| [7] |
Ding YH, Liang J, Jiang B, Zheng AH, He R (2024) MAPS: A noise-robust progressive learning approach for source-free domain adaptive keypoint detection. IEEE Transactions on Circuits and Systems for Video Technology, 34, 1376-1387.
DOI URL |
| [8] |
Han YN, Chen K, Wang YK, Liu WH, Wang ZW, Wang XJ, Han CL, Liao JH, Huang K, Cai SY, Huang YT, Wang N, Li JX, Song Y, Li J, Wang GD, Wang LP, Zhang YP, Wei PF (2024) Multi-animal 3D social pose estimation, identification and behaviour embedding with a few-shot learning framework. Nature Machine Intelligence, 6, 48-61.
DOI |
| [9] | Hou QB, Zhou DQ, Feng JS (2021) Coordinate attention for efficient mobile network design. In: 2021 IEEE/CVF Conference on Computer Vision and Pattern Recognition (CVPR). IEEE, Nashville, TN. |
| [10] |
Hu B, Seybold B, Yang S, Sud A, Liu Y, Barron K, Cha P, Cosino M, Karlsson E, Kite J, Kolumam G, Preciado J, Zavala-Solorio J, Zhang CL, Zhang XM, Voorbach M, Tovcimak AE, Ruby JG, Ross DA (2023) 3D mouse pose from single-view video and a new dataset. Scientific Reports, 13, 13554.
DOI PMID |
| [11] | Hu J, Shen L, Sun G (2018) Squeeze-and-excitation networks. In: Proceedings of the IEEE Conference on Computer Vision and Pattern Recognition (CVPR 2018). IEEE, New York. |
| [12] | Huang K, Han YN, Chen K, Pan HL, Zhao GY, Yi WL, Li XX, Liu SY, Wei PF, Wang LP (2021) A hierarchical 3D-motion learning framework for animal spontaneous behavior mapping. Nature Communications, 12, 2784. |
| [13] | Jiang T, Lu P, Zhang L, Ma NS, Han R, Lyu CQ, Li YN, Chen K (2023) RTMPose: Real-time multi-person pose estimation based on MMPose. arXiv, doi: 10.48550/arXiv.2303.07399. |
| [14] | Kirillov A, Wu YX, He KM, Girshick R (2020) PointRend: Image segmentation as rendering. In: 2020 IEEE/CVF Conference on Computer Vision and Pattern Recognition (CVPR). IEEE, Seattle, WA. |
| [15] |
Lauer J, Zhou M, Ye SK, Menegas W, Schneider S, Nath T, Rahman MM, Di Santo V, Soberanes D, Feng GP, Murthy VN, Lauder G, Dulac C, Mathis MW, Mathis A (2022) Multi-animal pose estimation, identification and tracking with DeepLabCut. Nature Methods, 19, 496-504.
DOI PMID |
| [16] |
Li SY, Liu K, Wang H, Yang R, Li XZ, Sun YQ, Zhong RT, Wang W, Li Y, Sun YJ, Wang GH (2025) Pose estimation and tracking dataset for multi-animal behavior analysis on the China Space Station. Scientific Data, 12, 766.
DOI |
| [17] |
Liu H, Pan SG, Wu PB, Yu KG, Gao W, Yu BG (2024) Uncertainty-aware UWB/LiDAR/INS tightly coupled fusion pose estimation via filtering approach. IEEE Sensors Journal, 24, 11113-11126.
DOI URL |
| [18] | Ma NN, Zhang XY, Zheng HT, Sun J (2018) ShuffleNet V2: Practical guidelines for efficient CNN architecture design. arXiv, doi: 10.48550/arXiv.1807.11164. |
| [19] |
Mokany K, Ware C, Harwood TD, Schmidt RK, Ferrier S (2022) Habitat-based biodiversity assessment for ecosystem accounting in the Murray-Darling Basin. Conservation Biology, 36, e13915.
DOI URL |
| [20] |
Sagar ASMS, Islam MZ, Tanveer J, Kim HS (2025) Uncertainty-aware adaptive multiscale U-Net for low-contrast cardiac image segmentation. Applied Sciences, 15, 2222.
DOI URL |
| [21] | Sandler M, Howard A, Zhu ML, Zhmoginov A, Chen LC (2018) MobileNetV2: Inverted residuals and linear bottlenecks. In: 2018 IEEE/CVF Conference on Computer Vision and Pattern Recognition. IEEE, Salt Lake City, UT. |
| [22] | Sun K, Xiao B, Liu D, Wang JD (2019) Deep high-resolution representation learning for human pose estimation. In: 2019 IEEE/CVF Conference on Computer Vision and Pattern Recognition (CVPR). IEEE, Long Beach, CA. |
| [23] | Xiao B, Wu HP, Wei YC (2018) Simple baselines for human pose estimation and tracking. In: Proceedings of the European Conference on Computer Vision (ECCV) (eds Ferrari V, Hebert M, Sminchisescu C, Weiss Y). Springer, Cham. |
| [24] |
Xu GD, Xu Y, Deng H, Mo H (2023) Research on multi-target animal pose estimation based on improved high resolution network. Computer Engineering and Applications, 59(22), 182-192.(in Chinese with English abstract)
DOI |
|
[徐贵冬, 徐杨, 邓辉, 莫寒 (2023) 改进高分辨率网络的多目标动物姿态估计研究. 计算机工程与应用, 59(22), 182-192.]
DOI |
|
| [25] | Xu Y, Zhang J, Zhang Q, Tao D (2022) ViTPose: Simple vision transformer baselines for human pose estimation. Advances in Neural Information Processing Systems, 35, 38571-38584. |
| [26] |
Ye SK, Filippova A, Lauer J, Schneider S, Vidal M, Qiu T, Mathis A, Mathis MW (2024) SuperAnimal pretrained pose estimation models for behavioral analysis. Nature Communications, 15, 5165.
DOI PMID |
| [27] |
Yin ZX, Zhao YQ, Xu ZH, Yu QP (2024) Automatic detection of stereotypical behaviors of captive wild animals based on surveillance videos of zoos and animal reserves. Ecological Informatics, 79, 102450.
DOI URL |
| [28] | Yu H, Xu YF, Zhang J, Zhao W, Guan ZY, Tao DC (2021) AP-10K: A benchmark for animal pose estimation in the wild. arXiv, doi: 10.48550/arXiv.2108.12617. |
| [29] | Yuan YH, Fu R, Huang L, Lin WH, Zhang C, Chen XL, Wang JD (2021) HRFormer: High-resolution transformer for dense prediction. arXiv, doi: 10.48550/arXiv.2110.09408. |
| [30] | Zhang JG, Cheng ZA, Hu CH, Chen C, Bao WD (2018) Adaptive image enhancement algorithm for wild animal monitoring based on Retinex theory. Transactions of the Chinese Society of Agricultural Engineering, 34(15), 183-189.(in Chinese with English abstract) |
| [张军国, 程浙安, 胡春鹤, 陈宸, 鲍伟东 (2018) 野生动物监测光照自适应Retinex图像增强算法. 农业工程学报, 34(15), 183-189.] | |
| [31] |
Zhang WW, Xu Y, Bai R, Chen N (2023) Animal pose estimation based on improved stacked hourglass network. Computer Engineering, 49(2), 263-270.(in Chinese with English abstract)
DOI |
|
[张雯雯, 徐杨, 白芮, 陈娜 (2023) 基于改进堆叠沙漏网络的动物姿态估计. 计算机工程, 49(2), 263-270.]
DOI |
|
| [32] | Zhang XY, Zhou XY, Lin MX, Sun J (2018) ShuffleNet: An extremely efficient convolutional neural network for mobile devices. In: 2018 IEEE/CVF Conference on Computer Vision and Pattern Recognition. IEEE, Salt Lake City, UT. |
| Viewed | ||||||
|
Full text |
|
|||||
|
Abstract |
|
|||||
Copyright © 2026 Biodiversity Science
Editorial Office of Biodiversity Science, 20 Nanxincun, Xiangshan, Beijing 100093, China
Tel: 010-62836137, 62836665 E-mail: biodiversity@ibcas.ac.cn