
生物多样性 ›› 2024, Vol. 32 ›› Issue (10): 24286. DOI: 10.17520/biods.2024286 cstr: 32101.14.biods.2024286
陈蕾1, 许志勇1,*( )(
)( ), 苏菩坤1, 赖小甜1, 赵兆1,2()
收稿日期:2024-07-01
接受日期:2024-09-07
出版日期:2024-10-20
发布日期:2024-12-05
通讯作者:
*E-mail: ezyxu@njust.edu.cn
基金资助:
Lei Chen1, Zhiyong Xu1,*()(), Pukun Su1, Xiaotian Lai1, Zhao Zhao1,2()
Received:2024-07-01
Accepted:2024-09-07
Online:2024-10-20
Published:2024-12-05
Contact:
*E-mail: ezyxu@njust.edu.cn
Supported by:摘要:
近年来, 基于被动声学监测的声学指数方法作为快速生物多样性评估的热门工具, 因其可以量化生物声音的活动或多样性水平而得到广泛关注。然而, 复杂多变的人为声干扰对声学指数数值结果的影响及其抑制方法尚未获得深入研究, 严重限制了声学指数在城市绿地等人类活动区域的推广应用。基于频变门限检测的依频声学多样性指数(frequency-dependent acoustic diversity index, FADI)是一种对噪声影响低敏感的新型声学指数, 本文以鸟鸣声为对象, 基于实地采集的录音数据开展控制性仿真实验, 从鸟鸣声信噪比(signal-to-noise ratio, SNR)适用下限、鸟鸣声监测空间范围、干扰噪声类型限制3个方面, 对FADI在人类活动区域的应用能力和适用条件进行了客观评估。结果表明:(1)当鸟鸣声SNR在−5 dB至40 dB范围内变化时, FADI对噪声具有显著的稳健性; (2)相较于常规声学多样性指数(acoustic diversity index, ADI), FADI适用的监测距离扩大了6倍以上; (3) FADI能有效抑制如割草机声、雨声、流水声等时变特性较低的干扰影响, 但其性能在具有高度时变特性的干扰声环境中有一定程度下降。本文工作证明FADI在用于人类活动区域的生物多样性监测与快速评估方面具有良好的抗噪能力, 后续可以结合麦克风阵列技术, 在现有的时域和频域之外的基础上增加空域处理维度, 进一步提高FADI对人为声干扰的稳健性。
陈蕾, 许志勇, 苏菩坤, 赖小甜, 赵兆 (2024) 依频声学多样性指数用于人类活动区域的适用能力. 生物多样性, 32, 24286. DOI: 10.17520/biods.2024286.
Lei Chen, Zhiyong Xu, Pukun Su, Xiaotian Lai, Zhao Zhao (2024) Exploring the application of frequency-dependent acoustic diversity index in human-dominated areas. Biodiversity Science, 32, 24286. DOI: 10.17520/biods.2024286.
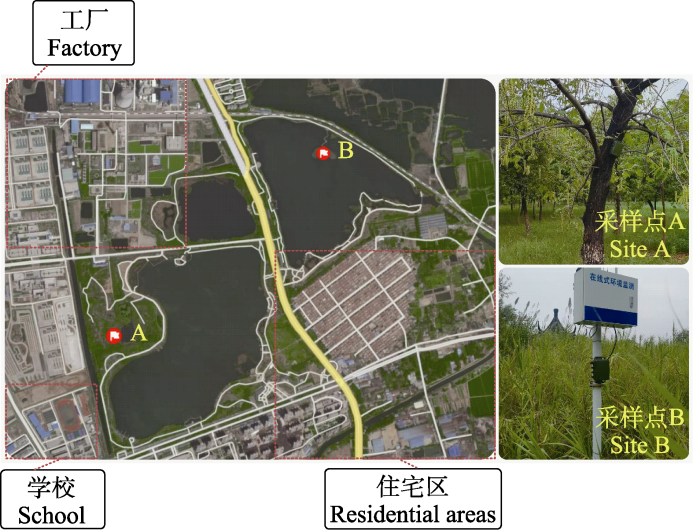
图1 江苏九里湖国家湿地公园地图及采样点示意图。A点为陆地区域采样点, B点为水边区域采样点。
Fig. 1 Locations of two passive acoustic recorders in Jiangsu Jiuli Lake National Wetland Park. Site A represents a terrestrial sampling point, and site B is surrounded by a lake.
| 物种 Species | 鸟鸣声时频分布结构 Sound unit shape | 频率范围 Frequency range (kHz) | 鸟鸣声片段数量 Number of segments |
|---|---|---|---|
| 长尾山雀 Aegithalos glaucogularis | 受频率调制类型 Frequency modulated whistles (FM) | 5-7 | 303 |
| 灰喜鹊 Cyanopica cyanus | 可变频率分量宽带类型 Broadband with varying frequency components (BVF) | 1-8 | 273 |
| 田鹀 Emberiza rustica | 宽带脉冲类型 Broadband pulses (BP) | 5.5-8 | 280 |
| 游隼 Falco peregrinus | 强谐波类型 Strong harmonics (SH) | 0.5-8 | 282 |
| 棕头鸦雀 Paradoxornis webbianus | 恒定频率类型 Constant frequency (CF) | 2-5 | 275 |
表1 本文使用的5种鸟鸣声数据说明
Table 1 Details of bird species and vocalization segments used in this work
| 物种 Species | 鸟鸣声时频分布结构 Sound unit shape | 频率范围 Frequency range (kHz) | 鸟鸣声片段数量 Number of segments |
|---|---|---|---|
| 长尾山雀 Aegithalos glaucogularis | 受频率调制类型 Frequency modulated whistles (FM) | 5-7 | 303 |
| 灰喜鹊 Cyanopica cyanus | 可变频率分量宽带类型 Broadband with varying frequency components (BVF) | 1-8 | 273 |
| 田鹀 Emberiza rustica | 宽带脉冲类型 Broadband pulses (BP) | 5.5-8 | 280 |
| 游隼 Falco peregrinus | 强谐波类型 Strong harmonics (SH) | 0.5-8 | 282 |
| 棕头鸦雀 Paradoxornis webbianus | 恒定频率类型 Constant frequency (CF) | 2-5 | 275 |
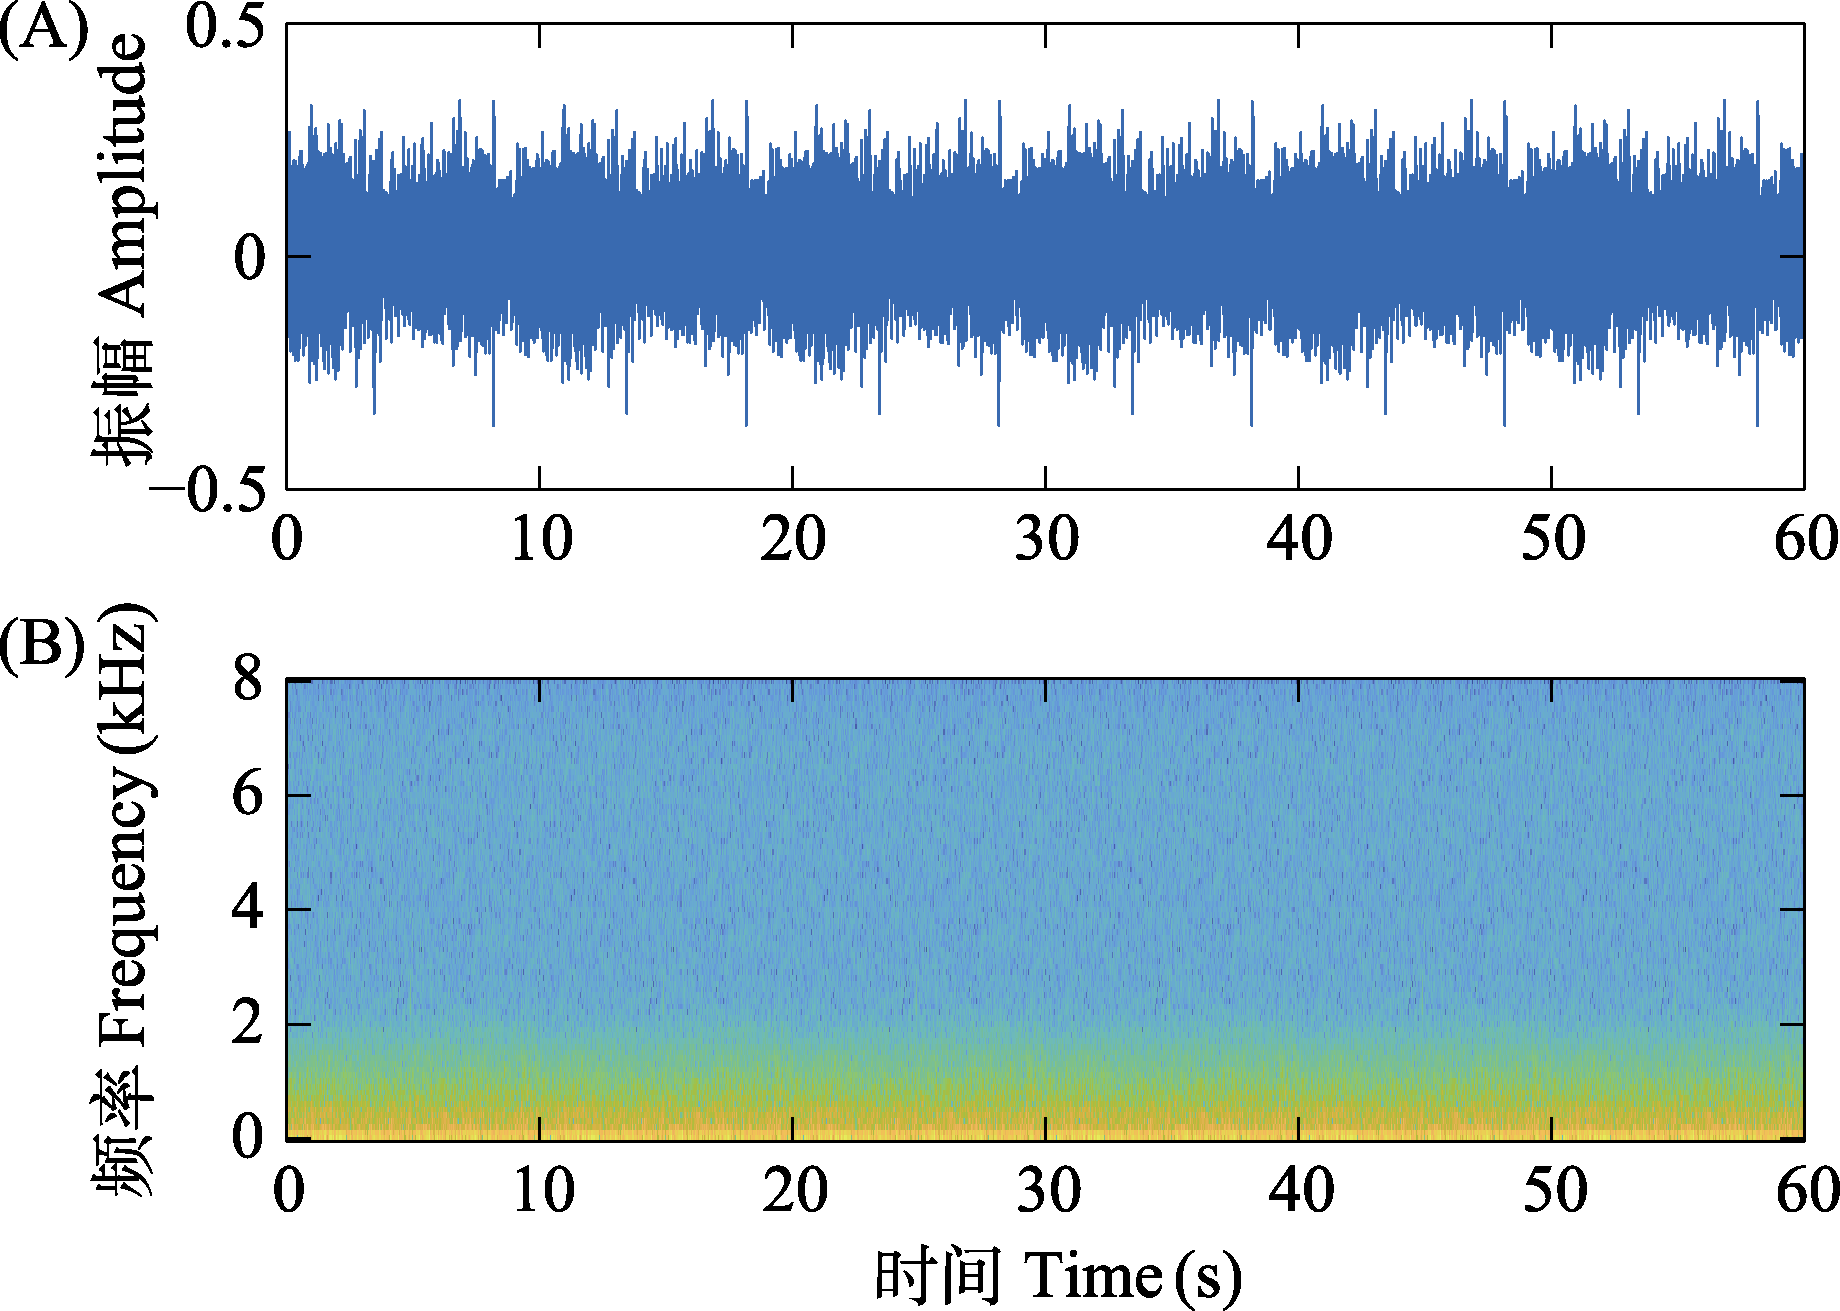
图2 60 s纯背景噪声记录的时域波形图(A)和时频谱图(B)
Fig. 2 Temporal waveform (A) and spectrogram (B) of the 60 s-length background noise recording
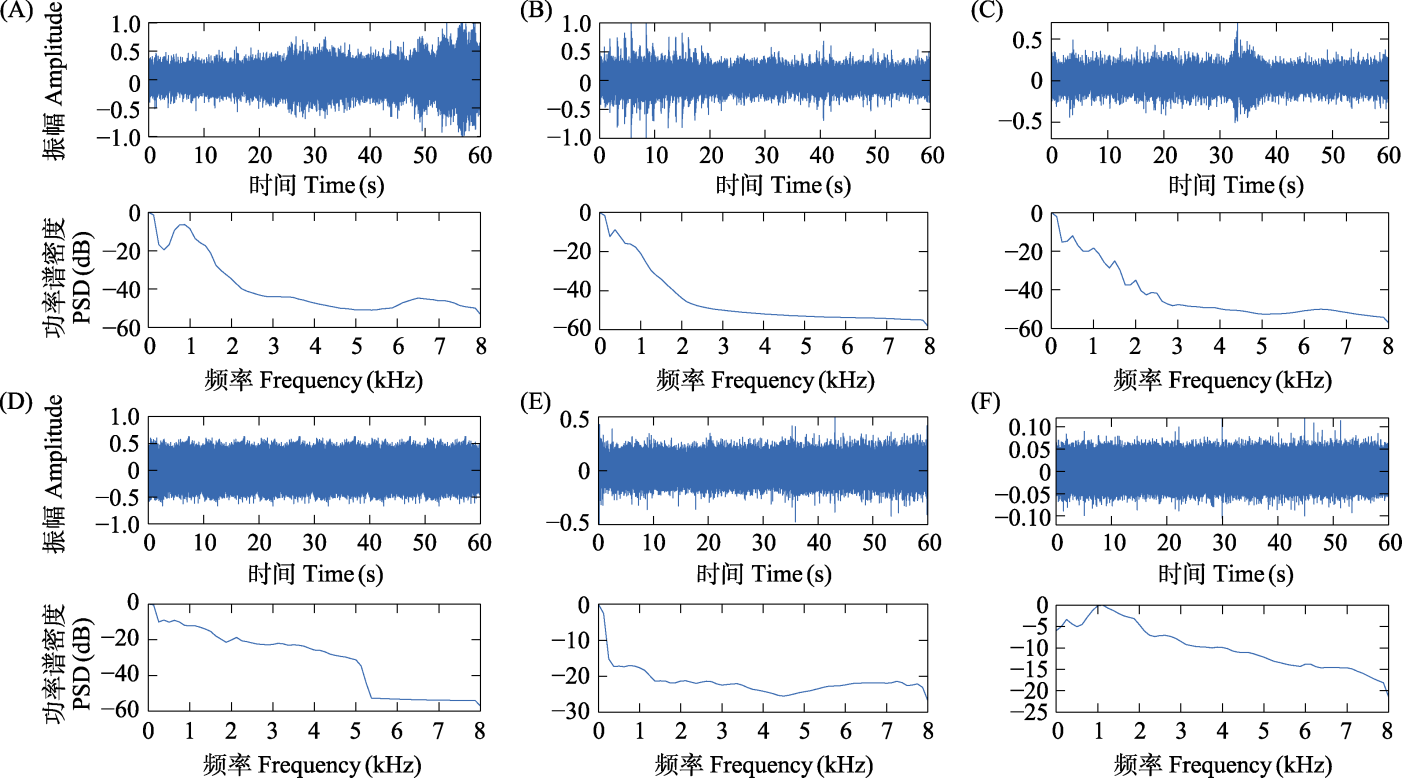
图3 6种干扰声信号的时域波形图及归一化功率谱图。(A)救护车警笛声; (B)打桩机声; (C)汽车鸣笛声; (D)割草机声; (E)雨声; (F)流水声。
Fig. 3 Temporal waveforms and normalized power spectra density (PSD) of six interference sound signals. (A) Ambulance siren; (B) Pile-driving noise; (C) Car horn; (D) Lawn mower sound; (E) Rain sound; (F) Flowing water sound.
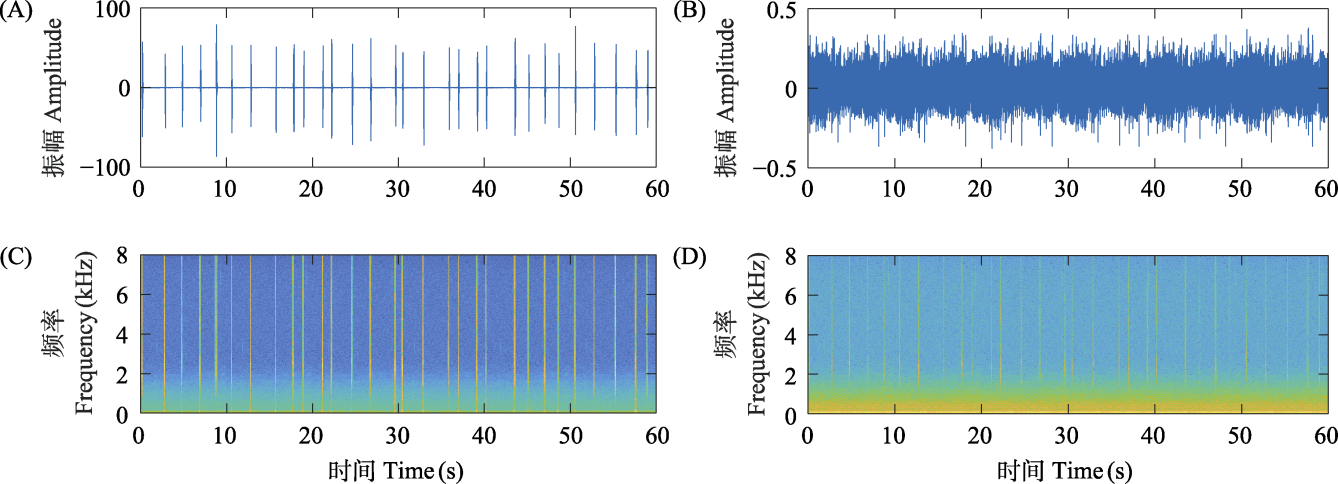
图4 距离分别为1 m (A, C)和191 m (B, D)处带噪仿真数据的时域波形图及时频谱图
Fig. 4 Temporal waveforms and spectrograms of noisy simulated recordings at distances of 1 m (A, C) and 191 m (B, D)
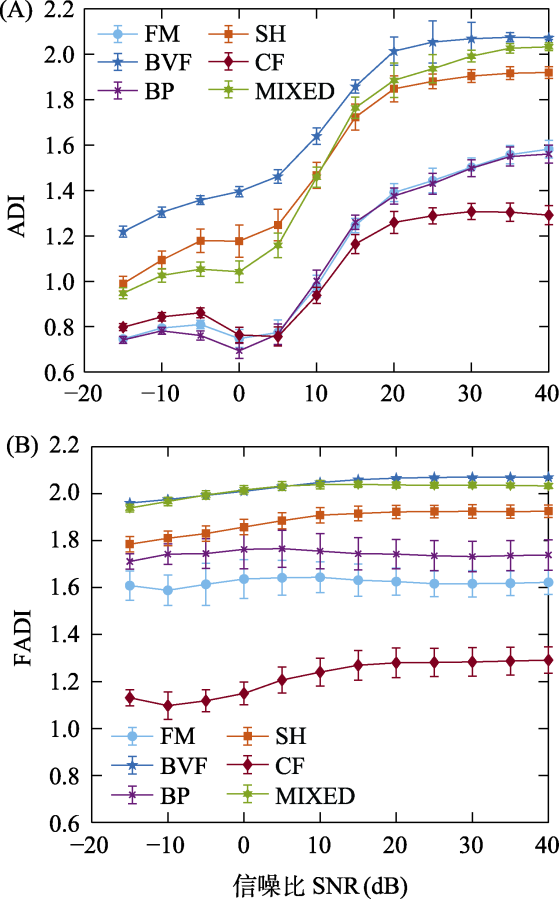
图5 不同类型鸟鸣声时频分布结构条件下ADI (A)和FADI (B)数值随SNR的变化曲线对比。ADI: 声学多样性指数; FADI: 基于频变门限检测的依频声学多样性指数; FM: 受频率调制类型信号; BVF: 可变频率分量宽带类型信号; BP: 宽带脉冲类型信号; SH: 强谐波类型信号; CF: 恒定频率类型信号; MIXED: 混合信号。
Fig. 5 Comparison of ADI (A) and FADI (B) with SNR under different sound unit shapes. ADI, Acoustic diversity index; FADI, Frequency-dependent acoustic diversity index; FM, Frequency modulated whistles; BVF, Broadband with varying frequency components; BP, Broadband pulse; SH, Strong harmonics; CF, Constant frequency; MIXED, Mixed sound unit shapes.
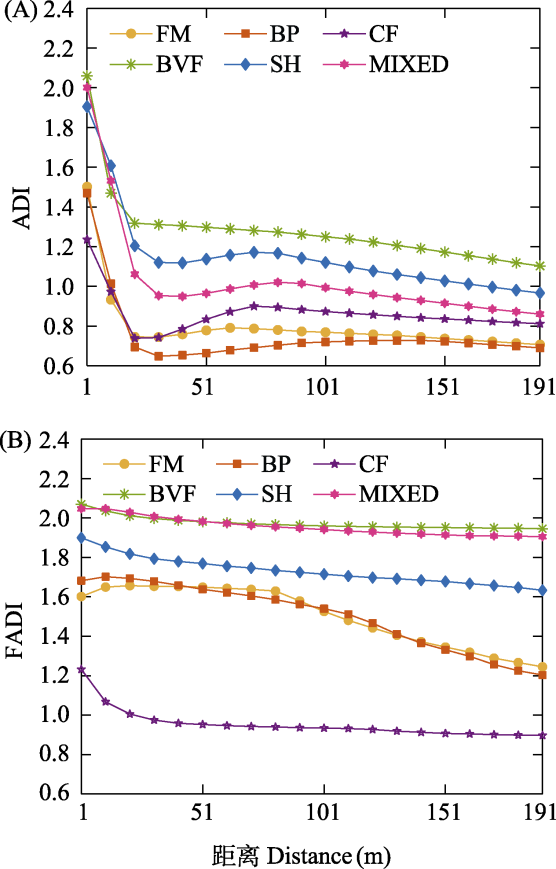
图6 不同类型鸟鸣声时频分布结构条件下ADI (A)、FADI (B)数值随距离的变化曲线对比。ADI: 声学多样性指数; FADI: 基于频变门限检测的依频声学多样性指数; FM: 受频率调制类型信号; BVF: 可变频率分量宽带类型信号; BP: 宽带脉冲类型信号; SH: 强谐波类型信号; CF: 恒定频率类型信号; MIXED: 混合信号。
Fig. 6 Comparison of ADI (A) and FADI (B) with distance under different sound unit shapes. ADI, Acoustic diversity index; FADI, Frequency-dependent acoustic diversity index; FM, Frequency modulated whistles; BVF, Broadband with varying frequency components; BP, Broadband pulse; SH, Strong harmonics; CF, Constant frequency; MIXED, Mixed sound unit shapes.
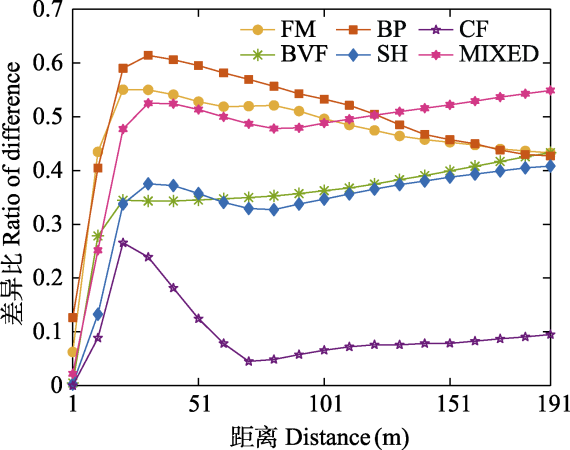
图7 不同类型鸟鸣声时频分布结构条件下差异比随距离的变化曲线。FM: 受频率调制类型信号; BVF: 可变频率分量宽带类型信号; BP: 宽带脉冲类型信号; SH: 强谐波类型信号; CF: 恒定频率类型信号; MIXED: 混合信号。
Fig. 7 The ratio of difference with distance under different sound unit shapes. FM, Frequency modulated whistles; BVF, Broadband with varying frequency components; BP, Broadband pulse; SH, Strong harmonics; CF, Constant frequency; MIXED, Mixed sound unit shapes.
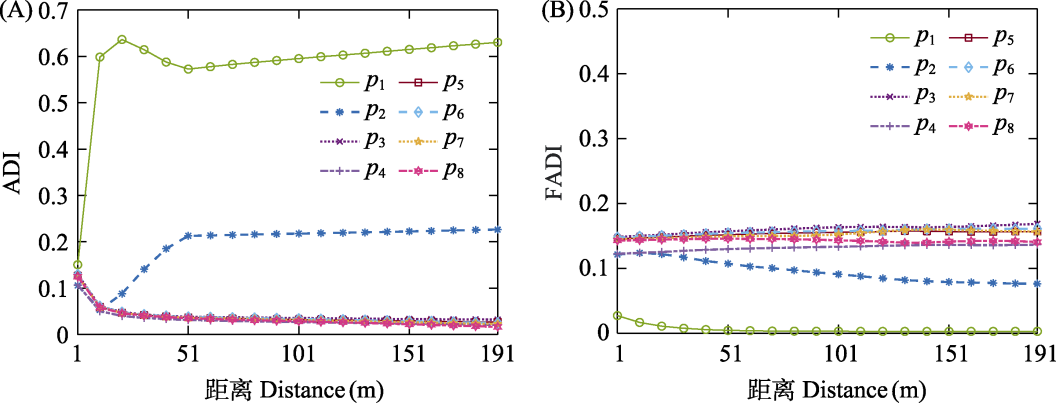
图8 ADI (A)、FADI (B)各子频带值1时频点数量分布占比(pi)随距离的变化曲线
Fig. 8 The proportion of time-frequency bins with a value of 1 in each frequency band (pi) with distance in the calculation of ADI (A) and FADI (B)
图9 ADI (A)、FADI (B)各子频带值1时频点数量(Ni)及全频带值1时频点数量总和(Ntotal)随距离的变化曲线
Fig. 9 The number of time-frequency bins with a value of 1 in each frequency band (Ni) and their sum (Ntotal) with distance in the calculation of ADI (A) and FADI (B)
图10 高SINR条件下(SINR = 30 dB)不同干扰噪声声学背景中的FADI二值化时频谱图。干扰环境分别为: (A)救护车警笛声; (B)打桩机声; (C)汽车鸣笛声; (D)割草机声; (E)雨声; (F)流水声。
Fig. 10 The binary spectrogram of FADI at a high SINR condition (SINR = 30 dB) with different interference backgrounds: (A) Ambulance siren; (B) Pile-driving noise; (C) Car horn; (D) Lawn mower sound; (E) Rain sound; (F) Flowing water sound.
图11 低SINR条件下(SINR = −5 dB)不同干扰噪声声学背景中的FADI二值化时频谱图。干扰环境分别为: (A)救护车警笛声; (B)打桩机声; (C)汽车鸣笛声; (D)割草机声; (E)雨声; (F)流水声。
Fig. 11 The binary spectrogram of FADI at a low SINR condition (SINR = -5 dB) with different interference backgrounds: (A) Ambulance siren; (B) Pile-driving noise; (C) Car horn; (D) Lawn mower sound; (E) Rain sound; (F) Flowing water sound.
| [1] | Beason RD, Riesch R, Koricheva J (2023) Investigating the effects of tree species diversity and relative density on bird species richness with acoustic indices. Ecological Indicators, 154, 110652. |
| [2] | Bradfer-Lawrence T, Bunnefeld N, Gardner N, Willis SG, Dent DH (2020) Rapid assessment of avian species richness and abundance using acoustic indices. Ecological Indicators, 115, 106400. |
| [3] |
Bradfer-Lawrence T, Gardner N, Bunnefeld L, Bunnefeld N, Willis SG, Dent DH (2019) Guidelines for the use of acoustic indices in environmental research. Methods in Ecology and Evolution, 10, 1796-1807.
DOI |
| [4] | Brandes TS (2008) Automated sound recording and analysis techniques for bird surveys and conservation. Bird Conservation International, 18, S163-S173. |
| [5] | Buxton RT, Agnihotri S, Robin VV, Goel A, Balakrishnan R (2018) Acoustic indices as rapid indicators of avian diversity in different land-use types in an Indian biodiversity hotspot. Journal of Ecoacoustics, 2, 8. |
| [6] | Buxton RT, Pearson AL, Allou C, Fristrup K, Wittemyer G (2021) A synthesis of health benefits of natural sounds and their distribution in national parks. Proceedings of the National Academy of Sciences, USA, 118, e2013097118. |
| [7] | Cappe O (1994) Elimination of the musical noise phenomenon with the Ephraim and Malah noise suppressor. IEEE Transactions on Speech and Audio Processing, 2, 345-349. |
| [8] | Cohen I (2004) Speech enhancement using a noncausal Apriori SNR estimator. IEEE Signal Processing Letters, 11, 725-728. |
| [9] | Depraetere M, Pavoine S, Jiguet F, Gasc A, Duvail S, Sueur J (2012) Monitoring animal diversity using acoustic indices: Implementation in a temperate woodland. Ecological Indicators, 13, 46-54. |
| [10] | Diaz SDU, Gan JL, Tapang GA (2023) Acoustic indices as proxies for bird species richness in an urban green space in Metro Manila. PLoS ONE, 18, e0289001. |
| [11] |
Dooley JM, Brown MT (2020) The quantitative relation between ambient soundscapes and landscape development intensity in North Central Florida. Landscape Ecology, 35, 113-127.
DOI |
| [12] | Doser JW, Finley AO, Kasten EP, Gage SH (2020) Assessing soundscape disturbance through hierarchical models and acoustic indices: A case study on a shelterwood logged northern Michigan forest. Ecological Indicators, 113, 106244. |
| [13] | Elise S, Urbina-Barreto I, Pinel R, Mahamadaly V, Bureau S, Penin L, Adjeroud M, Kulbicki M, Bruggemann JH (2019) Assessing key ecosystem functions through soundscapes: A new perspective from coral reefs. Ecological Indicators, 107, 105623. |
| [14] | Fairbrass AJ, Rennert P, Williams C, Titheridge H, Jones KE (2017) Biases of acoustic indices measuring biodiversity in urban areas. Ecological Indicators, 83, 169-177. |
| [15] | Fuller S, Axel AC, Tucker D, Gage SH (2015) Connecting soundscape to landscape: Which acoustic index best describes landscape configuration? Ecological Indicators, 58, 207-215. |
| [16] | Gage SH, Axel AC (2014) Visualization of temporal change in soundscape power of a Michigan lake habitat over a 4-year period. Ecological Informatics, 21, 100-109. |
| [17] | Gagne E, Perez-Ortega B, Hendry AP, Melo-Santos G, Walmsley SF, Rege-Colt M, Austin M, May-Collado LJ (2022) Dolphin communication during widespread systematic noise reduction—A natural experiment amid COVID-19 lockdowns. Frontiers in Remote Sensing, 3, 934608. |
| [18] | Gasc A, Sueur J, Jiguet F, Devictor V, Grandcolas P, Burrow C, Depraetere M, Pavoine S (2013) Assessing biodiversity with sound: Do acoustic diversity indices reflect phylogenetic and functional diversities of bird communities? Ecological Indicators, 25, 279-287. |
| [19] | Hendriks RC, Heusdens R, Jensen J (2010) MMSE based noise PSD tracking with low complexity. In: 2010 IEEE International Conference on Acoustics, Speech and Signal Processing, pp. 4266-4269. Dallas, TX, USA. |
| [20] | Hyland EB, Schulz A, Quinn JE (2023) Quantifying the Soundscape: How filters change acoustic indices. Ecological Indicators, 148, 110061. |
| [21] | Lellouch L, Pavoine S, Jiguet F, Glotin H, Sueur J (2014) Monitoring temporal change of bird communities with dissimilarity acoustic indices. Methods in Ecology and Evolution, 5, 495-505. |
| [22] | Marler PR, Slabbekoorn H (2004) Nature’s Music:The Science of Birdsong. Academic Press, San Diego. |
| [23] | Martin R (2001) Noise power spectral density estimation based on optimal smoothing and minimum statistics. IEEE Transactions on Speech and Audio Processing, 9, 504-512. |
| [24] | McWilliam JN, Hawkins AD (2013) A comparison of inshore marine soundscapes. Journal of Experimental Marine Biology and Ecology, 446, 166-176. |
| [25] | Metcalf OC, Baccaro F, Barlow J, Berenguer E, Bradfer- Lawrence T, Chesini Rossi L, do Vale ÉM, Lees AC (2024) Listening to tropical forest soils. Ecological Indicators, 158, 111566. |
| [26] |
Moreno-Gómez FN, Bartheld J, Silva-Escobar AA, Briones R, Márquez R, Penna M (2019) Evaluating acoustic indices in the Valdivian rainforest, a biodiversity hotspot in South America. Ecological Indicators, 103, 1-8.
DOI |
| [27] | Parker TA (1991) On the use of tape recorders in avifaunal surveys. The Auk, 108, 443-444. |
| [28] | Pieretti N, Duarte MHL, Sousa-Lima RS, Rodrigues M, Young RJ, Farina A (2015) Determining temporal sampling schemes for passive acoustic studies in different tropical ecosystems. Tropical Conservation Science, 8, 215-234. |
| [29] | Rodriguez A, Gasc A, Pavoine S, Grandcolas P, Gaucher P, Sueur J (2014) Temporal and spatial variability of animal sound within a neotropical forest. Ecological Informatics, 21, 133-143. |
| [30] | Rohling H (1983) Radar CFAR thresholding in clutter and multiple target situations. IEEE Transactions on Aerospace and Electronic Systems, (4), 608-621. |
| [31] | Rosenstock SS, Anderson DR, Giesen KM, Leukering T, Carter MF (2002) Landbird counting techniques: Current practices and an alternative. The Auk, 119, 46-53. |
| [32] | Ross SRPJ, Friedman NR, Dudley KL, Yoshimura M, Yoshida T, Economo EP (2018) Listening to ecosystems: Data-rich acoustic monitoring through landscape-scale sensor networks. Ecological Research, 33, 135-147. |
| [33] |
Rumelt RB, Basto A, Mere Roncal C (2021) Automated audio recording as a means of surveying tinamous (Tinamidae) in the Peruvian Amazon. Ecology and Evolution, 11, 13518-13531.
DOI PMID |
| [34] | Shamon H, Paraskevopoulou Z, Kitzes J, Card E, Deichmann JL, Boyce AJ, McShea WJ (2021) Using ecoacoustics metrices to track grassland bird richness across landscape gradients. Ecological Indicators, 120, 106928. |
| [35] | Sohn J, Kim NS, Sung W (1999) A statistical model-based voice activity detection. IEEE Signal Processing Letters, 6, 1-3. |
| [36] | Sueur J, Farina A, Gasc A, Pieretti N, Pavoine S (2014) Acoustic indices for biodiversity assessment and landscape investigation. Acta Acustica United with Acustica, 100, 772-781. |
| [37] | Sueur J, Krause B, Farina A (2019) Climate change is breaking earth’s beat. Trends in Ecology & Evolution, 34, 971-973. |
| [38] | Sugai LSM, Llusia D (2019) Bioacoustic time capsules: Using acoustic monitoring to document biodiversity. Ecological Indicators, 99, 149-152. |
| [39] | Towsey M, Zhang L, Cottman-Fields M, Wimmer J, Zhang JL, Roe P (2014) Visualization of long-duration acoustic recordings of the environment. Procedia Computer Science, 29, 703-712. |
| [40] | van der Lee GH, Desjonquères C, Sueur J, Kraak MHS, Verdonschot PFM (2020) Freshwater ecoacoustics: Listening to the ecological status of multi-stressed lowland waters. Ecological Indicators, 113, 106252. |
| [41] | Weir LA, Mossman MJ (2005) North American amphibian monitoring program (NAAMP). In: Amphibian Declines (ed. Lannoo M), pp.307-313. University of California Press, Berkeley. |
| [42] | Xia BY, Bao CC (2014) Wiener filtering based speech enhancement with Weighted Denoising Auto-encoder and noise classification. Speech Communication, 60, 13-29. |
| [43] | Xu ZY, Chen L, Pijanowski BC, Zhao Z (2023) A frequency-dependent acoustic diversity index: A revision to a classic acoustic index for soundscape ecological research. Ecological Indicators, 155, 110940. |
| [44] | Zhang CY, Zhang Y, Zheng XJ, Gao XH, Hao ZZ (2024) Influence of recording devices and environmental noise on acoustic index scores: Implications for bird sound-based assessments. Ecological Indicators, 159, 111759. |
| [45] | Zhao Z, Xu ZY, Bellisario K, Zeng RW, Li N, Zhou WY, Pijanowski BC (2019) How well do acoustic indices measure biodiversity? Computational experiments to determine effect of sound unit shape, vocalization intensity, and frequency of vocalization occurrence on performance of acoustic indices. Ecological Indicators, 107, 105588. |
| [46] | Znidersic E, Towsey M, Roy WK, Darling SE, Truskinger A, Roe P, Watson DM (2020) Using visualization and machine learning methods to monitor low detectability species—The least bittern as a case study. Ecological Informatics, 55, 101014. |
| [1] | 白梓彤, 王成, 齐志勇. 北京中心城区公园中生物声对植被三维结构的响应[J]. 生物多样性, 2026, 34(4): 25218-. |
| [2] | 谢将剑, 朱梦坤, 蒋爱伍, 肖治术. 聆听生物多样性的未来: 声景自动评估方法的局限性与发展方向[J]. 生物多样性, 2026, 34(2): 25296-. |
| [3] | 胡婉君, 郝泽周, 夏灿玮, 谢将剑. 湿地声景录音策略及面向声景分类的特征选择[J]. 生物多样性, 2024, 32(10): 24121-. |
| [4] | 张屹美, 王言一, 何衍, 周冰, 田苗, 夏灿玮. Beta声学指数的特征和应用[J]. 生物多样性, 2023, 31(1): 22513-. |
| [5] | 孙翊斐, 王士政, 冯佳伟, 王天明. 东北虎豹国家公园森林声景的昼夜和季节变化[J]. 生物多样性, 2023, 31(1): 22523-. |
| [6] | 王士政, 孙翊斐, 李珍珍, 舒越, 冯佳伟, 王天明. 鸟类迁徙对图们江下游湿地声景时间格局的影响[J]. 生物多样性, 2023, 31(1): 22337-. |
| [7] | 王言一, 张屹美, 夏灿玮, Anders Pape Møller. Alpha声学指数效应的meta分析[J]. 生物多样性, 2023, 31(1): 22369-. |
| [8] | 边琦, 王成, 程贺, 韩丹, 赵伊琳, 殷鲁秦. 声学指数在城市森林鸟类多样性评估中的应用[J]. 生物多样性, 2023, 31(1): 22080-. |
| 阅读次数 | ||||||
|
全文 |
|
|||||
|
摘要 |
|
|||||
备案号:京ICP备16067583号-7
Copyright © 2026 版权所有 《生物多样性》编辑部
地址: 北京香山南辛村20号, 邮编:100093
电话: 010-62836137, 62836665 E-mail: biodiversity@ibcas.ac.cn
![]()