

生物多样性 ›› 2015, Vol. 23 ›› Issue (4): 507-518. DOI: 10.17520/biods.2015046 cstr: 32101.14.biods.2015046
收稿日期:2015-02-27
接受日期:2015-05-07
出版日期:2015-07-20
发布日期:2015-08-03
通讯作者:
马克明
基金资助:Received:2015-02-27
Accepted:2015-05-07
Online:2015-07-20
Published:2015-08-03
Contact:
Ma Keming
摘要:
保护地建设已成为全球生物多样性保护的第一道防线。掌握其在不同尺度上的发展状况和变化趋势对保护地规划和建设有重要意义。针对已有研究在时间跨度、空间尺度以及结果对比方面的不足, 本文基于世界保护地数据库(World Database of Protected Areas, http://www.protectedplanet.net), 对全球、洲际、地区及国家尺度1950-2013年陆地保护地的增长情况进行描述和短期预测。结果发现: (1)全球保护地增长速率不断加快, 特别是在20世纪90年代以后。(2)洲际和地区保护地发展大致呈现3种增长趋势: 在美洲及大洋洲, 多数地区的保护地增长速率一直在加快; 在亚洲和欧洲, 多数地区的发展高峰出现在20世纪80、90年代; 在非洲, 多数地区的发展高峰为20世纪70年代及21世纪前10年。(3)各国保护地建设存在不平衡性, 仍有近一半国家的陆地保护地比例小于10%, 但这种差距随时间的推移有缩小的趋势。(4)绝大部分保护地增速均匀性低的国家分布在非洲。(5)虽然全球的《爱知生物多样性目标》在2020年预计不能完成, 但包括中国在内的22个国家有望如期达到目标。本文结果为未来保护地规划和建设工作的开展提供了参考依据。
范边, 马克明 (2015) 全球陆地保护地60年增长情况分析和趋势预测. 生物多样性, 23, 507-518. DOI: 10.17520/biods.2015046.
Bian Fan, Keming Ma (2015) Analysis and prediction of development in global terrestrial protected areas between 1950 and 2013. Biodiversity Science, 23, 507-518. DOI: 10.17520/biods.2015046.

图1 1950-2013年洲际尺度陆地保护地发展。(a)各洲陆地保护地面积增长; (b)各洲保护地增量比例发展。
Fig. 1 Development of protected areas (PAs) in continental scale from 1950 to 2013. (a) The growth of areas in terrestrial PAs within continents; (b) The development in ratio of PAs increments within continents.

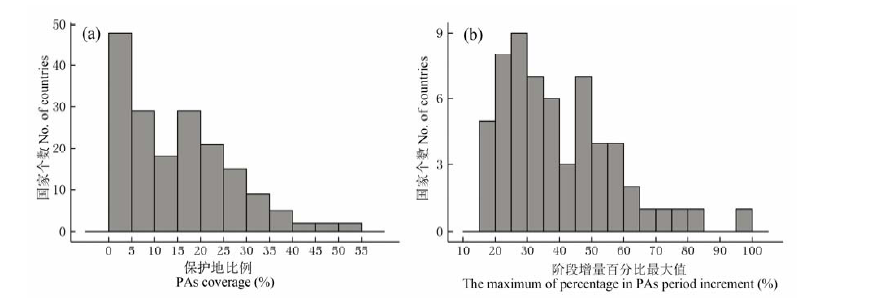
图4 陆地保护地发展的国家分布。(a)保护地比例分布; (b)阶段增量百分比最大值分布。
Fig. 4 The distribution of terrestrial PAs developments within countries. (a) The distribution of PAs coverage within countries; (b)The distribution in maximum of PAs period increment within countries.

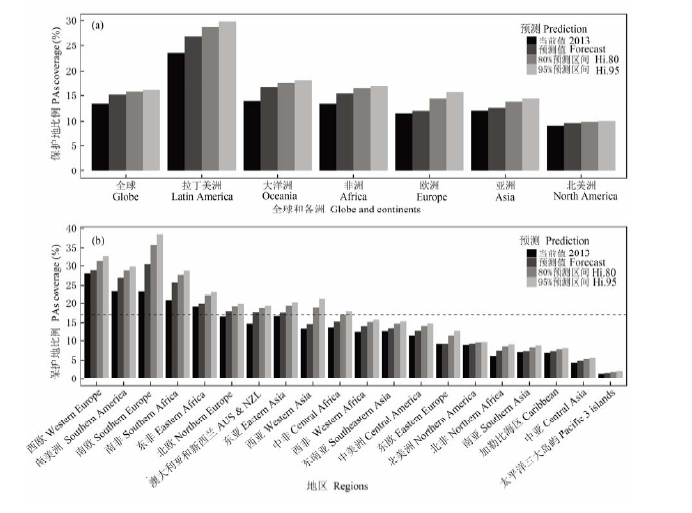
图5 陆地保护地增长趋势的短期预测(2020年)。(a)全球、洲际预测; (b)地区预测。
Fig. 5 The prediction of terrestrial PAs development in 2020. (a) The prediction in global and continental scales; (b) The predictionin regional scale.
| 1 | Andrawis RR, Atiya AF (2009) A new Bayesian formulation for Holt’s exponential smoothing.Journal of Forecasting, 28, 218-234. |
| 2 | Balmford A, Bruner A, Cooper P, Costanza R, Farber S, Green RE, Jenkins M, Jefferiss P, Jessamy V, Madden J, Munro K, Myers N, Naeem S, Paavola J, Rayment M, Rosendo S, Roughgarden J, Trumper K, Turner RK (2002) Economic reasons for conserving wild nature.Science, 297, 950-953. |
| 3 | Balmford A, Gaston KJ, Blyth S, James A, Kapos V (2003) Global variation in terrestrial conservation costs, conservation benefits, and unmet conservation needs.Proceedings of the National Academy of Sciences, USA, 100, 1046-1050. |
| 4 | Bertzky M, Stoll-Kleemann S (2009) Multi-level discrepancies with sharing data on protected areas: what we have and what we need for the global village.Journal of Environmental Management, 90, 8-24. |
| 5 | Brooks TM, Bakarr MI, Boucher T, da Fonseca GAB, Hilton-Taylor C, Hoekstra JM, Moritz T, Olivier S, Parrish J, Pressey RL, Rodrigues ASL, Sechrest W, Stattersfield A, Strahm W, Stuart SN (2004) Coverage provided by the global protected-area system, is it enough?BioScience, 54, 1081-1091. |
| 6 | Butchart SH, Walpole MM, Collen B, van Strien A, Scharlemann JPW, Almond REA, Baillie JEM, Bomhard B, Brown C, Bruno J, Carpenter KE, Carr GM, Chanson J, Chenery AM, Csirke J, Davidson NC, Dentener F, Foster M, Galli A, Galloway JN, Genovesi P, Gregory RD, Hockings M, Kapos VNC, Lamarque JF, Leverington F, Loh J, McGeoch MA, McRae L, Minasyan A, Morcillo MH, Oldfield TEE, Pauly D, Quader S, Revenga C, Sauer JR, Skolnik B, Spear D, Stanwell-Smith D, Stuart SN, Symes A, Tierney M, Tyrrell TD, Vie JC, Watson R (2010) Global biodiversity, indicators of recent declines.Science, 328, 1164-1168. |
| 7 | Cabral R, Brito D (2013) Temporal and spatial investments in the protected area network of a megadiverse country.Zoologia, 30, 177-181. |
| 8 | Chape S, Blyth S, Fish L, Fox P, Spalding M (2003) 2003 United Nations List of Protected Areas. |
| 9 | Chape S, Harrison J, Spalding M, Lysenko I (2005) Measuring the extent and effectiveness of protected areas as an indicator for meeting global biodiversity targets. Philosophical Transactions of the Royal Society B: Biological Sciences, 360, 443-455.Convention on Biological Diversity (CBD) (2004) Decision adopted by the conference of the parties to the convention on biological diversity at its seventh meeting: VII/30. strategic plan, future evaluation of progress. |
| 10 | Convention on Biological Diversity (CBD) (2010)Strategic Plan for Biodiversity 2011-2020 and the Aichi Targets. https://www.cbd.int/doc/strategic-plan/2011-2020/Aichi-Targets-EN.pdf. (accessed July 2014) |
| 11 | Dudley N, Parrish JD, Redford KH, Stolton S (2010) The revised IUCN protected area management categories: the debate and ways forward.Oryx, 44, 485-490. |
| 12 | Hoekstra JM, Boucher TM, Ricketts TH, Roberts C (2005) Confronting a biome crisis: global disparities of habitat loss and protection.Ecology Letters, 8, 23-29. |
| 13 | Holt CC (2004) Forecasting seasonals and trends by exponentially weighted moving averages.International Journal of Forecasting, 20, 5-10. |
| 14 | Hyndman RJ, Khandakar Y (2008) Automatic time series forecasting: the forecast package for R.Journal of Statistical Software, 27, 1-22. |
| 15 | Hyndman RJ, Koehler AB (2008) Holt’s linear method. In: Forecasting with Exponential Smoothing (eds Hyndman RJ, Koehler AB, Ord JK, Snyder RD), pp. 25-26. Springer-Verlag, Berlin. |
| 16 | International Union for Conservation of Nature (IUCN) (1982) National Parks, Conservation, and Development: The Role of Protected Areas in Sustaining Society. |
| 17 | International Union for Conservation of Nature (IUCN) (2008) Guidelines for Applying Protected Area Management Categories. |
| 18 | International Union for Conservation of Nature (IUCN), United Nations Environment Programme - World Conservation Monitoring Centre (UNEP-WCMC) (2014) The World Database on Protected Areas (WDPA). www. protectedplanet.net. (accessed October 2014) |
| 19 | Jenkins CN, Joppa L (2009) Expansion of the global terrestrial protected area system. Biological Conservation, 142, 2166-2174.McDonald RI, Boucher TM (2011) Global development and the future of the protected area strategy.Biological Conservation, 144, 383-392. |
| 20 | Naughton-Treves L, Holland MB, Brandon K (2005) The role of protected areas in conserving biodiversity and sustaining local livelihoods.Annual Review of Environment and Resources, 30, 219-252. |
| 21 | Nelson A, Chomitz KM (2011) Effectiveness of strict vs. multiple use protected areas in reducing tropical forest fires: a global analysis using matching methods. PLoS ONE, 6, e22722. |
| 22 | O’Neill DW, Abson DJ (2009) To settle or protect? A global analysis of net primary production in parks and urban areas. Ecological Economics, 69, 319-327. |
| 23 | Pereira HM, Cooper HD (2006) Towards the global monitoring of biodiversity change.Trends in Ecology and Evolution, 21, 123-129. |
| 24 | Pressey RL, Cowling RM, Rouget M (2003) Formulating conservation targets for biodiversity pattern and process in the Cape Floristic Region, South Africa.Biological Conservation, 112, 99-127. |
| 25 | Pyke CR (2007) The implications of global priorities for biodiversity and ecosystem services associated with protected areas.Ecology and Society, 12, 1-10. |
| 26 | Rodrigues ASL, Andelman SJ, Bakarr MI, Boitani L, Brooks TM, Cowling RM, Fishpool LCD, da Fonseca GAB, Gaston KJ, Hoffmann M, Long JS, Marquet PA, Pilgrim JD, Pressey RL, Schipper J, Sechrest W, Stuart SN, Underhill LG, Waller RW, Watts MEJ, Yan X (2004) Effectiveness of the global protected area network in representing species diversity.Nature, 428, 640-643. |
| 27 | Rodrigues ASL, Gaston KJ (2001) How large do reserve networks need to be?Ecology Letters, 4, 602-609. |
| 28 | Soule ME, Sanjayan MA (1998) Conservation targets: do they help?Science, 279, 2060-2061. |
| 29 | Soutullo A, de Castro M, Urios V (2008) Linking political and scientifically derived targets for global biodiversity conservation: implications for the expansion of the global network of protected areas.Diversity and Distributions, 14, 604-613. |
| 30 | Stamper TJ, Hicke JA, Jennings M, Aycrigg J (2013) Spatial and temporal patterns of changes in protected areas across the southwestern United States.Biodiversity and Conservation, 22, 343-356. |
| 31 | Steinberg PF (1998) Defining the global biodiversity mandate: implications for international policy.International Environmental Affairs, 10, 113-130. |
| 32 | Struhsaker TT, Struhsaker PJ, Siex KS (2005) Conserving Africa’s rain forests: problems in protected areas and possible solutions.Biological Conservation, 123, 45-54. |
| 33 | United Nations (UN) (2012) Member States of the United Nations. |
| 34 | United Nations Environment Progamme-World Conservation Monitoring Centre (UNEP-WCMC) (2005) Development of the World Database on Protected Areas. |
| 35 | United Nations Statistics Division (2013) Country or Area & Region Codes: Composition of Regions. |
| 36 | Venter O, Fuller RA, Segan DB, Carwardine J, Brooks T, Butchart SHM, Marco MD, Iwamura T, Joseph L, O’Grady D, Possingham HP, Rondinini C, Smith RJ, Venter M, Watson JEM (2014) Targeting global protected area expansion for imperiled biodiversity.PLoS Biology, 12, e1001891. |
| 37 | Zimmerer KS, Galt RE, Buck MV (2004) Globalization and multi-spatial trends in the coverage of protected-area conservation (1980-2000).Ambio, 33, 520-529. |
| [1] | 徐靖, 王金洲, 李俊生. 商业界参与生物多样性主流化的进展、路径与建议[J]. 生物多样性, 2022, 30(11): 22078-. |
| [2] | 井新, 蒋胜竞, 刘慧颖, 李昱, 贺金生. 气候变化与生物多样性之间的复杂关系和反馈机制[J]. 生物多样性, 2022, 30(10): 22462-. |
| [3] | 冯斌, 李迪强, 张于光, 薛亚东. 基于爱知生物多样性目标11的我国自然保护地管理有效性评估进展与分析[J]. 生物多样性, 2021, 29(2): 150-159. |
| [4] | William J.McShea, 申小莉, 刘芳, 王天明, 肖治术, 李晟. 中国的野生动物红外相机监测需要统一的标准[J]. 生物多样性, 2020, 28(9): 1125-1131. |
| [5] | 刘文静, 徐靖, 耿宜佳, 田瑜, 银森录. “2020年后全球生物多样性框架”的谈判进展以及对我国的建议[J]. 生物多样性, 2018, 26(12): 1358-1364. |
| [6] | 李瑶, 肖向明, 李香萍, 马俊, 陈帮乾, 秦元伟, 董金玮, 赵斌. 中国森林破碎化多尺度评价[J]. 生物多样性, 2017, 25(4): 372-381. |
| [7] | 戴蓉, 吴翼. “爱知生物多样性目标”国家评估指标的对比研究及对策建议[J]. 生物多样性, 2017, 25(11): 1161-1168. |
| [8] | 范边, 马克明. 全球陆地保护地与城市距离变化分析[J]. 生物多样性, 2015, 23(6): 802-814. |
| [9] | 赵海军, 纪力强. 大尺度生物多样性评价[J]. 生物多样性, 2003, 11(1): 78-85. |
| 阅读次数 | ||||||
|
全文 |
|
|||||
|
摘要 |
|
|||||
备案号:京ICP备16067583号-7
Copyright © 2022 版权所有 《生物多样性》编辑部
地址: 北京香山南辛村20号, 邮编:100093
电话: 010-62836137, 62836665 E-mail: biodiversity@ibcas.ac.cn
