


物种密度的估计对于了解动物种群动态以及评估和选择管理措施至关重要, 是野生动物生态学和保护生物学研究的核心问题(Dénes et al, 2015)。截至目前提出了多种估算动物种群密度的方法, 包括标记-重捕法(capture-recapture, CR)、距离取样法(distance sampling, DS)、基于遇见率法和遥感影像直接计数法等, 每种方法可通过不同的模型结合不同数据源(如航空数据、DNA数据、红外相机数据、声音计数数据等)来实现, 这为动物种群密度估算提供了多种选择(Iijima, 2020; 李月辉, 2021)。然而, 准确估计种群密度一直是野生动物管理和保护面临的一个挑战(Nichols & Williams, 2006; Kamgaing et al, 2018; Hu et al, 2021)。红外相机技术(camera- trapping)在过去十几年里快速发展, 与传统的技术手段相比, 其为野生动物野外调查提供了低成本的解决方案(O’Connell et al, 2011)。红外相机具有全天候工作、干扰性低的特点, 并可同时获取多个物种的信息, 也使获取隐蔽环境中稀有物种的信息成为可能(Steenweg et al, 2017)。红外相机已成为动物生态学和保护生物学研究的重要手段, 广泛用于评估野生动物分布、行为和群落结构等(Rovero et al, 2013; Fleming et al, 2014; 李晟等, 2014; Burton et al, 2015)研究中, 并已成为监测野生动物种群数量和动态的核心工具。
在无法准确估计密度时, 研究者会采用相对多度或物种占域来衡量物种种群数量(Williams et al, 2002; O’Brien, 2011; Kéry & Royle, 2016)。相对多度指数(relative abundance index, RAI)是通过计算单位调查时间(相机的拍摄天数)内某一物种独立有效照片数量来估计种群相对多度(Carbone et al, 2001; Rovero & Marshall, 2009)。RAI作为代表单位空间内动物数量多少的相对指标, 虽然在生物多样性评估和动物本底清查中应用频率较高(Sollmann et al, 2013), 但该指数易受物种自身特征、探测率和环境因素的影响, 应用时存在一定的局限性(Williams et al, 2002; 陈立军等, 2019)。由于影响探测率的因素还与动物的数量有关, Royle (2004)提出的N-Mixture模型使用计数数据估计物种多度, 但该模型在应用时需要注意不完美探测和零膨胀问题(Dénes et al, 2015)。MacKenzie等(2002)借助概率论方法提出了占域模型(occupancy model), 可以估计当动物探测率小于1以及探测率随调查点特征、时间或环境变化时物种的占域率。该模型不需要动物的计数数据, 只需要获取物种在某一时段是否出现, 并通过估计物种所占调查点的比例来评估物种的相对多度。然而不同物种探测率可能随时空的变化而变化, 所以每个调查点必须重复调查多次并结合探测变量才能得到占域率的无偏估计(Gu & Swihart, 2004)。占域模型可以同时估计多个物种的占域率(Kéry & Royle, 2016), 但占域率是代表动物空间分布或生境使用强度的指标, 而不是密度的指标。因此, 需要能够准确估计种群密度的可行方法。
目前采用红外相机数据进行分析的模型大多发展于标记-重捕法、基于遇见率法和距离取样法(图1)。基于标记-重捕法发展的空间标记-重捕(spatial capture-recapture, SCR)模型主要用于可以进行个体识别的物种, 如雪豹(Panthera uncia) (Alexander et al, 2016)、东北虎(Panthera tigris altaica) (Xiao et al, 2016)等大型食肉动物。然而, 大多数动物不具备个体识别特征且种群数量大, 采用该方法时识别难度及工作量大, 难以经济有效地估计种群密度。后来出现了只需要识别种群中一部分个体的空间标记-重现(spatial mark-resight, SMR)模型(Whittington et al, 2018)和不需要个体识别的空间计数(spatial count, SC)模型(Chandler & Royle, 2013), 通过动物活动中心的数量和分布来估计定义区域内动物的密度, 这些模型不仅需要考虑动物的家域范围, 还要求监测数据的空间相关性。
图1
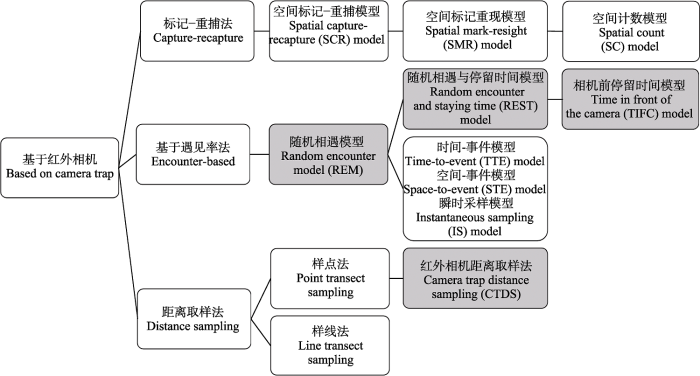
图1
基于红外相机估算动物种群密度的模型
Fig. 1
Models for estimating animal population density based on camera trap
基于遇见率法发展的随机相遇模型(random encounter model, REM)由Rowcliffe等(2008)提出, 该模型既不需要考虑动物家域范围也不需要进行个体识别, 而是通过记录拍摄独立事件照片数、动物运动的总距离以及相机的拍摄范围参数来估计动物种群密度。但其中动物运动速度参数(或动物日活动距离)测量难度大, 于是有研究者将时间作为速度的替代, 在此基础上发展出了随机相遇与停留时间(random encounter and staying time, REST)模型和相机前停留时间(time in front of the camera, TIFC)模型。除此之外, 基于REM还发展出了时间-事件(time-to-event, TTE)模型、空间-事件(space-to-event, STE)模型和瞬时采样(instantaneous sampling, IS)模型(模型的原理和假设详见Moeller等(2018))。TTE模型认为动物种群密度高则拍摄率高, 这样拍摄到动物的时间间隔短(Moeller et al, 2018), 该模型需要测算出动物的移动速度; STE模型和IS模型是TTE模型的扩展, 虽然不需要动物的移动速度, 但这两种模型都未考虑相机位点间物种多度的差异对探测率的影响(Gilbert et al, 2021)。
距离取样法最早由Buckland等(1993)提出, 包括样点和样线抽样, 该方法通过观测动物个体到样点或样线的距离估计动物探测率进而估计动物种群密度(Buckland et al, 2015)。Howe等(2017)发展的基于红外相机的距离取样法(camera trap distance sampling, CTDS)是距离取样中样点法抽样的扩展, 目前认为CTDS是一种估算动物种群密度的有效方法, 正在得到广泛应用(Amin et al, 2022)。最近, Li等(2022)开发了一种基于足迹链的种群密度估计模型, 不需要个体识别, 而是通过模拟的动物运动数据和红外相机捕获数据来预测个体数量, 以此估计种群密度。该模型与样线法调查、随机相遇模型相比提供了更可靠的密度估计, 然而对动物活动规律的精准把握是决定该模型精度的关键。
国内外学者不断改进和完善各类动物种群密度估算的方法, 使密度估计的方法模型得到了较快发展(Amburgey et al, 2021; Gilbert et al, 2021)。在估计可个体识别物种密度方面, Wang等(2018)在东北虎豹国家公园使用SCR方法估计了东北虎种群密度, Alexander等(2016)采用SCR方法评估了祁连山国家级自然保护区雪豹种群密度; 对不可个体识别动物的密度估计方面, 主要以REM及目测计数的距离取样法为主, 如应用REM估算黄山市各县野猪(Sus scrofa)种群的密度(余立华, 2021), 以及采用目测计数距离取样法估算有蹄类动物密度(卢琳琳等, 2020; 孙萍等, 2021; 谢建冲等, 2022), 而其他模型的应用相对较少。李月辉(2021)归纳了国际上种群数量估算方法的研究进展, 建立了大中型兽类种群数量估算的研究框架, 帮助国内研究者了解种群密度估计可选择的采样方法及方法模型。我国拥有大量的红外相机数据, 但现有数据可能并不能满足每个模型的假设和数据需求, 极大地限制了红外相机技术在估算种群密度方面的应用。本文归纳了基于红外相机数据源估计种群密度的方法模型(图1), 以期为采用红外相机数据估算种群密度提供方法参考。文章主要介绍了4种基于红外相机数据源估计种群密度的模型, 即基于遇见率的随机相遇模型、随机相遇与停留时间模型、相机前停留时间模型以及红外相机距离取样法, 介绍每种模型的基本原理和假设、野外调查中的技术要点, 并给出数据处理和统计分析方法以及模型代码源, 总结了每个模型的数据需求、优点和缺点, 为现阶段我国学者基于红外相机技术估计动物种群密度提供方法参考。
1 模型原理与假设
1.1 随机相遇模型
随机相遇模型的基本原理是基于二维气体模型的随机碰撞, 相遇率等于一定时间内粒子覆盖面积与二维平面总面积之比。经典的二维模型假设一个物体周围有一个圆形区域, 另一物体进入圆形区域即发生相遇(Hutchinson & Waser, 2007)。模型将物体及周围圆形区域看作相机及相机视野, 动物进入相机的圆形区域即发生相遇, 二者扫过的面积则等于相机圆形区域以动物运动速度移动扫过的面积(图2A)。动物移动覆盖的面积就可以表示为动物日平均速度(v)、运动时间(H)、圆形区域直径(2R)及动物数量的乘积, 动物数量由密度(D)和区域总面积(A)的乘积给出, 再同时除以区域总面积A, 则可得到相遇次数Y, 即Y = 2RvHD, 从而推导出动物密度(D)的估计值, 即: D = Y / (2RvH) (Rowcliffe et al, 2008)。然而, 相机拍摄范围多为扇形, 并非一个完整的圆形, 这种情况下相机移动时覆盖面积的宽度不再是圆形的直径, 而是相机拍摄范围(扇形)从任何角度移动时的宽度, 可以理解为相机探测区域呈现给动物的剖面宽度(图2B)。Rowcliffe等(2008)根据扇形的角度和半径, 将动物所有可能进入扇形探测区的剖面宽度取平均值, 代入公式得到:
图2
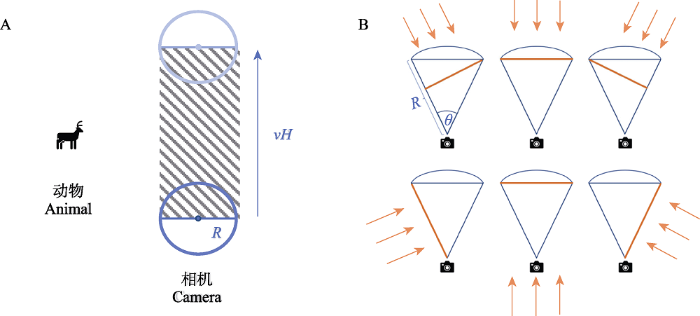
图2
相机以类似动物速度运动所覆盖面积(A)和动物从6个典型角度接近相机探测区域的剖面图(B) (修改自Rowcliffe et al, 2008)。A图中阴影部分为圆形区域以动物运动速度移动时所覆盖的面积, 其中v为动物运动速度(m/h), H为相机工作时间(h), R为圆形区域的半径(m)。B图中扇形表示相机探测区域, R为相机探测区域半径(m), θ为相机探测区域角度, 箭头表示动物接近相机探测区域的方向, 动物接近相机探测区域的剖面用橙色粗线表示。
Fig. 2
Coverage area of a camera moving at a speed similar to that of an animal (A) and the profile of an animal approaching the probe area from six typical angles (B) (Modified from Rowcliffe et al, 2008). The shadow part in A is the area covered by the circular region moving at the animal speed, where v is the animal speed, H is the camera working time, and R is the radius of the circular region. In B, the sector represents the camera detection area; R is the radius of the camera detection area; θ is the angle of the camera detection area; the arrow indicates the direction of the animal approaching the camera detection area; and the profile of the animal approaching the camera detection area is represented by orange rough line.
公式中, Y为相机拍到的独立事件数, H为相机工作时间(h), R为相机探测区域的半径(m), θ为相机探测区域的角度, g为集群大小(独居动物g = 1)。
表1 随机相遇模型(REM)、随机相遇与停留时间(REST)模型、相机前停留时间(TIFC)模型以及红外相机距离取样法(CTDS)的模型假设和数据需求
Table 1
| REM | REST | TIFC | CTDS | ||
|---|---|---|---|---|---|
| 模型假设 Model assumptions | 相机随机放置 Random placement of cameras | √ | √ | √ | √ |
| 动物运动独立于相机(动物运动不受相机影响) Animal movement is independent of camera | √ | √ | √ | √ | |
| 种群封闭 Closed population | √ | √ | √ | √ | |
| 探测区域内的动物能被完美探测到 Animals in the detection area can be perfectly detected | √ | √ | √ | √ | |
| 观测到的动物停留时间的分布与动物实际运动的分布很好地吻合 The observed distribution of staying time in the focal area must represent a good fit for the distribution that animal movements actually follow | √ | ||||
| 观测到的动物停留时间符合一定的参数分布 The observed staying time must follow a given parametric distribution | √ | ||||
| 距离测量是精确的 Distances measured accurately | √ | ||||
| 动物距离的分布可用已知函数拟合 Distribution of animal distance can be fitted by known functions | √ | ||||
| 视野面积 Area of viewshed | √ | √ | √ | ||
| 数据需求 Data requirements | 相机工作时间 Working hours of cameras | √ | √ | √ | √ |
| 动物数量 Number of the animals | √ | √ | √ | √ | |
| 动物运动速度 Animal movement speed | √ | ||||
| 动物停留时间 Animal staying time in front of the camera | √ | √ | |||
| 动物距相机距离 Distance between animal and camera | √ | ||||
| 模型产出 Model output | 是否可以基于协变量外推 Covariate-driven prediction of density beyond the sampling frame | √ | √ |
动物平均运动速度和相机探测区域估计的准确性会影响REM的精度, 若动物速度被低估, 密度可能被高估(Pettigrew et al, 2021)。另外, 采用其他地区动物日活动范围估算本地动物种群密度时可能会存在较大误差。动物速度需要跟踪动物的定位数据(如GPS项圈数据)或对动物行为进行密集观察测量得出。若研究对象为易捕获的动物, 可以用GPS项圈对动物日移动距离进行跟踪; 若研究对象为不易捕获的动物, 则可根据动物在相机前走过的路径长度与经过的时间计算运动速度。关于相机探测区域问题, 相机在不同生境或对不同物种的探测率不同。许多研究者对使用相机出厂半径和角度定义探测区域产生怀疑, 于是Rowcliffe等(2011)对该模型进行了改进, 通过动物初次停留位置计算不同物种的有效探测距离和角度(图3A), 由此确定不同物种或不同生境下物种的探测区域。
图3
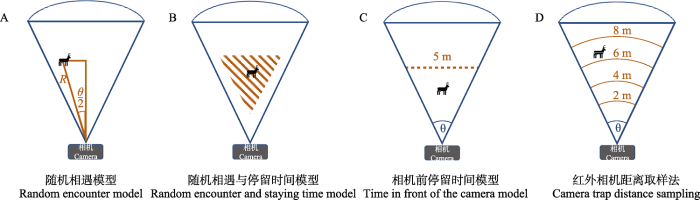
图3
四种模型相机探测区域示意图。(A)随机相遇模型(REM): 根据动物在相机视野初次停留位置测量计算该物种的平均探测半径R和平均探测角度θ; (B)随机相遇与停留时间(REST)模型: 探测区域为阴影部分(焦点区域), 认为该区域相机对目标物种的探测率最高; (C)相机前停留时间(TIFC)模型: 探测半径由标记距离与其范围内动物探测概率计算得到(以5 m距离为例); (D)红外相机距离取样法(CTDS): 以图中的距离标志为例, 2 m、4 m、6 m、8 m为标志距离, 其中8 m为截断距离(最远标志距离, 也被认为是探测区域半径), 该距离范围内为探测区域。
Fig. 3
Camera detection area of four models. (A) Random encounter model (REM): the average detection radius (R) and the average detection angle (θ) of the species were calculated according to the measurement of the initial residence position of the animal. (B) Random encounter and staying time (REST) model: The detection area is the shadow part, which is considered to be the area with the highest detection rate of the focal species by the camera. (C) Time in front of the camera (TIFC) model: the detection radius is calculated by the marker distance and the detection probability of animals within its range (taking the distance of 5 m as an example). (D) Camera trap distance sampling (CTDS) model: In the graph, 2 m, 4 m, 6 m and 8 m are marked distances, of which 8 m is the truncated distance (also known as the radius of the detection area), within which the detection area is located.
近十几年来, 许多学者对REM进行了扩展, 增大了其适用性。如Lucas等(2015)开发了一种广义随机相遇模型(generalized REM, gREM), 即根据红外相机和声学探测器的计数数据估计动物密度, 主要适用于海洋或陆地环境中可以通过视觉或声音计数的动物, 如: 鲨鱼、鲸类、鸟类、回声定位蝙蝠或大型猫科动物等。Jourdain等(2020)认为REM在建模过程中未考虑多个变异来源, 故提出了综合随机相遇模型(integrated REM, iREM), 该模型假设动物的移动速度是可变的, 并允许将栖息地类型等协变量和随机效应纳入模型。Wearn等(2022)根据动物在连续拍摄图像中像素位置的变化来估计动物移动速度, 解决了REM中运动速度的问题, 并建立了基于贝叶斯框架的REM, 将协变量引入模型, 另外该模型还可以同时对多个物种以及稀有物种进行密度估计。
1.2 随机相遇与停留时间模型
式中, S为焦点区域的面积(m2), E(Y)为期望相遇次数, E(T)为期望停留时间(s)。
该模型除了REM的假设外还增加了3个假设: (1)相机能探测到进入焦点区域的动物; (2)在焦点区域, 动物停留时间的分布必须与动物实际运动的分布吻合; (3)观察到的动物停留时间符合一定的参数分布(表1)。在焦点区域对动物的漏拍会减少有效探测的数量, 使模型难以应用于低密度物种。当动物长时间不活动时, 就难以被相机探测到, 那么观察到的动物停留时间的分布就无法反映动物的实际分布。这种情况下, 动物密度很大程度上被高估了, 为了克服这个问题, 需要使用动物活动时间比例或估计动物在活动阶段的平均停留时间来纠正偏差。
1.3 相机前停留时间模型
考虑到相机的录像模式及视频片段可能限制红外相机数据的应用, Huggard (2018)在REST模型的基础上发展了相机前停留时间模型, 通过连续照片中动物在探测区域停留的总时间与相机有效探测面积的关系估算动物密度。另外, 该模型还采用简单的距离取样理论计算相机视野的有效探测距离, Huggard (2018)和Becker等(2022)在应用该模型时在5 m距离处设置了距离标志(图3C), 并将动物距相机距离分为小于5 m和大于5 m两种情况, 然后通过5 m范围内动物的探测率计算相机视野的有效探测距离, 以此定义有效探测面积(在实际操作中可以多设置几个距离标志, 这样可以拟合探测曲线, 进而得到更精确的有效探测距离)。该模型计算动物密度的公式如下:
式中, N为连续照片中动物的平均数量(只), T为连续照片中动物在相机探测区域的停留时间(s), S = (π × EDD2 × θ) / 360, 为探测区域的面积(m2), θ为相机探测区域角度, EDD = n / sqrt(p< n), 为有效探测距离(effective detection distance, m), 当n = 5 m时, 即p< 5 m代表5 m标志距离范围内动物照片的占比。
EDD是根据标志距离及标志距离范围内动物的探测率计算的, 标志距离可根据实际野外条件或物种大小及探测率择优选择。可以选择一个距离标志, 也可以采用多个距离标志, 然后进行函数拟合, 按照距离取样理论计算有效探测距离。
TIFC模型应用时除了需要满足REM的3个假设外, 还要求动物行为不受标志杆影响以及动物在标记距离范围内能被相机探测到。另外, 若相机安装日期不同, 该模型还要求物种的可探测性没有特别大的季节性变化, 也就是要确保相机同时架设, 至少使它们在同一段调查期间内运行, 或者标准化为一个共同的时期。TIFC模型是新发展的模型, 目前还没有利用该模型模拟密度的空间变化以及基于协变量进行其他区域密度预测的案例。
1.4 红外相机距离取样法
距离取样认为动物的探测概率随距离的增加而降低, 红外相机距离取样法通过构建动物与相机之间距离的函数来估算区域内未观察到的动物的数量(Howe et al, 2017), 以此估计动物种群密度。公式如下:
式中, Nk为相机k点的动物数量, pk为动物的探测概率, 由动物距相机距离的函数拟合得出; ek = (θ / 2π) × (Hk / t), 为相机k点的采样努力, 其中, Hk为相机k的工作时间(s), t是快照之间的时间间隔(s)。
红外相机距离取样法除了需要满足REM的3个假设外, 还需满足: (1)样点上的动物能被探测到; (2)距离测量是精确的; (3)动物距相机距离的分布可用已知函数拟合(表1)。距离取样法最重要的是对动物距相机距离的测量, 由于红外相机距离取样是样点法抽样的扩展, 一般认为红外相机的拍摄范围为弧形, 所以相比样线法抽样来说, 测量的距离不再是垂直距离, 而是动物到相机的水平径向距离(图3D)。距离取样假设观察到的相机与动物之间的距离是独立的, 非独立观测(多个个体出现在同一照片中)会导致数据的过度离散, 使探测函数选择过于复杂的模型, 影响模型估计的准确性和精度。Howe等(2019)通过模拟数据和真实数据来评估过度离散因子(overdispersion factor), 并优化模型选择标准以降低数据过度离散对密度估计的影响。CTDS不仅在独居动物和群居动物中进行过测试, 对多物种密度估计也进行了测试(Mason et al, 2022)。Howe等(2017)的CTDS公式不能外推密度的空间变化(Kéry & Royle, 2016), 因此该模型不能使用协变量对调查区内外的密度进行预测。虽然等级距离采样(hierarchical distance sampling)允许使用协变量模拟多度的空间变化, 但其尚未在红外相机中实现(Kéry & Royle, 2016)。另外, CTDS只有在研究对象活跃且可探测到时才是无偏的; 当动物不活跃时, 需要考虑目标物种的活动模式和活动时间(Howe et al, 2017; Cappelle et al, 2019)。
2 红外相机数据采集与处理
在过去的十几年里, 基于红外相机数据, 研究者已经发展了多种方法模拟大量不可个体识别动物的数量或密度, 每一种方法的复杂性和它们之间的不一致性对实践者来说仍具有相当大的挑战。面对上述多种研究方法, 我们构建了从研究目标确定、野外相机布设、调查中的技术要点到数据分析等方面的框架图(图4), 以帮助研究者找到最适合的方案。
图4
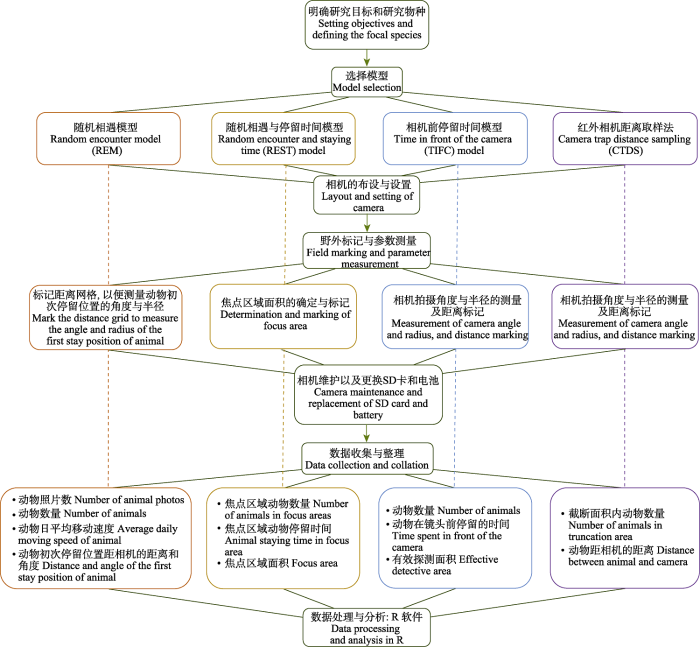
图4
四种模型估计种群密度的使用方法
Fig. 4
The method of estimating population density for four models
2.1 数据采集
2.1.1 明确研究目标
(1)研究目标。调查前应明确研究目标是估计动物种群密度还是评价环境变量对密度的影响, 因为这影响相机位点的空间布设。
(3)调查区域。没有一个调查设计对所有物种都是最佳的, 调查区域要求能代表整个研究区的空间异质性。
(4)调查周期。调查时间应尽量避免动物空间行为不稳定的季节, 如种群迁徙或动物发情的季节等。
2.1.2 相机布设
四种模型均不要求监测数据的空间相关性, 所以红外相机布设密度主要根据所选的取样方法和目标物种的家域范围而定。取样方法主要包括随机取样、系统网格取样和分层随机取样(图5)。随机取样一般是估计种群平均密度的首选方案, 选择完调查区域后让计算机生成随机点, 如Caravaggi等(2016)在应用REM估计本地种爱尔兰野兔(Lepus timidus hibernicus)和入侵种欧洲野兔(L. europaeus)的密度时, 采用随机取样布局, 在研究区每平方公里内生成20个随机点。但以下情况不建议选用: (1)调查地区很大, 这时随机取样可能耗时、费力、不可实践; (2)如果研究目标是分析驱动动物种群密度的协变量时, 相机随机放置无法指定协变量的范围。系统网格取样的网格边长应大于目标物种的活动半径, 以此保证数据的独立性, 如Amin等(2022)在应用CTDS估计森林中4种羚羊的种群密度时, 采用系统网格布局, 网格间距为2 km。分层随机取样是上述两种布局的混合, 该布局不仅可以达到密度估计的目的, 还可以检验动物密度在不同植被类型之间的差异。
图5
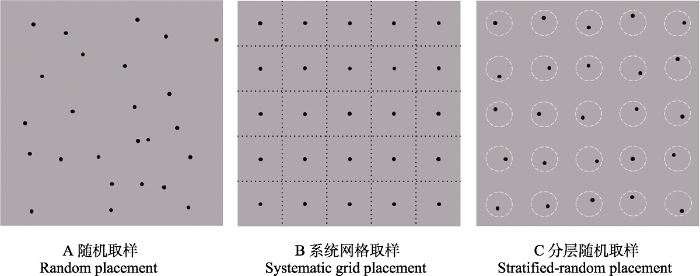
图5
随机取样、系统网格取样与分层随机取样示意图
Fig. 5
Schematic diagram of random placement, systematic grid placement and stratified-random placement
2.1.3 相机设置
(1)相机选择。通过对比不同红外相机的参数设置, 选择能够满足模型要求的红外相机。目前, 市面上红外相机的品牌和型号很多, 国外有些网站提供和评估了许多不同型号红外相机的数据(如
(2)相机设置。红外相机一般安装在木桩或树干上, 离地面0.4-0.8 m, 可根据研究对象的体型大小调整拍摄位置和角度并准确设置相机时间。相机水平布设时, 需调整相机角度使视图与地面平行, 且一般要求至少能拍到目标物种的肩高或稍低一些(Apps & McNutt, 2018)。建议将相机朝向北方或南方, 避免因强光直射导致大量的空拍图像(Hongo et al, 2021)。相机具体的设置方式及拍照模式需要根据具体使用的模型而定。例如, Rowcliffe等(2008)在测试REM时设置相机为拍照模式, 照片之间的延迟设置为2 min (为了平衡连续采样与动物连续触发引起的电池电量不足); Hongo等(2021)应用REST模型时使用视频模式记录动物在探测区域停留的时间, 并建议视频长度应涵盖动物单次停留时间(大多数物种为20-30 s)并且视频间隔必须最小; TIFC模型使用相机的拍照模式, 且要求动物触发后连续拍摄照片(Becker et al, 2022), 我们认为TIFC模型也可以使用相机的视频模式, 即当连续照片的间隔时间足够小时, 即可看作视频; CTDS可以使用拍照模式或视频模式, Howe等(2017)设置动物触发后拍摄照片(时间间隔t = 2 s), 并且认为也可以使用视频模式(从视频中截取动物从出现到离开每隔2 s的动物图像做数据处理)。
(3)相机维护。调查期间注意红外相机的定期维护及SD卡和电池的更换工作, 防止相机因意外停止工作。若红外相机有延时功能, 可以设置每天固定时间拍摄一段视频或一张照片, 以方便快速检测相机何时停止工作。另外, 对相机前周围环境的改造应尽可能少, 因为清理区域过大时, 可能会阻止警惕的动物进入该区域, 或改变它们在区域内的移动速度(Caravaggi et al, 2020), 但需要清理相机正前方的杂草或灌木, 以减少因杂草触发导致的相机空拍。
2.2 数据处理与分析
2.2.1 数据处理
(2)距离测量。REM、TIFC、CTDS这3种模型需要测量相机的有效探测距离, 可以通过设置距离梯度测试得出。有效探测距离因红外相机型号、物种类型、生境类型而异。距离的测量可根据实际情况灵活选择, 测量方法主要有: (1)实地测量, 适合相机点较少的调查, 如将动物图像打印, 按所在位置实地测量距相机的距离(Harris et al, 2020); (2)标志测量, 如在相机前按距离梯度放置标志杆或自然标记物(Palencia et al, 2021); (3)图像测量, 适合调查环境变化不太大的区域, 如在Photoshop软件中用生成的距离网格图层叠加到目标图像中进行测距(Jayasekara et al, 2021)或基于校正的深度图(calibrated depth image)进行测距(Haucke et al, 2022)。无论是使用标志测量还是图像处理测量, 都需注意固定红外相机的高度和角度, 避免相机角度变化过大, 影响测量精度。近期Johanns等(2022)在Haucke等(2022)半自动测距的基础上发展了动物到相机距离的自动测距法, 能极大地减轻研究者野外测距的工作量。
(3)停留时间。REST和TIFC模型需要计算动物在相机前停留的时间, 计算时要求动物的行为不受相机影响, 也就是动物不能因镜头吸引而增加在镜头前停留的时间。若为第一次调查某一区域, 动物可能会因好奇观察红外相机而增加停留时间, 这时可以适当舍去最初几个月的数据, 以减少因相机架设影响动物行为而产生的误差。
相机工作模式主要包括拍照、录像以及拍照 + 录像。REST要求相机为录像模式, 在计算停留时间时, 通过记录动物指定身体部位(如身体中点或前脚)进入和离开焦点区域的时间来计算动物停留时间; 如果使用相机的照片模式计算停留时间, 需要把拍照的时间间隔设置为最小, 通过连续照片中动物指定身体部位进入和离开焦点区域的时间计算动物停留时间。TIFC模型目前采用相机的拍照模式, 将动物记录为一系列带有时间标记的离散图像, 以此计算动物停留时间(Huggard, 2018)。将图像中没有动物出现和有动物出现的图像比作动物离开和返回相机视野的连续图像, 根据图像上的时间标记计算出每两张图像之间的时间间隔: 若时间间隔小于一定值, 可看作动物一直存在; 若时间间隔大于一定值, 则看作动物离开; 若时间间隔在这两个值之间, 此时判断动物是否离开需要抽样计算这两个时间之间动物离开视野的概率, 用间隔时间乘以动物存在的概率, 则可得到动物在该时间间隔存在的时间; 最后将以上所有动物存在的时间相加, 再加上动物在第一张图像之前和最后一张图像之后的时间(通过计算连续图像之间物种特定的平均秒数得到), 得到动物在该相机前的停留时间。例如: Becker等(2022)计算驼鹿(Alces alces)在镜头前的停留时间时, 将有驼鹿的照片之间的时间间隔划分为小于20 s、20-120 s和大于120 s。其中, 小于20 s认为驼鹿一直存在; 20-120 s认为驼鹿可能存在也可能不存在, 在此期间驼鹿存在的时间计算方式为间隔时间乘以(1 - 驼鹿离开的概率), 而驼鹿离开的概率通过抽样计算得到; 大于120 s认为驼鹿离开。那么, 驼鹿停留的时间则为所有小于20 s的间隔时间加上20-120 s中驼鹿存在的时间之和。如4张照片的时间间隔分别为5 s、10 s、30 s, 且通过抽样计算得到驼鹿在30 s离开的概率为40%, 那么驼鹿停留时间为5 + 10 + (30 × (1 - 0.4)) = 33 s。
2.2.2 数据分析
(1)随机相遇模型。Caravaggi (2017)开发的R语言包remBoot极大地简化了REM分析过程。remBoot程序包的计算原理为首先计算各独立事件中目标物种距相机径向距离和探测角度的平均值, 再结合给定的监测时长和目标物种的日活动距离等参数, 利用REM计算物种密度(公式1)。该程序包要求原始数据分为4列, 分别表示监测相机位点(site)、目标物种独立事件数(count, 默认为1)、目标物种距相机径向距离(图3A中的R)和探测角度(图3A中的θ), 而每一行代表目标物种监测的1次独立事件。此外, 还需要给出各监测位点相机的工作时长(h)和目标物种的日活动距离(m)。使用remBoot程序包的rem命令进行密度估计, 单位为只/m2, 可以转化为只/km2。使用remBoot命令还可以通过自举法迭代计算预测密度值的标准差和置信区间。该程序包可以通过remotes程序包获得, 详细操作方法可参考
(2)随机相遇与停留时间模型。REST模型需要使用基于贝叶斯理论的马尔可夫-蒙特卡罗法(the Markov chain Monte Carlo method, MCMC)进行数据分析(Nakashima et al, 2018)。该模型的似然函数为:
其中Yi表示相机位点i在监测期间拍摄到的独立事件数, Tij表示相机位点i在第j次探测时目标物种的停留时间。ε为一个向量, 用来定义观测到独立事件数Yi的概率分布。φ为一个向量, 用来定义停留时间Tij的概率分布。φ会受到相应环境协变量的影响, 因此在估计种群密度前需要使用相应的概率分布和环境协变量对停留时间进行拟合与解释。可用的分布有指数分布、伽马分布、对数正态分布和韦伯分布(Nakashima et al, 2020)。同时, ε可以通过以下公式进行确定:
其中, s表示相机镜头前探测区域(图3B的阴影部分), Hi为i点相机的工作时间, Di表示相机位点i的种群密度。而密度Di可以表示为:
其中, β0为截距, xik为相机位点i的第k类环境协变量, βk为协变量k的斜率值。使用MCMC法可以确定参数φ和ε的后验分布, 继而求出βk。最终使用密度公式并结合各监测点的环境协变量值计算种群密度。因为动物在静息时不能够被相机监测到, 因此需要使用目标物种的日时间尺度活跃度水平(activity level)对相机工作时间进行矫正, 即相机有效监测时间为相机的工作时间乘以活跃度水平。活跃度水平可以使用R语言的activity包计算(Rowcliffe et al, 2014)。有关随机相遇和停留时间模型的详细分析步骤可参考
(3)相机前停留时间模型。TIFC是新开发的模型, 目前还未有专门针对该模型的R程序包, 因此在评估种群密度(D)之前需要在R语言中分别求出探测到的动物平均数量(N)、探测区域面积(S)、相机工作时间(H)、动物在探测区域平均停留时间(T)。因为探测区域面积和动物在探测区域平均停留时间分别受到相机有效探测距离(EDD)和连续两次探测之间动物离开概率(leave probability)的影响, 因此准确估计有效探测半径和连续两次探测之间动物离开的概率是对动物种群密度进行有效评价的重要前提(Becker et al, 2022)。
使用TIFC模型进行密度估计时需要给定相机视野角度、相机位点编号、起止时间和目标物种照片的拍摄位置和拍摄时间等基础信息(Warbington & Boyce, 2020)。在模拟连续两次探测之间动物离开的概率时, 需要根据目标物种的行为把每个记录分为“动物一直存在” “动物离开” “不确定” “不存在” 4类, 并求出相同相机位点的同一物种两个连续影像之间的时间间隔。例如, 当要确定时间间隔在20-120 s区间内连续两次探测中动物离开的概率时, 需要构建该时间间隔内各“动物离开”的属性记录与其对应的时间间隔的平滑关系, 并根据该平滑关系预测连续探测之间动物离开的概率(Brownlee et al, 2022)。根据相机监测工作的起止时间确定各监测点的相机工作时间, 对于因故障等原因没有完成监测周期的相机要根据实际情况计算该相机的实际工作时间。在计算目标物种的有效探测半径时, 需要综合考虑生境、时间等因素对有效探测半径的影响。假设相机视野内的标记距离为5 m (图3C), 则根据目标物种与标记物的距离将各监测影像分为“在标记物位置” (距相机5 m)、“在标记物以内” (距相机小于5 m)、“在标记物以外” (距相机大于5 m)、“观察相机” (被相机所吸引)、“观察标记物” (被标记物所吸引)等5类。为减少误差只保留“在标记物以内”和“在标记物以外” 2类监测影像。使用广义加性模型(generalized additive models)构建“在标记物以内”监测影像频率与各环境、时间协变量的非线性关系, 并在此基础上预测目标物种在各种生境、各种时间阶段中“在标记物以内” (距相机5 m)监测影像的发生概率(Becker et al, 2022)。最后使用有效探测半径公式EDD结合标记物到相机距离求出有效探测半径及置信区间。待各参数值确定后使用相机前停留时间模型密度公式(公式3)计算目标物种在各相机点的种群密度值。详细数据分析步骤可参见
数据分析时首先需要输入物种名、监测点编号、监测面积、监测时长、距离、探测动物的个体数(number)、监测起止时间等信息。此外也可以输入监测区域、植被类型等其他可能影响探测率的环境变量。监测时长可以通过各相机工作的起止时间计算得到。拟合探测率时首先利用探测距离分布图对监测数据进行左截短(left-truncation)和右截短(right-truncation)。左截短是指去掉动物距离相机特别近的记录, 因为动物极度靠近相机时可能造成距离测量不准以及物种识别错误等问题。右截短是指去掉动物个体距离相机特别远的记录, 因为动物远离相机时可能造成探测率降低, 导致较大的漏拍(Corlatti et al, 2020)。使用Distance程序包的ds命令对目标物种的探测率和种群密度进行拟合。CTDS对物种探测率拟合的实质为使用关键函数(key function)、调整项(adjustment)、拟合顺序(order)和拟合公式(formula) 4种参数对各监测点目标物种的探测率随着到相机距离增加而减少的趋势进行精准拟合(Howe et al, 2017)。Distance程序包中关键函数包括半正态分布(half-normal)、风险率分布(hazard-rate)和均匀分布(uniform) 3种类型。调整项包括cosine (cos)、hermite polynomial (herm)和simple polynomial (poly)等3种类型。对于3种形式的调整项, order的取值范围为不小于2的正整数, 但当函数为均匀分布时, order的取值范围为不小于1的正整数。距离取样法评估种群密度时无法考虑环境协变量的影响, 但在拟合探测率时却可以考虑环境等的影响, 可以在拟合公式部分添加环境协变量以增加探测概率的拟合精度。
CTDS的最优模型筛选分为两步。首先根据QAIC值(模型筛选标准)分别选出正态分布、风险率分布和均匀分布3种关键函数类型下的最优子模型, 再使用QAIC值和离散因子值(chat)在3个最优子模型中选出最优模型(Howe et al, 2019)。使用χ2检验确定该最优模型是否对探测率分布进行了准确的拟合。最后根据最优模型结果得到目标物种的种群密度估计。因为红外相机一般只能监测到地栖物种的活动, 而不能全面监测具有树栖和穴居属性物种的活动, 因此需要使用各物种的地表活跃度水平值对密度估计值进行矫正, 活跃度水平可以使用R语言的activity包计算(Rowcliffe et al, 2014)。CTDS的具体操作可参考
3 总结和展望
密度是种群的重要特征, 是生态学研究和野生动物保护和管理的重要参数。本文介绍了4种基于红外相机数据估算不具有个体识别特征动物种群密度的模型, 旨在为国内相关研究提供方法参考。目前虽发展了多种估算动物种群密度的方法, 但不同学者对各种方法的评价褒贬不一, 因为研究者一般不具备验证密度估计准确性的条件, 很多学者将密度估计结果与研究区域动物种群的本底数据或历史数据(如种群普查数据等)进行对比, 或通过多种方法比较, 判断模型的效能。如, Palencia等(2021)比较了REM、REST和CTDS 3种模型估计种群密度的性能, 在对西班牙2个研究区域马鹿(Cervus elaphus)、野猪和赤狐(Vulpes vulpes) 3个物种的6个群体进行密度估计时显示, REM对6个群体的独立密度估计没有显著差异, REST和CTDS只在1个群体的独立密度估计中有显著差异, 而3种模型间的精度差异不显著, 并且推荐在动物多度较高情况下使用REST模型, 多度较低的情况下使用CTDS。Jayasekara等(2021)比较了REM和CTDS, 发现在估算热带森林中食肉动物密度时2种模型产生了相似的估算结果。然而, 当无法估算研究区域动物种群的绝对密度时, 也可将研究结果当作相对密度(Huggard, 2018), 通过相对密度的比较, 可了解不同年际间动物密度的变化及种群动态变化, 为野生动物保护及保护区管理提供科学依据。
总的来说, 本文介绍的4种模型主要有以下优势: (1)基于红外相机技术。红外相机在野生动物监测方面优势凸显, 与传统采样技术相比, 红外相机是一种非损伤性采样技术, 对动物的影响较小。红外相机长时间在野外工作, 可以监测到难以捕捉和夜间活动的物种。另外, 海量红外相机图像为动物种群研究提供了数据支持。(2)不需要估算动物家域范围。与标记-重捕法的相关模型相比, 基于遇见率的模型不需要考虑相机位点及动物活动的空间自相关关系, 故估算的不再是动物活动中心所在空间内的种群密度, 而是相机视野范围的动物种群密度。(3)不需要个体识别。野生动物大多身体特征不明显且种群数量多, 尤其是有蹄类动物, 对其个体识别难度高、工作量大, 若能不进行个体识别而估计种群密度, 则可以大大减少工作量, 释放人力物力。虽然在进行动物种群密度估计时, 不需要估算动物家域范围和不需要个体识别的方法模型足以让研究者青睐, 但在以上模型的使用过程中仍需要注意以下几个问题。
(1)模型假设。4种模型都需要满足一定的假设条件, 而在实践中完全避免违反假设是不可能的。所以, 对于违反假设所带来的偏差, 大部分学者会通过比较不同程度违反假设时所产生的密度估计值来测试偏差, 或在研究过程中采用适当的方法减轻对假设的违反。有研究者测试了多个变量对密度估计的影响, 认为增加相机数量和监测时间可能会降低密度估计的偏差(Luo et al, 2020)。而当自然环境中无法确定一个种群是否封闭时, 可以选择一个相对较短且避开动物主要繁殖和迁徙季节的时间进行调查, 以满足种群封闭假设(Palencia et al, 2021)。另外, 为了克服动物避开相机或被相机吸引而导致对种群密度的低估或高估, 可采用放弃调查初期的数据(Howe et al, 2017)或排除动物对相机有明显反应的探测数据来减小偏差(Bessone et al, 2020; Cappelle et al, 2021)。Houa等(2022)采用CTDS估计大空间尺度的多个物种密度时, 将动物所有视频片段估计的密度值与排除动物对相机有明显行为反应的视频后估计的密度值进行对比, 以此评估行为反应对CTDS密度估计的影响。Becker等(2022)测试TIFC模型的假设时认为, 如果不能满足这些假设, 那么对密度的估计就会有偏差; 然而, 即使违反了这些假设中的一个或多个, 只要偏差在一个量级, 或是可测量以及可纠正的, 所得到的估计仍然可以作为生态应用中的相对密度进行比较。
(2)目标物种与相机探测率。4种模型已被应用于多种哺乳动物的密度估计, 且多以估算单个物种为主, 或者估算多个体型大小或行为特征相近的物种。也有研究者使用1种模型估算多个物种的密度, 如, Mason等(2022)应用CTDS估算了4种生境下8种哺乳动物的密度, 然而即便使用相同型号以及相同架设高度和角度的相机, 不同体型大小动物的探测率也会有所不同。红外相机传感器监测动物的能力与动物体型大小、行为和生境状况等有关。一般来说, 对大中型动物的探测灵敏度较高, 对小型动物的探测灵敏度较低。另外, 红外相机的理论拍摄半径和角度与实际拍摄半径和角度可能也有差异, 如红外相机传感器对相机视野边缘的动物不太敏感(即有效角度小于理论角度), 需要通过现场测试来估计红外相机的有效拍摄半径和角度。对目标物种的不准确探测会导致估计偏差, 所以在选择目标物种时要了解物种的生活史特性, 如避免选择树栖物种, 保证所选择的目标物种的所有行为活动尽量在红外相机的拍摄范围之内, 对于一些夜行性动物, 利用动物活动时间比例来修正密度估计的偏差。
(3)动物行为。应用红外相机对动物密度的估计还需要考虑动物行为的变化(Henrich et al, 2022), 动物行为是决定动物个体与相机相遇概率的一个重要因素(Hofmeester et al, 2019)。动物的休息、觅食、运动等行为可能与栖息地条件有关(Mysterud & Ims, 1998), 动物对栖息地特征的选择会影响动物个体在整个景观中的异质性分布以及动物与相机的相遇率。动物繁殖、风险规避和动物个性等内部因素(Nathan et al, 2008)以及种群性别比例的变化、气候特征的季节性等外部因素可能会影响平均移动速度, 从而影响相机捕获率; 一般来说平均移动速度快的动物更可能与相机相遇(Gurarie & Ovaskainen, 2013; Broadley et al, 2019)。Henrich等(2022)在研究鹿科动物的行为对密度估计的影响时发现, 鹿移动速度的季节性变化以及鹿对相机行为反应的季节性变化等都会对密度估计产生影响。也有学者量化了动物对相机的不同反应所产生的偏差, 并测试嗅觉、视觉和听觉信号是否会使动物对相机产生不同反应而影响探测率, 结果表明红外相机周围的嗅觉信号(设备上的金属气味或人的气味, 人为添加诱味剂等)、视觉信号(对外来物体和夜间红外LED照明的恐惧)等外部因素也会影响动物对相机的行为(Meek et al, 2014; Caravaggi et al, 2020; Houa et al, 2022)。
(4)群体大小。目前研究的目标物种多以独居动物为例, 许多密度估算的方法或模型能否很好地应用到群居动物一直是个富有挑战的问题。即便是标记-重捕法也假设动物是独立探测的, 活动中心是分配给单个个体的。以上4种模型也初探了对群居动物的适用效能, 如Nakashima等(2018)表明应用REST模型估算成对出现的动物种群密度时也可以得到无偏密度估计; Fisher等(2021)将TIFC模型对群居动物的测试结果与空间计数(SC)模型比较, 表明TIFC模型对群居动物的估计优于SC模型。但Pal等(2021)认为CTDS对群居动物的估测结果不如独居动物, 因为当群居动物一起出现在镜头前时, 离镜头近的动物可能会挡住镜头远处的动物, 导致无法判断所有动物的距离而影响估计精度。目前来说, 大部分种群密度估计方法对独居动物密度的估计整体要比对群居动物效果好, 希望未来估计密度时能进一步完善和改进对群居动物密度估计的方法或模型。
综上, 红外相机技术是一种非损伤性采样技术, 有望成为野外调查中估计动物种群密度的主要采样方式; 对于大多身体特征不明显的野生动物, 不进行个体识别估算动物种群密度的方法将成为一个发展趋势。在未来进行密度估计时, 建议研究者多尝试各种密度估计的方法模型, 或尝试一种模型估计多个物种, 以提高模型的适用性; 还可以尝试采用一套方案使相机数据能够满足多种模型的分析需求, 以此对比多个模型的估计效能。动物行为、种群大小是模型潜在的矫正因素, 未来可以根据动物不同的行为模式对模型进行矫正, 以及在准确估计密度的情况下在模型中添加协变量, 使协变量外推成为可能, 为种群预测提供数据支持。另外, 未来还应加强对相应R程序包的开发, 提高红外相机估算动物种群密度的效能。
致谢
衷心感谢三位匿名审稿专家及编委对本文提出的宝贵意见和建议。
参考文献
A granular view of a snow leopard population using camera traps in Central China
DOI:10.1016/j.biocon.2016.02.023 URL [本文引用: 2]
Evaluation of camera trap-based abundance estimators for unmarked populations
Estimating forest antelope population densities using distance sampling with camera traps
DOI:10.1017/S0030605320001209
URL
[本文引用: 2]

Traditional transect survey methods for forest antelopes often underestimate density for common species and do not provide sufficient data for rarer species. The use of camera trapping as a survey tool for medium and large terrestrial mammals has become increasingly common, especially in forest habitats. Here, we applied the distance sampling method to images generated from camera-trap surveys in Dja Faunal Reserve, Cameroon, and used an estimate of the proportion of time animals are active to correct for negative bias in the density estimates from the 24-hour camera-trap survey datasets. We also used multiple covariate distance sampling with body weight as a covariate to estimate detection probabilities and densities of rarer species. These methods provide an effective tool for monitoring the status of individual species or a community of forest antelope species, information urgently needed for conservation planning and action.
Are camera traps fit for purpose? A rigorous, reproducible and realistic test of camera trap performance
DOI:10.1111/aje.12573 URL [本文引用: 2]
Applying and testing a novel method to estimate animal density from motion-triggered cameras
Drawn out of the shadows: Surveying secretive forest species with camera trap distance sampling
DOI:10.1111/jpe.v57.5 URL [本文引用: 1]
Density- dependent space use affects interpretation of camera trap detection rates
DOI:10.1002/ece3.5840
[本文引用: 1]
Camera traps (CTs) are an increasingly popular tool for wildlife survey and monitoring. Estimating relative abundance in unmarked species is often done using detection rate as an index of relative abundance, which assumes that detection rate has a positive linear relationship with true abundance. This assumption may be violated if movement behavior varies with density, but the degree to which movement behavior is density-dependent across taxa is unclear. The potential confounding of population-level relative abundance indices by movement would depend on how regularly, and by what magnitude, movement rate and home-range size vary with density. We conducted a systematic review and meta-analysis to quantify relationships between movement rate, home-range size, and density, across terrestrial mammalian taxa. We then simulated animal movements and CT sampling to test the effect of contrasting movement scenarios on CT detection rate indices. Overall, movement rate and home-range size were negatively correlated with density and positively correlated with one another. The strength of the relationships varied significantly between taxa and populations. In simulations, detection rates were related to true abundance but underestimated change, particularly for slower moving species with small home ranges. In situations where animal space use changes markedly with density, we estimate that up to thirty percent of a true change in relative abundance may be missed due to the confounding effect of movement, making trend estimation more difficult. The common assumption that movement remains constant across densities is therefore violated across a wide range of mammal species. When studying unmarked species using CT detection rates, researchers and managers should explicitly consider that such indices of relative abundance reflect both density and movement. Practitioners interpreting changes in camera detection rates should be aware that observed differences may be biased low relative to true changes in abundance. Further information on animal movement, or methods that do not depend on assumptions of density-independent movement, may be required to make robust inferences on population trends.
Monitoring sitatunga (Tragelaphus spekii) populations using camera traps
DOI:10.1111/aje.v60.3 URL [本文引用: 1]
Designing distance sampling experiments
In: Distance Sampling: Methods and Applications (eds Buckland ST, Rexstad EA, Marques TA, Oedekoven CS), pp. 29-34. Springer, New York.
Wildlife camera trapping: A review and recommendations for linking surveys to ecological processes
DOI:10.1111/1365-2664.12432 URL [本文引用: 1]
Validating camera trap distance sampling for chimpanzees
Estimating animal abundance and effort-precision relationship with camera trap distance sampling
remBoot: An R package for random encounter modelling
DOI:10.21105/joss URL [本文引用: 1]
A review of factors to consider when using camera traps to study animal behavior to inform wildlife ecology and conservation
An invasive-native mammalian species replacement process captured by camera trap survey random encounter models
DOI:10.1002/rse2.11 URL [本文引用: 1]
The use of photographic rates to estimate densities of tigers and other cryptic mammals
DOI:10.1017/S1367943001001081 URL [本文引用: 1]
Spatially explicit models for inference about density in unmarked or partially marked populations
The Annals of Applied Statistics,
Limitations of relative abundance indices calculated from camera-trapping data
DOI:10.17520/biods.2018327
[本文引用: 1]
Abundance is an important parameter used to estimate the population size of various wildlife species. With the growing application of camera-traps (movement or heat activated) to monitoring wildlife, the relative abundance index (RAI) has become one of the most popular indicators of population abundance for inventories and assessment. Despite a simple and convenient indicator of population size, RAI obtained from camera-trapping data can be greatly affected by many factors such as species traits, detection rates and environmental factors. Therefore, we need verify the correlation between RAI and population density prior to its general application. So far, several types of RAIs have been developed based on camera-trapping data, and it is critical to compare these RAI indices and their applications. In this paper, we summarized the methods calculating RAI with camera-trapping data and reviewed their applications in wildlife monitoring and inventories in China. Four main types of RAIs were identified including (1) the number of days when one animal is photographed, (2) the number of photographs of focal species per 100 trap days, (3) the number of photographs of focal species per trap day, and (4) the proportion of photos from the focal species compared to all photos of all animals. Among them, the second RAI type is the most widely used (72.5%) in wildlife monitoring and inventories in China, and the fourth RAI type is used to compare species components in communities. Consequently, we recommend the second RAI type for estimating population abundance in particular when camera-trapping data are used for broad-scale comparisons over different spatial and temporal scales.
物种相对多度指数在红外相机数据分析中的应用及局限
DOI:10.17520/biods.2018327
[本文引用: 1]
多度是衡量物种种群数量的参数之一, 多度的动态及其影响因素是种群生态学研究的经典问题。物种相对多度指数(relative abundance index, RAI)作为一种简单、便利的指标, 广泛应用于动物本底清查中。但RAI易受物种自身特征、探测率和环境因素的影响, 需要结合其他物种数量分析方法, 以验证其与种群大小的相关性。随着红外相机技术在野生动物调查中的广泛应用, 用红外相机数据估计动物种群数量的研究越来越多。目前, 基于红外相机数据计算RAI的方法有多种, 不同计算方法和应用范围存在差异, 亟需对现有方法和应用进行梳理。本文综述了根据红外相机数据计算物种相对多度的4种主要方法: (1)拍摄一张有效照片所需要的天数; (2)基于单位调查强度的物种拍摄率; (3)每个位点每天的物种拍摄率; (4)某一物种的照片数占所有物种的比例。总结了我国野生动物监测调查中采用红外相机方法计算RAI的应用现状。国内的研究主要采用第2种和第4种计算方法, 其中约72.5%的研究论文应用第2种计算方法, 而第4种方法一般适用于群落中的物种组成比较。我们建议根据红外相机数据计算RAI时尽量使用第2种计算方法, 这有助于研究或管理人员对不同研究中的物种RAI进行比较分析。
A field test of unconventional camera trap distance sampling to estimate abundance of marmot populations
Applying a random encounter model to estimate lion density from camera traps in Serengeti National Park, Tanzania
The random encounter model (REM) is a novel method for estimating animal density from camera trap data without the need for individual recognition. It has never been used to estimate the density of large carnivore species, despite these being the focus of most camera trap studies worldwide. In this context, we applied the REM to estimate the density of female lions () from camera traps implemented in Serengeti National Park, Tanzania, comparing estimates to reference values derived from pride census data. More specifically, we attempted to account for bias resulting from non-random camera placement at lion resting sites under isolated trees by comparing estimates derived from night versus day photographs, between dry and wet seasons, and between habitats that differ in their amount of tree cover. Overall, we recorded 169 and 163 independent photographic events of female lions from 7,608 and 12,137 camera trap days carried out in the dry season of 2010 and the wet season of 2011, respectively. Although all REM models considered over-estimated female lion density, models that considered only night-time events resulted in estimates that were much less biased relative to those based on all photographic events. We conclude that restricting REM estimation to periods and habitats in which animal movement is more likely to be random with respect to cameras can help reduce bias in estimates of density for female Serengeti lions. We highlight that accurate REM estimates will nonetheless be dependent on reliable measures of average speed of animal movement and camera detection zone dimensions. © 2015 The Authors. published by Wiley Periodicals, Inc. on behalf of The Wildlife Society.
Estimating abundance of unmarked animal populations: Accounting for imperfect detection and other sources of zero inflation
DOI:10.1111/mee3.2015.6.issue-5 URL [本文引用: 2]
Density estimates of unmarked large mammals at camera traps vary among models, species, and years, signalling importance of model assumptions
Abundance estimation of unmarked animals based on camera-trap data
DOI:10.1111/cobi.v35.1 URL [本文引用: 2]
Optimising camera traps for monitoring small mammals
Design patterns for wildlife-related camera trap image analysis
DOI:10.1002/ece3.5767
[本文引用: 1]
This paper describes and explains design patterns for software that supports how analysts can efficiently inspect and classify camera trap images for wildlife-related ecological attributes. Broadly speaking, a design pattern identifies a commonly occurring problem and a general reusable design approach to solve that problem. A developer can then use that design approach to create a specific software solution appropriate to the particular situation under consideration. In particular, design patterns for camera trap image analysis by wildlife biologists address solutions to commonly occurring problems they face while inspecting a large number of images and entering ecological data describing image attributes. We developed design patterns for image classification based on our understanding of biologists' needs that we acquired over 8 years during development and application of the freely available Timelapse image analysis system. For each design pattern presented, we describe the problem, a design approach that solves that problem, and a concrete example of how Timelapse addresses the design pattern. Our design patterns offer both general and specific solutions related to: maintaining data consistency, efficiencies in image inspection, methods for navigating between images, efficiencies in data entry including highly repetitious data entry, and sorting and filtering image into sequences, episodes, and subsets. These design patterns can inform the design of other camera trap systems and can help biologists assess how competing software products address their project-specific needs along with determining an efficient workflow.
Absent or undetected? Effects of non-detection of species occurrence on wildlife-habitat models
DOI:10.1016/S0006-3207(03)00190-3 URL [本文引用: 1]
Towards a general formalization of encounter rates in ecology
DOI:10.1007/s12080-012-0170-4 URL [本文引用: 1]
Accurate population estimation of Caprinae using camera traps and distance sampling
DOI:10.1038/s41598-020-73893-5
PMID:33082374
[本文引用: 1]
With most of the world's Caprinae taxa threatened with extinction, the IUCN appeals to the development of simple and affordable sampling methods that will produce credible abundance and distribution data for helping conserve these species inhabiting remote areas. Traditional sampling approaches, like aerial sampling or mark-capture-recapture, can generate bias by failing to meet sampling assumptions, or by incurring too much cost and logistical burden for most projects to address them. Therefore, we met the IUCN's challenge by testing a sampling technique that leverages imagery from camera traps with conventional distance sampling, validating its operability in mountainous topography by comparing results to known abundances. Our project occurred within a captive facility housing a wild population of desert bighorn sheep (Ovis canadensis) in the Chihuahuan desert of New Mexico, which is censused yearly. True abundance was always within our 90% confidence bounds, and the mean abundance estimates were within 4.9 individuals (average) of the census values. By demonstrating the veracity of this straightforward and inexpensive sampling method, we provide confidence in its operability, urging its use to fill conservation voids for Caprinae and other data-deficient species inhabiting rugged or heavily vegetated terrain.
Overcoming the distance estimation bottleneck in estimating animal abundance with camera traps
DOI:10.1016/j.ecoinf.2021.101536 URL [本文引用: 2]
Deer behavior affects density estimates with camera traps, but is outweighed by spatial variability
DOI:10.3389/fevo.2022.881502
URL
[本文引用: 2]
Density is a key trait of populations and an essential parameter in ecological research, wildlife conservation and management. Several models have been developed to estimate population density based on camera trapping data, including the random encounter model (REM) and camera trap distance sampling (CTDS). Both models need to account for variation in animal behavior that depends, for example, on the species and sex of the animals along with temporally varying environmental factors. We examined whether the density estimates of REM and CTDS can be improved for Europe’s most numerous deer species, by adjusting the behavior-related model parameters per species and accounting for differences in movement speeds between sexes, seasons, and years. Our results showed that bias through inadequate consideration of animal behavior was exceeded by the uncertainty of the density estimates, which was mainly influenced by variation in the number of independent observations between camera trap locations. The neglection of seasonal and annual differences in movement speed estimates for REM overestimated densities of red deer in autumn and spring by ca. 14%. This GPS telemetry-derived parameter was found to be most problematic for roe deer females in summer and spring when movement behavior was characterized by small-scale displacements relative to the intervals of the GPS fixes. In CTDS, density estimates of red deer improved foremost through the consideration of behavioral reactions to the camera traps (avoiding bias of max. 19%), while species-specific delays between photos had a larger effect for roe deer. In general, the applicability of both REM and CTDS would profit profoundly from improvements in their precision along with the reduction in bias achieved by exploiting the available information on animal behavior in the camera trap data.
Framing pictures: A conceptual framework to identify and correct for biases in detection probability of camera traps enabling multi-species comparison
DOI:10.1002/ece3.4878
[本文引用: 1]
Obtaining reliable species observations is of great importance in animal ecology and wildlife conservation. An increasing number of studies use camera traps (CTs) to study wildlife communities, and an increasing effort is made to make better use and reuse of the large amounts of data that are produced. It is in these circumstances that it becomes paramount to correct for the species- and study-specific variation in imperfect detection within CTs. We reviewed the literature and used our own experience to compile a list of factors that affect CT detection of animals. We did this within a conceptual framework of six distinct scales separating out the influences of (a) animal characteristics, (b) CT specifications, (c) CT set-up protocols, and (d) environmental variables. We identified 40 factors that can potentially influence the detection of animals by CTs at these six scales. Many of these factors were related to only a few overarching parameters. Most of the animal characteristics scale with body mass and diet type, and most environmental characteristics differ with season or latitude such that remote sensing products like NDVI could be used as a proxy index to capture this variation. Factors that influence detection at the microsite and camera scales are probably the most important in determining CT detection of animals. The type of study and specific research question will determine which factors should be corrected. Corrections can be done by directly adjusting the CT metric of interest or by using covariates in a statistical framework. Our conceptual framework can be used to design better CT studies and help when analyzing CT data. Furthermore, it provides an overview of which factors should be reported in CT studies to make them repeatable, comparable, and their data reusable. This should greatly improve the possibilities for global scale analyses of (reused) CT data.
A practical guide for estimating animal density using camera traps: Focus on the REST model
Animal reactivity to camera traps and its effects on abundance estimate using distance sampling in the Taï National Park, Côte d'Ivoire
Distance sampling with camera traps
DOI:10.1111/mee3.2017.8.issue-11 URL [本文引用: 8]
Model selection with overdispersed distance sampling data
DOI:10.1111/2041-210X.13082
[本文引用: 2]
Distance sampling (DS) is a widely used framework for estimating animal abundance. DS models assume that observations of distances to animals are independent. Non-independent observations introduce overdispersion, causing model selection criteria such as AIC or AIC(c) to favour overly complex models, with adverse effects on accuracy and precision. We describe, and evaluate via simulation and with real data, estimators of an overdispersion factor (c), and associated adjusted model selection criteria (QAIC) for use with overdispersed DS data. In other contexts, a single value of c<^> is calculated from the "global" model, that is the most highly parameterised model in the candidate set, and used to calculate QAIC for all models in the set; the resulting QAIC values, and associated Delta QAIC values and QAIC weights, are comparable across the entire set. Candidate models of the DS detection function include models with different general forms (e.g. half-normal, hazard rate, uniform), so it may not be possible to identify a single global model. We therefore propose a two-step model selection procedure by which QAIC is used to select among models with the same general form, and then a goodness-of-fit statistic is used to select among models with different forms. A drawback of this approach is that QAIC values are not comparable across all models in the candidate set. Relative to AIC, QAIC and the two-step model selection procedure avoided overfitting and improved the accuracy and precision of densities estimated from simulated data. When applied to six real datasets, adjusted criteria and procedures selected either the same model as AIC or a model that yielded a more accurate density estimate in five cases, and a model that yielded a less accurate estimate in one case. Many DS surveys yield overdispersed data, including cue counting surveys of songbirds and cetaceans, surveys of social species including primates, and camera-trapping surveys. Methods that adjust for overdispersion during the model selection stage of DS analyses therefore address a conspicuous gap in the DS analytical framework as applied to species of conservation concern.
Overview of recent land-cover changes in biodiversity hotspots
DOI:10.1002/fee.v19.2 URL [本文引用: 1]
Animal density from camera data. Alberta Biodiversty Monitoring Institute
Use, misuse and extensions of “ideal gas” models of animal encounter
DOI:10.1111/j.1469-185X.2007.00014.x
PMID:17624958
[本文引用: 1]
Biologists have repeatedly rediscovered classical models from physics predicting collision rates in an ideal gas. These models, and their two-dimensional analogues, have been used to predict rates and durations of encounters among animals or social groups that move randomly and independently, given population density, velocity, and distance at which an encounter occurs. They have helped to separate cases of mixed-species association based on behavioural attraction from those that simply reflect high population densities, and to detect cases of attraction or avoidance among conspecifics. They have been used to estimate the impact of population density, speeds of movement and size on rates of encounter between members of the opposite sex, between gametes, between predators and prey, and between observers and the individuals that they are counting. One limitation of published models has been that they predict rates of encounter, but give no means of determining whether observations differ significantly from predictions. Another uncertainty is the robustness of the predictions when animal movements deviate from the model's assumptions in specific, biologically relevant ways. Here, we review applications of the ideal gas model, derive extensions of the model to cover some more realistic movement patterns, correct several errors that have arisen in the literature, and show how to generate confidence limits for expected rates of encounter among independently moving individuals. We illustrate these results using data from mangabey monkeys originally used along with the ideal gas model to argue that groups avoid each other. Although agent-based simulations provide a more flexible alternative approach, the ideal gas model remains both a valuable null model and a useful, less onerous, approximation to biological reality.
A review of wildlife abundance estimation models: Comparison of models for correct application
DOI:10.3106/ms2019-0082 URL [本文引用: 1]
Population density estimation of meso-mammal carnivores using camera traps without the individual recognition in Maduru Oya National Park, Sri Lanka
Automated distance estimation for wildlife camera trapping
DOI:10.1016/j.ecoinf.2022.101734 URL [本文引用: 1]
Statistical development of animal density estimation using random encounter modelling
DOI:10.1007/s13253-020-00385-4 [本文引用: 2]
Population density estimates of forest duikers (Philantomba monticola & Cephalophus spp.) differ greatly between survey methods
DOI:10.1111/aje.12518 URL [本文引用: 1]
Applied Hierarchical Modeling in Ecology: Analysis of Distribution, Abundance and Species Richness in R and BUGS (Vol. 1): Prelude and Static Models
Camera-trapping in wildlife research and conservation in China: Review and outlook
DOI:10.3724/SP.J.1003.2014.14203
[本文引用: 1]
During the last two decades, infrared-triggered camera-trapping has been widely used in wildlife and biodiversity research and conservation. In the areas of wildlife ecology research, animal species inventory, biodiversity monitoring and protected area management in China, considerable outputs have been produced by scientific research and conservation applications based on camera-trapping. This technique has been successfully used to detect rare or elusive species, conduct biodiversity inventory, study animal behavior, estimate population parameters, and evaluate the effectiveness of protected area management. Along with the rapid development of modern ecological analysis and modeling tools, camera-trapping will play a more important role in wildlife research at various levels. Meanwhile, along with improvements in techniques, decreasing cost and increasing application interests, camera-trapping will be adopted by more researchers, wildlife managers and protected areas, and can be used for systematic wildlife monitoring using standard protocols. Efforts devoted to its future development and applications should focus on establishing systematically-designed monitoring networks and data-sharing protocols, and developing new analytical approaches and statistical models specifically based on camera-trapping data.
红外相机技术在我国野生动物研究与保护中的应用与前景
DOI:10.3724/SP.J.1003.2014.14203
[本文引用: 1]
20年来, 红外相机技术在国内外野生动物研究、监测与保护中得到了广泛应用。基于红外相机技术, 我国在野生动物生态学研究、动物行为学研究、稀有物种的探测与记录、动物本底资源调查、生物多样性监测及保护地管理与保护评价等领域取得了众多成果。目前, 数学模型、统计分析方法和新的概念正在促进红外相机技术在野生动物监测研究与保护管理中的发展和推广应用。同时, 随着红外相机技术的成熟、成本降低和应用普及, 这一技术也将会被更多的野生动物研究人员、管理人员和自然保护区管理者所采用, 并成为全国各级保护地和区域生物多样性监测研究的关键技术和方法。今后, 建立并完善系统化的监测网络和数据共享平台、开发新一代的数据分析方法与模型, 将是此项技术进一步发展和应用的主要方向。
cameratrapR: An R package for estimating animal density using camera trapping data
DOI:10.1016/j.ecoinf.2022.101597 URL [本文引用: 1]
A review on estimating population size of large and medium-sized mammals
DOI:10.17520/biods.2021134
[本文引用: 2]
Context: Estimating the population size of large and medium-sized mammals is a fundamental issue in animal ecology, attracting great attention from researchers, managers, and the public. However, despite the fact that it has been explored from the mid-20th century to now, the population sizes of numerous species worldwide are unknown. In China, the research targeting large and medium-sized mammals have been explored since 1980s. Although it has made great progress, the population size of many species in China are still unknown. Aims: We aim to establish a framework to categorize existing estimation methods and further summarize the research development of population size estimation in China while highlighting strengths and trends under this framework. Results & Conclusions: First, we establish a concise hierarchical framework according to the estimation theory, data resources, and models used. This framework indicates that there are four classes of methods including distance sampling method, capture-recapture method, encounter-based method, and direct count method from remotely sensed imagery according to estimation theory. Then for each of the four methods, we illustrate the basic model and its assumptions, explaining how existing data resources (including insight, camera trap, DNA microsatellite, satellite tracking, acoustic monitor, and remote sensing data) realize each theory respectively. We summarize unique features, advantages, and disadvantages of each method and compare size or density estimation resulted from different methods. Secondly, we summarize the development of population size estimation methods in China in the context of this framework while highlighting trends and strengths. Numerous data obtained from infrared cameras in many study areas during the last decade can be used to estimate the population size by employing distance sampling, capture-recapture models, and encounter-based methods. Meanwhile, the pellet distance sampling method, fecal-DNA capture-recapture method and direct count method from remotely sensed imagery are suggested to be developed. Finally, a guide to select the estimation methods appropriate for their studies is provided as a reference for future researchers.
大中型兽类种群数量估算的研究进展
DOI:10.17520/biods.2021134
[本文引用: 2]
大中型兽类种群数量的估算是动物生态学中重要的基本问题, 受到研究者、管理者和公众的共同关注。国际上从20世纪中期开始研究该问题, 已出现了多种研究方法和相应案例, 且还在快速发展, 但世界各地仍有很多物种的种群数量尚未知晓。在我国, 从20世纪80年代开始调查大中型兽类种群数量, 取得了重要进展, 也还有很多物种的种群数量尚不清楚。因此, 有必要归纳国际上种群数量估算的研究进展, 同时, 总结国内研究的现状、优势和趋势, 供研究者参考。本文首先选择估算大中型兽类种群数量的原理、数据来源和模型这3个要素归纳出简明的研究框架, 将现有的多种方法置于其中予以阐述。在该框架下, 根据估算原理分为4大类方法, 为距离取样法、标志重捕法、基于遇见率法和遥感影像直接计数法。针对每一大类方法, 论述其基本原理模型和模型假设, 说明能实现该原理的相应数据来源(视觉观测、红外相机拍摄、DNA微卫星识别、卫星定位跟踪、声音监测或遥感影像)的特点及如何实现该原理, 评价其适用性及优缺点, 并选择其中具有可比性的方法予以比较评价。其次, 参照该研究框架, 总结我国的研究现状, 分析未来发展的优势和趋势: 我国的红外相机数据积累充分, 可以发展以此为数据源的距离取样法、标志重捕法和基于遇见率法; 发展以粪便样品为数据来源的距离取样法和粪便DNA标志重捕法; 相比地面调查数据, 获取高分辨率遥感影像数据更容易, 尽量以此估算符合适用条件的大中型兽类的种群数量。最后, 本文提出了适用于我国大中型兽类种群数量的估算方法的选择流程, 供研究者参考。
Investigation and analysis of ungulate population size in Dulan, Qinghai Province
青海都兰大型有蹄类种群数量调查与分析
A generalised random encounter model for estimating animal density with remote sensor data
Wildlife monitoring technology is advancing rapidly and the use of remote sensors such as camera traps and acoustic detectors is becoming common in both the terrestrial and marine environments. Current methods to estimate abundance or density require individual recognition of animals or knowing the distance of the animal from the sensor, which is often difficult. A method without these requirements, the random encounter model (REM), has been successfully applied to estimate animal densities from count data generated from camera traps. However, count data from acoustic detectors do not fit the assumptions of the REM due to the directionality of animal signals.We developed a generalised REM (gREM), to estimate absolute animal density from count data from both camera traps and acoustic detectors. We derived the gREM for different combinations of sensor detection widths and animal signal widths (a measure of directionality). We tested the accuracy and precision of this model using simulations of different combinations of sensor detection widths and animal signal widths, number of captures and models of animal movement.We find that the gREM produces accurate estimates of absolute animal density for all combinations of sensor detection widths and animal signal widths. However, larger sensor detection and animal signal widths were found to be more precise. While the model is accurate for all capture efforts tested, the precision of the estimate increases with the number of captures. We found no effect of different animal movement models on the accuracy and precision of the gREM.We conclude that the gREM provides an effective method to estimate absolute animal densities from remote sensor count data over a range of sensor and animal signal widths. The gREM is applicable for count data obtained in both marine and terrestrial environments, visually or acoustically (e.g. big cats, sharks, birds, echolocating bats and cetaceans). As sensors such as camera traps and acoustic detectors become more ubiquitous, the gREM will be increasingly useful for monitoring unmarked animal populations across broad spatial, temporal and taxonomic scales.
Density estimation of unmarked populations using camera traps in heterogeneous space
DOI:10.1002/wsb.v44.1 URL [本文引用: 1]
Estimating site occupancy rates when detection probabilities are less than one
Camera trap distance sampling for terrestrial mammal population monitoring: Lessons learnt from a UK case study
DOI:10.1002/rse2.v8.5 URL [本文引用: 2]
Camera traps can be heard and seen by animals
Three novel methods to estimate abundance of unmarked animals using remote cameras
Functional responses in habitat use: Availability influences relative use in trade-off situations
DOI:10.1890/0012-9658(1998)079[1435:FRIHUA]2.0.CO;2 URL [本文引用: 1]
Estimating animal density without individual recognition using information derivable exclusively from camera traps
DOI:10.1111/jpe.2018.55.issue-2 URL [本文引用: 3]
Landscape- scale estimation of forest ungulate density and biomass using camera traps: Applying the REST model
DOI:10.1016/j.biocon.2019.108381 URL [本文引用: 2]
A movement ecology paradigm for unifying organismal movement research
Monitoring for conservation
DOI:10.1016/j.tree.2006.08.007 URL [本文引用: 1]
Automatically identifying, counting, and describing wild animals in camera-trap images with deep learning
Abundance, density and relative abundance:A conceptual framework
In: Camera Traps in Animal Ecology: Methods and Analyses (eds O’Connell AF, Nichols JD, Karanth KU), pp. 71-96. Springer, New York.
Using distance sampling with camera traps to estimate the density of group-living and solitary mountain ungulates
DOI:10.1017/S003060532000071X
URL
[本文引用: 1]
Throughout the Himalaya, mountain ungulates are threatened by hunting for meat and body parts, habitat loss, and competition with livestock. Accurate population estimates are important for conservation management but most of the available methods to estimate ungulate densities are difficult to implement in mountainous terrain. Here, we tested the efficacy of the recent extension of the point transect method, using camera traps for estimating density of two mountain ungulates: the group-living Himalayan blue sheep or bharal Pseudois nayaur and the solitary Himalayan musk deer Moschus leucogaster. We deployed camera traps in 2017–2018 for the bharal (summer: 21 locations; winter: 25) in the trans-Himalayan region (3,000–5,000 m) and in 2018–2019 for the musk deer (summer: 30 locations; winter: 28) in subalpine habitats (2,500–3,500 m) in the Upper Bhagirathi basin, Uttarakhand, India. Using distance sampling with camera traps, we estimated the bharal population to be 0.51 ± SE 0.1 individuals/km2 (CV = 0.31) in summer and 0.64 ± SE 0.2 individuals/km2 (CV = 0.37) in winter. For musk deer, the estimated density was 0.4 ± SE 0.1 individuals/km2 (CV = 0.34) in summer and 0.1 ± SE 0.05 individuals/km2 (CV = 0.48) in winter. The high variability in these estimates is probably a result of the topography of the landscape and the biology of the species. We discuss the potential application of distance sampling with camera traps to estimate the density of mountain ungulates in remote and rugged terrain, and the limitations of this method.
Assessing the camera trap methodologies used to estimate density of unmarked populations
DOI:10.1111/jpe.v58.8 URL [本文引用: 4]
Estimating day range from camera-trap data: The animals’ behaviour as a key parameter
DOI:10.1111/jzo.12710
[本文引用: 1]
Day range (DR), the distance travelled by an individual during the day, is an important metric in movement ecology that recently gained interest by its relevance for estimating population density through the random encounter model (REM). Traditionally, DR has been estimated using GPS technology and considering raw straight-line distances between consecutive locations, which is an underestimation of the true path distance. In this work, we tested the accuracy of a new approach based on camera-trap data for the estimation of DR taking into account the animals' behaviour. For this purpose, we considered wild boar (Sus scrofa) as a model species. We tagged 18 individuals with telemetry devices and then monitored the population with camera-traps (photo and video mode) to estimate the DR. In the case of telemetry, a straight-line DR was estimated and rescaled with a tortuosity-related correction factor. Using this camera-trap data, we revisited the procedure described by Rowcliffe et al. (Remote Sens. Ecol. Conserv., 2, 2016, 84) to estimate the DR from the speed and activity information obtained from camera-trapsping. A new derivation of this approach was then developed, in which different animal behaviours were weighted to estimate the DR. The analysis showed no significant differences between the DR values obtained using telemetry data (corrected by the tortuosity-related correction factor) and those attained with the weighted approach. However, the original approach used to estimate the DR based on camera-trap data underestimated this parameter. The DR estimated with the weighted approach was 12.74 km center dot day(-1) +/- (se) 1.89. Here, we showed that animals' behaviour should be taken into account to estimate the DR when working with species that behave differently in front of cameras. These results may be relevant not only for REM, but also for movement ecology, disease dynamics and population monitoring methods.
Testing the precision and sensitivity of density estimates obtained with a camera-trap method revealed limitations and opportunities
DOI:10.1002/ece3.7619
PMID:34188858
[本文引用: 1]
The use of camera traps in ecology helps affordably address questions about the distribution and density of cryptic and mobile species. The random encounter model (REM) is a camera-trap method that has been developed to estimate population densities using unmarked individuals. However, few studies have evaluated its reliability in the field, especially considering that this method relies on parameters obtained from collared animals (., average speed, in km/h), which can be difficult to acquire at low cost and effort. Our objectives were to (1) assess the reliability of this camera-trap method and (2) evaluate the influence of parameters coming from different populations on density estimates. We estimated a reference density of black bears () in Forillon National Park (Québec, Canada) using a spatial capture-recapture estimator based on hair-snag stations. We calculated average speed using telemetry data acquired from four different bear populations located outside our study area and estimated densities using the REM. The reference density, determined with a Bayesian spatial capture-recapture model, was 2.87 individuals/10km [95% CI: 2.41-3.45], which was slightly lower (although not significatively different) than the different densities estimated using REM (ranging from 4.06-5.38 bears/10km depending on the average speed value used). Average speed values obtained from different populations had minor impacts on REM estimates when the difference in average speed between populations was low. Bias in speed values for slow-moving species had more influence on REM density estimates than for fast-moving species. We pointed out that a potential overestimation of density occurs when average speed is underestimated, that is, using GPS telemetry locations with large fix-rate intervals. Our study suggests that REM could be an affordable alternative to conventional spatial capture-recapture, but highlights the need for further research to control for potential bias associated with speed values determined using GPS telemetry data.© 2021 The Authors. Ecology and Evolution published by John Wiley & Sons Ltd.
Sampling design and analytical advances allow for simultaneous density estimation of seven sympa- tric carnivore species from camera trap data
DOI:10.1016/j.biocon.2019.02.018 URL [本文引用: 1]
Camera trapping photographic rate as an index of density in forest ungulates
DOI:10.1111/jpe.2009.46.issue-5 URL [本文引用: 1]
Which camera trap type and how many do I need? A review of camera features and study designs for a range of wildlife research applications
Estimating animal density using camera traps without the need for individual recognition
DOI:10.1111/jpe.2008.45.issue-4 URL [本文引用: 6]
Quantifying the sensitivity of camera traps: An adapted distance sampling approach
DOI:10.1111/j.2041-210X.2011.00094.x URL [本文引用: 1]
Quantifying levels of animal activity using camera trap data
DOI:10.1111/2041-210X.12278 URL [本文引用: 2]
N-mixture models for estimating population size from spatially replicated counts
DOI:10.1111/j.0006-341X.2004.00142.x
PMID:15032780
[本文引用: 1]
Spatial replication is a common theme in count surveys of animals. Such surveys often generate sparse count data from which it is difficult to estimate population size while formally accounting for detection probability. In this article, I describe a class of models (N-mixture models) which allow for estimation of population size from such data. The key idea is to view site-specific population sizes, N, as independent random variables distributed according to some mixing distribution (e.g., Poisson). Prior parameters are estimated from the marginal likelihood of the data, having integrated over the prior distribution for N. Carroll and Lombard (1985, Journal of American Statistical Association 80, 423-426) proposed a class of estimators based on mixing over a prior distribution for detection probability. Their estimator can be applied in limited settings, but is sensitive to prior parameter values that are fixed a priori. Spatial replication provides additional information regarding the parameters of the prior distribution on N that is exploited by the N-mixture models and which leads to reasonable estimates of abundance from sparse data. A simulation study demonstrates superior operating characteristics (bias, confidence interval coverage) of the N-mixture estimator compared to the Caroll and Lombard estimator. Both estimators are applied to point count data on six species of birds illustrating the sensitivity to choice of prior on p and substantially different estimates of abundance as a consequence.
Risky business or simple solution—Relative abundance indices from camera-trapping
DOI:10.1016/j.biocon.2012.12.025 URL [本文引用: 1]
Scaling-up camera traps: Monitoring the planet’s biodiversity with networks of remote sensors
DOI:10.1002/fee.2017.15.issue-1 URL [本文引用: 2]
Red deer population size and structure on Helan Mountain, Inner Mongolia, China
内蒙古贺兰山马鹿的种群数量及种群结构
Living on the edge: Opportunities for Amur tiger recovery in China
DOI:10.1016/j.biocon.2017.11.008 URL [本文引用: 1]
Population density of sitatunga in riverine wetland habitats
Estimating animal density for a community of species using information obtained only from camera-traps
DOI:10.1111/mee3.v13.10 URL [本文引用: 2]
Snap happy: Camera traps are an effective sampling tool when compared with alternative methods
DOI:10.1098/rsos.181748
URL
[本文引用: 1]
Camera traps have become a ubiquitous tool in ecology and conservation. They are routinely deployed in wildlife survey and monitoring work, and are being advocated as a tool for planetary-scale biodiversity monitoring. The camera trap's widespread adoption is predicated on the assumption of its effectiveness, but the evidence base for this is lacking. Using 104 past studies, we recorded the qualitative overall recommendations made by study authors (for or against camera traps, or ambiguous), together with quantitative data on the effectiveness of camera traps (e.g. number of species detected or detection probabilities) relative to 22 other methods. Most studies recommended the use of camera traps overall and they were 39% more effective based on the quantitative data. They were significantly more effective compared with live traps (88%) and were otherwise comparable in effectiveness to other methods. Camera traps were significantly more effective than other methods at detecting a large number of species (31% more) and for generating detections of species (91% more). This makes camera traps particularly suitable for broad-spectrum biodiversity surveys. Film camera traps were found to be far less effective than digital models, which has led to an increase in camera trap effectiveness over time. There was also evidence from the authors that the use of attractants with camera traps reduced their effectiveness (counter to their intended effect), while the quantitative data indicated that camera traps were more effective in closed than open habitats. Camera traps are a highly effective wildlife survey tool and their performance will only improve with future technological advances. The images they produce also have a range of other benefits, for example as digital voucher specimens and as visual aids for outreach. The evidence-base supports the increasing use of camera traps and underlines their suitability for meeting the challenges of global-scale biodiversity monitoring.
Generalized spatial mark-resight models with an application to grizzly bears
DOI:10.1111/jpe.2018.55.issue-1 URL [本文引用: 1]
Identifying animal species in camera trap images using deep learning and citizen science
DOI:10.1111/mee3.2019.10.issue-1 URL [本文引用: 1]
Estimating abundance and density of Amur tigers along the Sino-Russian border
DOI:10.1111/1749-4877.12210
PMID:27136188
[本文引用: 1]
As an apex predator the Amur tiger (Panthera tigris altaica) could play a pivotal role in maintaining the integrity of forest ecosystems in Northeast Asia. Due to habitat loss and harvest over the past century, tigers rapidly declined in China and are now restricted to the Russian Far East and bordering habitat in nearby China. To facilitate restoration of the tiger in its historical range, reliable estimates of population size are essential to assess effectiveness of conservation interventions. Here we used camera trap data collected in Hunchun National Nature Reserve from April to June 2013 and 2014 to estimate tiger density and abundance using both maximum likelihood and Bayesian spatially explicit capture-recapture (SECR) methods. A minimum of 8 individuals were detected in both sample periods and the documentation of marking behavior and reproduction suggests the presence of a resident population. Using Bayesian SECR modeling within the 11 400 km(2) state space, density estimates were 0.33 and 0.40 individuals/100 km(2) in 2013 and 2014, respectively, corresponding to an estimated abundance of 38 and 45 animals for this transboundary Sino-Russian population. In a maximum likelihood framework, we estimated densities of 0.30 and 0.24 individuals/100 km(2) corresponding to abundances of 34 and 27, in 2013 and 2014, respectively. These density estimates are comparable to other published estimates for resident Amur tiger populations in the Russian Far East. This study reveals promising signs of tiger recovery in Northeast China, and demonstrates the importance of connectivity between the Russian and Chinese populations for recovering tigers in Northeast China. © 2016 International Society of Zoological Sciences, Institute of Zoology/Chinese Academy of Sciences and John Wiley & Sons Australia, Ltd.
Population size and structure of blue sheep in Helan Mountains National Nature Reserve, Ningxia
宁夏贺兰山国家级自然保护区岩羊(Pseudois nayaur)种群数量及结构
