基于红外相机的不可个体识别动物种群密度估算方法
A practical guide for estimating the density of unmarked populations using camera traps
基于红外相机的不可个体识别动物种群密度估算方法 |
| 李珍珍, 杜梦甜, 朱原辛, 王大伟, 李治霖, 王天明 |
|
A practical guide for estimating the density of unmarked populations using camera traps |
| Zhenzhen Li, Mengtian Du, Yuanxin Zhu, Dawei Wang, Zhilin Li, Tianming Wang |
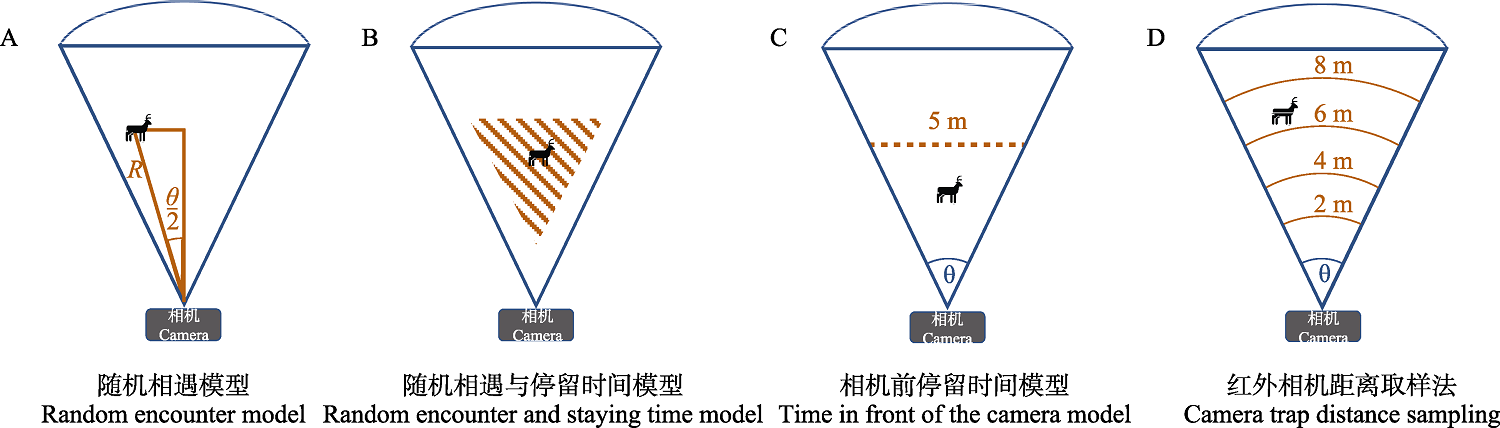
| 图3 四种模型相机探测区域示意图。(A)随机相遇模型(REM): 根据动物在相机视野初次停留位置测量计算该物种的平均探测半径R和平均探测角度θ; (B)随机相遇与停留时间(REST)模型: 探测区域为阴影部分(焦点区域), 认为该区域相机对目标物种的探测率最高; (C)相机前停留时间(TIFC)模型: 探测半径由标记距离与其范围内动物探测概率计算得到(以5 m距离为例); (D)红外相机距离取样法(CTDS): 以图中的距离标志为例, 2 m、4 m、6 m、8 m为标志距离, 其中8 m为截断距离(最远标志距离, 也被认为是探测区域半径), 该距离范围内为探测区域。 |
| Fig. 3 Camera detection area of four models. (A) Random encounter model (REM): the average detection radius (R) and the average detection angle (θ) of the species were calculated according to the measurement of the initial residence position of the animal. (B) Random encounter and staying time (REST) model: The detection area is the shadow part, which is considered to be the area with the highest detection rate of the focal species by the camera. (C) Time in front of the camera (TIFC) model: the detection radius is calculated by the marker distance and the detection probability of animals within its range (taking the distance of 5 m as an example). (D) Camera trap distance sampling (CTDS) model: In the graph, 2 m, 4 m, 6 m and 8 m are marked distances, of which 8 m is the truncated distance (also known as the radius of the detection area), within which the detection area is located. |
|
|