


全球变化所带来的生态影响近年来日益引起人们关注, 已成为生态学、保护生物学、生物地理学等学科的研究焦点。其中, 土地利用变化是全球变化最为主要的两大驱动因子之一(Luo et al, 2015; Alagador et al, 2016)。土地利用变化往往导致当地物种栖息地适宜性的改变、物种分布区的转移乃至区域生物多样性的变化(Sala et al, 2000)。此外, 由于物种栖息地的空间异质性, 土地利用变化还可能导致栖息地连通性的下降, 从而阻碍异质种群间的交流, 甚至引起当地物种消亡(Opdam & Wascher, 2004; Brodie et al, 2016)。因此, 土地利用变化不仅对物种的分布和丰度有着重要影响, 也对自然生态系统的稳定性和整体性的维持有重要作用(Watling et al, 2011; Cumming et al, 2014)。
随着社会经济的发展, 快速的城市化往往伴随着剧烈的土地利用变化(Fang et al, 2016)。研究物种在空间上如何响应城市化, 是制定和执行科学合理的保护管理对策的重要基础(Gibson et al, 2010)。这需要我们不仅关注当前物种的分布情况, 还要利用模型方法结合详尽的自然历史资料去评估物种栖息地的变化动态。目前的常用方法是利用物种分布模型, 如最大熵(maximum entropy, MaxEnt)模型, 将观测到的物种分布点的环境信息投影到研究区域的生物地理因子集上, 来分析不同环境条件下物种适宜栖息地的分布(Elith et al, 2006, 2011)。由于构建的模型还能够基于不同时期的环境条件, 因此可模拟同一物种在不同时期的适宜栖息地分布, 进而能够对比识别物种栖息地在不同时期的分布变化, 为生物多样性的保护提供支持, 此类模型已成为管理机构制定和实施生物多样性保护策略的有力工具。其中, MaxEnt模型因其运行时间短、操作简便、所需样本量小、结果准确等特点得到业内广泛认可(Zhang et al, 2011; Yang et al, 2013; 孔维尧等, 2019)。
鸟类作为食物链中的中、高级消费者, 对环境变化具有极高的敏感性, 对生态系统中其他成员的状况具有重要指示作用(满卫东等, 2017; 王春晓等, 2022)。粤港澳大湾区是我国南部沿海经济发展最为快速的地区之一, 在急剧的城市化进程下, 城市建筑用地的扩展无可避免地会对周边湿地、林地等野生动物自然栖息地进行蚕食, 从而导致物种分布区转移、区域多样性改变、栖息地隔离等等(Zhou et al, 2012; 丁志锋等, 2020)。本研究以鸟类为例, 利用实地调查所得的鸟类分布数据, 结合各种决定鸟类分布的环境因子, 利用最大熵模型模拟不同城市化进程情景下的鸟类分布, 计算各鸟类在城市化进程中分布区的周转变化。在此基础上, 结合等效连接面积(the equivalent connected area, ECA)指数, 评价不同城市化进程情景中鸟类分布区的连接度变化( 王淼 (2017) 基于最小耗费距离模型的生态连接度评价. 硕士学位论文, 昆明理工大学, 昆明), 以期为粤港澳大湾区的鸟类多样性保护和生态修复规划提供科学依据。
1 材料与方法
1.1 研究区域概况
粤港澳大湾区位于广东省中南部, 地理坐标112°45'-113°50' E, 21°31'-23°10' N。涵盖9个地级市与2个特别行政区, 即广州、深圳、珠海、佛山、惠州、东莞、中山、江门、肇庆、香港特别行政区、澳门特别行政区, 总面积约54,600 km2。大湾区属亚热带季风气候, 年均降水量达1,800 mm。年日照量约2,000 h, 年均气温21.4‒22.4℃。大部分地区坐落于珠江三角洲冲积平原上, 山地主要分布在大湾区北部的肇庆、广州、惠州及江门南部(冯珊珊和樊风雷, 2018; 王文静等, 2020)。本研究将整个研究范围转化为30 m空间分辨率的网格体系, 所有分析都在此网格体系上进行。
1.2 研究方法
1.2.1 物种分布数据
本研究选择2000年、2015年共2个时间节点来反映不同城市化进程情景的影响。大湾区鸟类分布记录来源于全国第二次陆生野生脊椎动物资源调查广东省的调查数据以及广州、惠州、珠海的野生脊椎动物资源本底调查数据, 数据由广东省科学院动物研究所依据第二次全国陆生野生动物资源调查技术规程和陆生野生脊椎动物物种多样性调查与监测技术规范实地调查所得。本研究仅选择了2015年1月至2016年1月期间的物种记录, 以确保物种记录时间与研究时间节点一致。此外, 为确保模型精度并消除空间自相关所导致的模型偏差, 仅选择了具有30个以上分布记录的鸟类作为本文的研究对象, 并且对于同一个物种在同一网格内仅保留1个记录(Hu et al, 2010; Shcheglovitova & Anderson, 2013), 总共82种鸟类被纳入本研究中(详见附录1), 合计24,389个分布数据。
1.2.2 环境因子
本研究使用的环境因子包括非城市化环境因子与城市化环境因子两大类(附录2)。其中, 非城市化环境因子指受城市化进程影响较小的环境因子, 包括气候与地形两类。虽然城市化进程会导致局部地区微气候与微地形的改变, 但是由于缺乏这些因子的动态数据, 且鉴于本研究时间跨度较小, 我们假设气候与地形两类因子在城市化进程情景中保持不变。该假设会导致研究结果更为保守, 但可以避免由于错误估计所导致的结果误差(Guisan & Zimmermann, 2000; Thuiller et al, 2006)。气候数据来源于全球气候数据中心(
图1
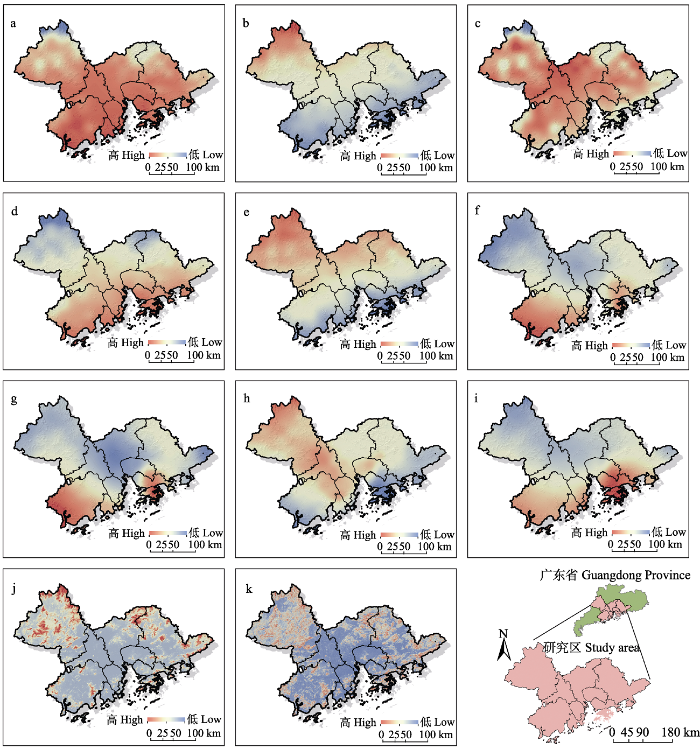
图1
粤港澳大湾区2015年非城市化环境因子(气候)。a: 年平均气温; b: 气温季节变化; c: 最暖月最高气温; d: 最冷月最低气温; e: 气温年变化; f: 年均降水量; g: 最湿月降水量; h: 最干月降水量; i: 降水量季节变化; j: 海拔; k: 坡度。
Fig. 1
Climate factors in Guangdong-Hong Kong-Macao Greater Bay Area during 2015. a, Annual mean temperature, AMT; b, Temperature seasonality, TS; c, Maximum temperature of the warmest month, MTWM; d, Minimum temperature of the coldest month, MTCM; e, Temperature annual range, TAR; f, Annual precipitation, AP; g, Precipitation of the wettest month, PWM; h, Precipitation of the driest month, PDM; i, Precipitation seasonality, PS; j, Elevation, ELEV; k, Slope, SLP.
城市化环境数据指受城市化进程影响而变化的一类环境因子, 亦是城市化进程对鸟类分布影响的主要驱动因子, 包括土地利用类型、植被覆盖度、水源距离、干扰距离(图2, 图3)。土地利用类型中红树林数据来自广东省林业局2017年全省红树林本底调查, 滩涂数据和人口密度数据由广东省城乡规划设计研究院提供, 其他土地利用类型数据由广东省环境科学研究院提供。植被覆盖度通过增强型植被指数(enhanced vegetation index, EVI)反映, 增强型植被指数以Landsat-8遥感卫星影像作为数据源, 通过ArcGIS 10.2软件计算得到。水源距离基于提取土地利用类型中的水体, 通过计算各个网格到最近水源(河流、湖泊、水库等)的欧式距离获得。干扰距离基于提取土地利用类型中的建设用地, 通过计算各网格到最近的干扰源(道路、建筑等)的欧式距离获得。所有的环境变量在ArcGIS 10.2中进行重采样, 统一到相同坐标系相同范围的30 m × 30 m分辨率下。
图2
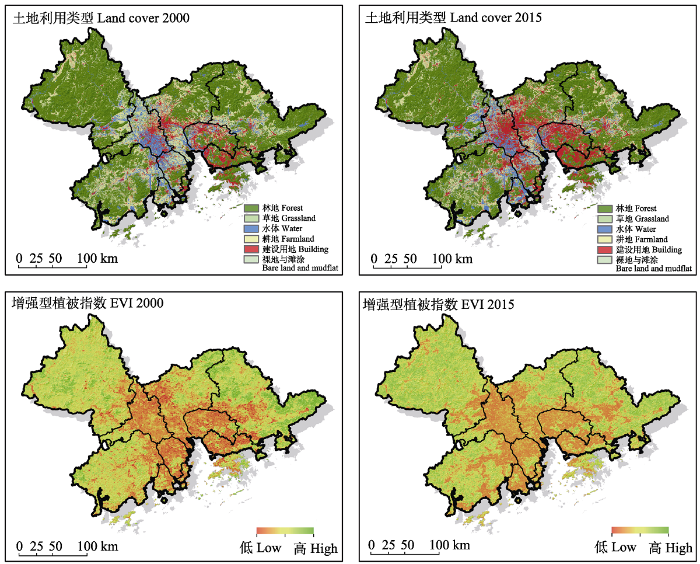
图2
粤港澳大湾区2000-2015年城市化环境因子变化(土地利用类型、增强型植被指数EVI)
Fig. 2
Changes of urbanization environmental factors (land cover, enhanced vegetation index, EVI) in Guangdong-Hong Kong-Macao Greater Bay Area from 2000 to 2015
图3
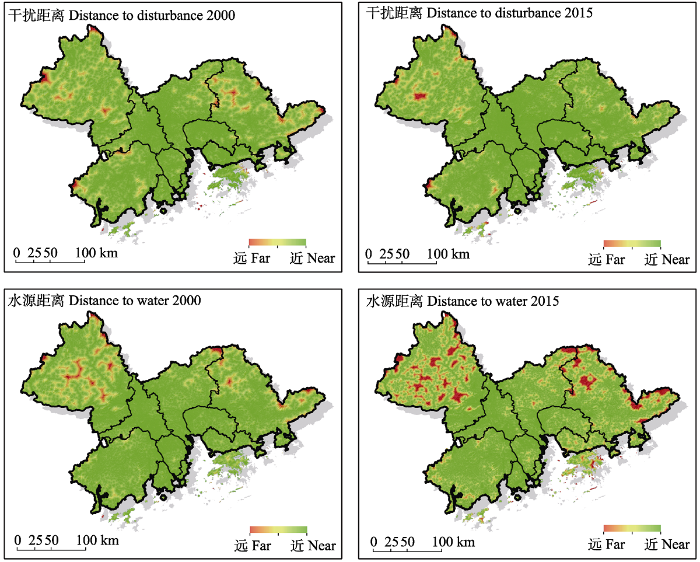
图3
粤港澳大湾区2000-2015年城市化环境因子变化(干扰距离、水源距离)
Fig. 3
Changes of urbanization environmental factors (distance to disturbance, distance to water) in Guangdong-Hong Kong-Macao Greater Bay Area from 2000 to 2015
1.2.3 物种分布模型
本研究使用MaxEnt模型对不同城市化进程情景下鸟类的潜在分布区进行预测。根据每种鸟的分布数据与各环境因子数据, 首先建立其在2015年城市化进程情景下的分布模型, 然后通过将城市化环境因子投影至2000年的城市化进程情景, 得到该鸟类在该城市化进程情景中的分布模型。
针对每种鸟类, 本研究选取80%的个体出现点记录作为训练数据进行分布预测, 剩下的20%个体出现点记录作为检验数据, 用于模型预测效果的检验。在检验过程中, 参照前人研究(Phillips & Anderson, 2006; Liu et al, 2013), 使用受试者工作特征曲线(receiver operating characteristic curve, ROC)及曲线下面积(area under the curve, AUC)作为模型优劣的标准, 其中AUC > 0.9表明模型具有极佳精度, 0.9 > AUC > 0.8表明模型具有较佳精度, 0.8 > AUC > 0.7表明模型精度中等, AUC < 0.7表明模型精度欠佳(Aráujo & New, 2007)。计算结果采用逻辑斯谛回归值(0-1), 反映栖息地适宜性或物种出现概率。
1.2.4 鸟类分布区识别
为了将预测结果从0-1的分布概率取值转化为(0, 1)的二项取值, 参照Luo等(2015)选择最小训练存在法作为阈值的确定方法。对于同一个物种在同一时间点的10个分布模型, 本研究选取了10次交叉验证的平均阈值作为整合模型的阈值, 若某一栅格的分布概率大于这一阈值, 则认为物种在这一栅格内为“分布”, 反之则为“无分布”。
分别计算各城市化进程情景下鸟类的分布面积, 并计算其变化百分比((后一情景分布面积-前一情景分布面积)/前一情景分布面积)。
1.2.5 鸟类栖息地连通性
其中, ai和aj为斑块i、j的面积, pij为i、j两斑块间的最大连接概率, 由两斑块间最小耗费路径距离转化而来, 对应距离范围为最远斑块之间距离的25%-75% (Saura et al, 2011)。
通过ECA的变化(dECA)与栖息地面积的变化(dA)的比值rECA (relativized ECA), 可了解栖息地结构变化是如何对连接度产生影响的。rECA > 1, 表明连接度变化程度超出栖息地面积随机变化对连接度的影响, 栖息地面积变化导致栖息地某些重要连接性组分的改变; 相对地, rECA < 1或rECA = 1表示连接度的变化主要是由栖息地面积减少所导致, 栖息地变化是由原来栖息地的收缩或扩展所产生。
2 结果
2.1 城市化进程下环境因子的改变
从2000年到2015年间粤港澳大湾区土地利用变化结果可以看出, 粤港澳大湾区建设用地面积增加得最多, 且主要集中在广州、佛山、中山、东莞、深圳等经济活跃的城市。从2000年至2015年大湾区土地利用类型发生明显改变(表1)。2000年最主要的3种土地类型依次为林地(占研究区总面积的61.16%)、耕地(21.50%)和水体(8.91%); 2015年则转变为林地(59.13%)、耕地(16.51%)和建设用地(14.81%)。15年间, 耕地、林地、水体等土地类型分别减少了各自面积的23.19%、3.22%和0.97%。减少比例最大的为耕地, 主要转为建设用地(19.40%), 达2,281.25 km2, 其次是转为水体(9.92%)和林地(9.35%), 分别为1,166.84 km2和1,098.99 km2。林地的转出以耕地(3.47%)和建设用地(2.94%)为主, 分别为1,159.69 km2和982.76 km2。水体的转出以建设用地(16.25%)和耕地(9.88%)为主。
表1 2000-2015年大湾区土地利用类型变化转移矩阵
Table 1
| 2000年各土地利用类型 Land use types in 2000 | 2015年各土地利用类型面积 Areas of each land use type in 2015 (km2) | |||||||
|---|---|---|---|---|---|---|---|---|
| 草地 Grassland | 耕地 Farmland | 建设用地 Building | 林地 Forest | 裸地与滩涂 Bare land and mudflat | 水体 Water | 合计 Total | 变化比例 Change proportion | |
| 草地 Grassland | 41.78 | 3.48 | 10.34 | 10.54 | 0.60 | 2.09 | 68.82 | 33.95% |
| 耕地 Farmland | 4.28 | 7,189.09 | 2,281.25 | 1,098.99 | 18.08 | 1,166.84 | 11,758.51 | -23.19% |
| 建设用地 Building | 4.08 | 193.32 | 4,029.98 | 201.58 | 2.59 | 61.64 | 4,493.19 | 80.34% |
| 林地 Forest | 38.37 | 1,159.69 | 982.76 | 30,786.88 | 235.41 | 252.75 | 33,455.86 | -3.22% |
| 裸地与滩涂 Bare land and mudflat | 0.00 | 4.18 | 6.47 | 34.06 | 1.89 | 1.70 | 48.29 | 453.52% |
| 水体 Water | 3.69 | 481.67 | 792.11 | 246.15 | 8.74 | 3,341.68 | 4,874.04 | -0.97% |
| 合计 Total | 92.19 | 9,031.43 | 8,102.90 | 32,378.20 | 267.30 | 4,826.70 | 54,698.71 | |
相反, 草地、建设用地、裸地与滩涂三类用地类型分别比各自面积增加了33.95%、80.34%和453.52%, 其中草地的增加主要源于林地的转入(38.37 km2, 占2015年草地面积的41.63%); 建设用地增加主要源于耕地、林地和水体的转入, 分别占2015年建设用地面积的28.15%、12.13%和9.78%。
总体来看, 在不同土地类型的转入转出中, 总体面积保持相对稳定的是水体(-0.97%)和林地(-3.22%); 主要是因为, 林地虽然面积有所减少, 但也有1,098.99 km2的耕地、246.15 km2的水体和201.58 km2的建设用地转入。
2.2 城市化进程对鸟类分布的影响
82种鸟类分布模型的平均AUC为0.89 ± 0.05, 表明所有分布模型均有较佳的预测精度。
结果显示, 矶鹬(Actitis hypoleucos)、红头长尾山雀(Aegithalos concinnus)、叉尾太阳鸟(Aethopyga christinae)等52种鸟类(占全部研究鸟类种数的63.41%)在城市化进程下分布区面积出现增加(附录3), 平均增加幅度为12.76%。这些鸟类大部分为常见城市伴生鸟类及各类水鸟。其中面积增加比例最高的为牛背鹭(Bubulcus ibis) (69.33%, 从47.27 km2增加到80.05 km2), 其次为苍鹭(Ardea cinerea) (53.27%, 从21.68 km2增加到33.22 km2)。八哥(Acridotheres cristatellus)、白胸苦恶鸟(Amaurornis phoenicurus)、田鹨(Anthus richardi)等30种鸟类(占全部研究鸟类种数的36.59%)在城市化进程下分布区面积减少, 平均减少幅度为20.32%。这些鸟类大部分为以森林、农田为主要栖息生境的鸟类。其中, 面积减少比例最高的为乌鹃(Surniculus lugubris) (-42.50%), 其次为栗耳凤鹛(Yuhina castaniceps) (-38.80%) (图4)。
图4
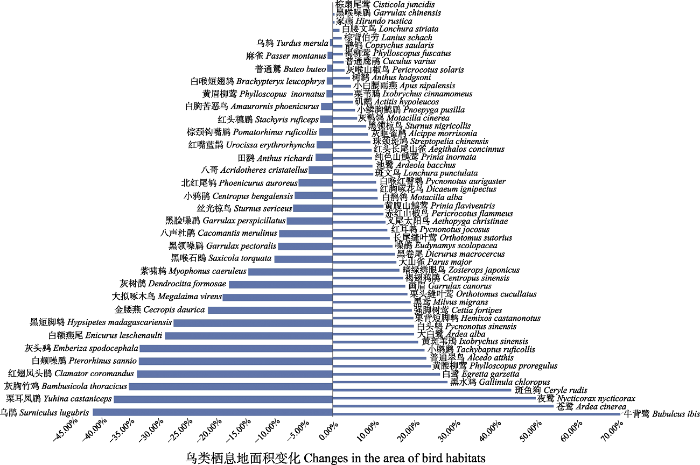
图4
2000-2015年大湾区城市化进程下鸟类栖息地面积变化
Fig. 4
Changes in the area of bird habitats in the process of urbanization of the Guangdong-Hong Kong-Macao Greater Bay Area from 2000 to 2015
栖息地面积增加比例最高的牛背鹭和苍鹭的核心栖息地斑块数量分别由66和31减少为42和24, 栖息地面积减少比例最高的乌鹃和栗耳凤鹛的核心栖息地斑块数量分别由14和13增加为27和18。
2.3 城市化进程对鸟类栖息地连通性的影响
图5
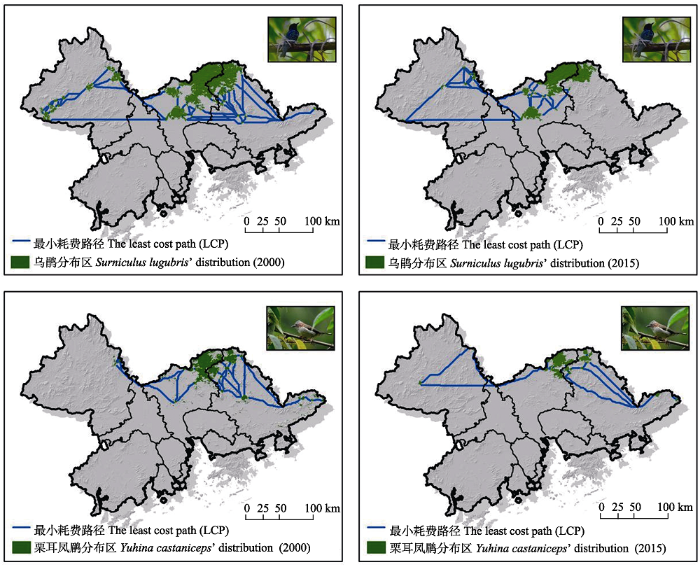
图5
2000-2015年粤港澳大湾区城市化进程下鸟类(乌鹃、栗耳凤鹛)栖息地核心斑块分布与斑块间最小耗费路径变化
Fig. 5
Distribution changes of the core patches of bird habitat (Surniculus lugubris, Yuhina castaniceps) and the least cost path among them under the process of urbanization in Guangdong-Hong Kong-Macao Greater Bay Area from 2000 to 2015
图6
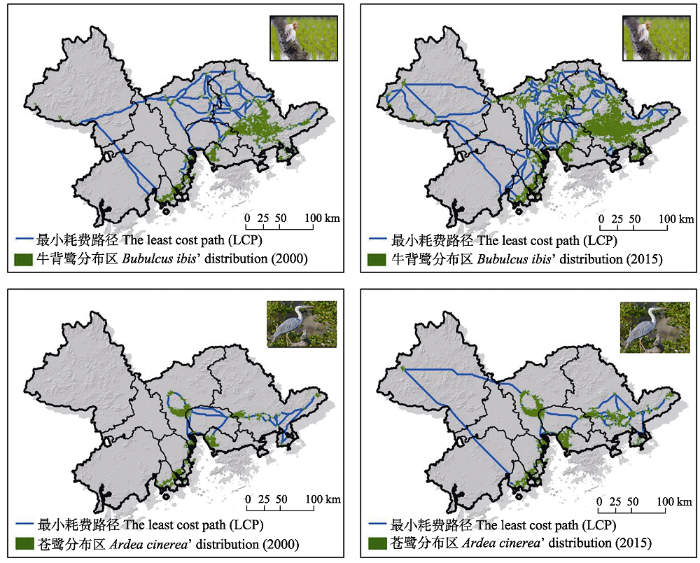
图6
城市化进程下鸟类栖息地核心斑块与斑块间最小耗费路径变化(牛背鹭、苍鹭)
Fig. 6
Changes in the core patch of bird habitat and the least cost path between the core patches under the process of urbanization (Bubulcus ibis, Ardea cinerea)
表2 2000-2015年大湾区4种代表性鸟类的分布面积与等效连接面积指数变化
Table 2
| 物种 Species | 分布面积 Distribution area (km2) | 栖息地面积变化 The change of habitat area (dA) | 等效连接面积 The equivalent connected area (ECA) (km2) | 等效连接面积的变化 dECA | 等效连接面积变化比值 rECA | ||
|---|---|---|---|---|---|---|---|
| 2000 | 2015 | 2000 | 2015 | ||||
| 苍鹭 Ardea cinerea | 21.68 | 33.22 | 0.53 | 1,140.81 | 2,150.92 | 0.89 | 1.66 |
| 牛背鹭 Bubulcus ibis | 47.27 | 80.05 | 0.69 | 3,113.29 | 5,993.31 | 0.93 | 1.33 |
| 乌鹃 Surniculus lugubris | 41.30 | 23.75 | -0.43 | 3,506.69 | 2,152.00 | -0.39 | 0.91 |
| 栗耳凤鹛 Yuhina castaniceps | 17.65 | 10.80 | -0.39 | 1,396.05 | 916.29 | -0.34 | 0.88 |
3 讨论
城市化进程下粤港澳大湾区建设用地不断扩张, 自然生态系统和农业生态系统向城市生态系统不断转化(郭泺等, 2006), 林地、水体、耕地等用地减少, 草地、建设用地、裸地等用地增加, 以森林、农田为主要栖息生境的鸟类分布区面积减少, 城市伴生鸟类及各类水鸟分布面积增加。鸟类分布面积与土地利用类型密切相关, 鸟类栖息地连接度表现出与分布区相一致的变化趋势。土地利用的变化直接影响着鸟类的分布及其栖息地连通性的改变。
3.1 土地利用变化对鸟类分布的影响
在选择研究的82种鸟类中, 有30种鸟类的分布区面积随着城市化进程而减少, 而有52种鸟类的分布区面积随着城市化进程表现出不同程度的增加。这主要是由于不同鸟类对城市化进程中不同环境因子的适应性差异决定的(徐沙等, 2013)。例如, 乌鹃、大拟啄木鸟(Psilopogon virens)、白额燕尾(Enicurus leschenaultia)、白喉短翅鸫(Brachypteryx leucophrys)、栗耳凤鹛等林栖鸟类喜好密闭植被环境, 并回避人类活动干扰。随着大湾区城市化进程推进, 林地面积减少, 植被覆盖度下降, 人类干扰距离缩短, 这些鸟类的适宜栖息地减少。同时, 如麻雀(Passer montanus)、田鹨、金腰燕(Cecropis daurica)等喜欢在农田耕地环境中栖息、觅食的鸟类随耕地面积减少其分布面积也有所下降。而普通翠鸟(Alcedo atthis)、斑鱼狗(Ceryle rudis)、池鹭(Ardeola bacchus)、苍鹭、夜鹭(Nycticorax nycticorax)、大白鹭(Ardea alba)、黑水鸡(Gallinula chloropus)等涉禽水鸟的分布面积随着围填海过程中所带来滩涂荒地等裸地面积的增加而增加; 白头鹎(Pycnonotus sinensis)、红耳鹎(P. jocosus)、白鹡鸰(Motacilla alba)、暗绿绣眼鸟(Zosterops japonicas)等习惯城市栖息环境的“伴人鸟类”随着城区面积扩张, 其分布区均不同程度的增加。
此外, 部分鸟类物种栖息地面积与斑块数量往往呈现相反的变化趋势(如牛背鹭、乌鹃), 这可能是因为随着栖息地面积的增加, 更多的斑块被连接形成了更大的斑块, 反之依然。
3.2 土地利用变化对鸟类栖息地连通性的影响
通过分别对分布区增减幅度最高的各两种鸟类的ECA指数分析发现, 随着栖息地分布区的改变, 鸟类栖息地连接度均有不同程度的变化, 而其变化趋势与分布区的变化相一致, 亦即分布区面积增加连接度上升, 而分布区面积减少连接度下降。这可能是由于栖息地面积的增加导致可用连接区域的上升所引起(Dilts et al, 2016), 反之亦然。由于ECA指数具有面积特性, 因此可以通过将其变化与分布区变化进行直接对比, 以进一步探讨连接度变化发生的原因。本研究的结果显示, 对于乌鹃与栗耳凤鹛这两种分布于大湾区北部、西北部等大片森林区域的典型林栖鸟类而言, 由于大湾区城市化进程并未导致大片林地消失, 林地面积下降并非十分显著, 因此, 城市化对这两种鸟类栖息地连通性的影响主要来自原有栖息地斑块的收缩, 连接度变化并未超出分布面积变化。而对于牛背鹭与池鹭这两种分布于大湾区南部各河岸海滩及湖泊水库周边滩涂的水鸟而言, 随着城市化推进, 滩涂荒地等裸地的面积增加, 其生境斑块数量出现明显增加。当这些新增栖息地斑块出现在原有栖息地斑块之间时, 将起到踏脚石的作用, 显著提高了栖息地的连通性, 其对整体栖息地连通性的作用要远远高出其面积变化所带来的影响(Ma et al, 2010)。因此, 两者栖息地连接度的变化要远高于分布区面积变化。恢复物种潜在栖息地不仅需要扩大其斑块面积, 更需要从连接度的角度出发, 设计和增加一些具有特殊意义和作用的斑块以增加连通性, 实现空间和功能上的合理镶嵌, 从而完善生态网络, 真正实现生物多样性保护。
3.3 建议和展望
由于社会经济发展水平差异, 土地利用变化的内在驱动力也不同。粤港澳大湾区是中国开放程度最高、经济活力最强的区域之一, 经济要素是影响城市空间扩张和土地利用类型变化的主要驱动力(陈江实浩和杨木壮, 2017)。
随着城市化的发展, 我国沿海地区存在不同程度的填海造地(高梅和曾辉, 2012), 以满足城市扩张对建筑用地的需求, 导致水体不断减少, 海岸带变化剧烈, 直接影响了相邻的海陆生态环境。城市化进程导致湾区内自然生态空间不断受到挤压(王文静等, 2020), 生态系统破碎化程度不断增加, 林地和耕地的减少导致喜好密闭植被环境的林栖鸟类和依赖耕地觅食的鸟类分布区面积减少, 分布区面积减少进而导致这些鸟类栖息地连接度的降低, 栖息地破碎化程度如果持续加剧, 一些专化种可能被泛化种所替代, 从而导致物种的局域灭绝(Bonier et al, 2007)。为保护粤港澳大湾区生物多样性, 后续研究可对城市化进程中其生境质量变化进行评估, 根据评估结果构建鸟类生态廊道和生物多样性保护网络, 从而维持大湾区区域生态系统的安全和稳定。
值得注意的是, 本文主要关注栖息地的空间格局和连通性, 并未对物种的移动能力进行区分, 实际上水鸟和林鸟的扩散能力不同, 其对生境斑块连通性变化的响应也会不同, 未来的研究有必要从景观连通性和鸟类移动能力两方面综合考虑城市化的影响, 从而更好地反映实际情况。本研究受限于数据获取, 将大湾区行政区划边界作为研究区边界, 忽略了边界外的环境因子可能带来的影响, 未来研究需进一步解决此问题。此外, 本次研究仅选择了82种大湾区内最为常见的鸟类作为研究对象, 对于一些如白鹇等的珍稀濒危鸟类, 由于点位信息的不足或缺乏, 而未能进行建模预测分析, 但这并非意味着这些鸟类受城市化影响不大, 相反, 珍稀濒危物种由于对栖息地环境选择更为严格(Ghosal & Hossain, 2011; Zhang KL et al, 2018; Zhang YK et al, 2018), 其分布区更为狭小, 受气候变化与城市化等环境变迁影响相对于广域分布鸟类而言更大(白雪红等, 2019), 需要作为未来研究的一个重点予以关注。
致谢
感谢广东省野生动物调查监测与生态修复工程技术研究中心对本研究的支持, 同时感谢广东省城乡规划设计研究院对本文环境数据获取的协助。
附录 Supplementary Material
附录1 鸟类分布模型模拟结果统计
Appendix 1 Statistical results of bird distribution model
附录2 用于物种分布模型模拟的环境因子
Appendix 2 Environmental factors used in species distribution models
附录3 城市化背景下鸟类分布区变化
Appendix 3 Changes in bird distribution areas under the background of urbanization
参考文献
Climate change, species range shifts and dispersal corridors: An evaluation of spatial conservation models
DOI:10.1111/mee3.2016.7.issue-7 URL [本文引用: 1]
Ensemble forecasting of species distributions
DOI:10.1016/j.tree.2006.09.010 URL [本文引用: 2]
Simulation of potential suitable distribution of endangered waterfowl and its gap analysis of national nature reserves in Beijing-Tianjin-Hebei region under climate change scenarios
气候变化背景下京津冀地区濒危水鸟潜在适宜区模拟及保护空缺分析
Urban birds have broader environmental tolerance
Urbanization dramatically changes the composition and diversity of biotic communities. The characteristics distinguishing species that persist in urban environments, however, are poorly understood. Here we test the hypothesis that broadly adapted organisms are better able to tolerate urbanization, using a phylogenetically controlled, global comparison of birds. We compared elevational and latitudinal distributions of 217 urban birds found in 73 of the world's largest cities with distributions of 247 rural congeners to test the hypothesis that urban birds possess broader environmental tolerance. Urban birds had markedly broader environmental tolerance than rural congeners, as estimated by elevational and latitudinal distributions. Our results suggest that broad environmental tolerance may predispose some birds to thrive in urban habitats. The mechanisms mediating such environmental tolerance warrant further investigation, but probably include greater behavioural, physiological and ecological flexibility.
Connecting science, policy, and implementation for landscape-scale habitat connectivity
DOI:10.1111/cobi.12667
PMID:26648510
[本文引用: 1]

We examined the links between the science and policy of habitat corridors to better understand how corridors can be implemented effectively. As a case study, we focused on a suite of landscape-scale connectivity plans in tropical and subtropical Asia (Malaysia, Singapore, and Bhutan). The process of corridor designation may be more efficient if the scientific determination of optimal corridor locations and arrangement is synchronized in time with political buy-in and establishment of policies to create corridors. Land tenure and the intactness of existing habitat in the region are also important to consider because optimal connectivity strategies may be very different if there are few, versus many, political jurisdictions (including commercial and traditional land tenures) and intact versus degraded habitat between patches. Novel financing mechanisms for corridors include bed taxes, payments for ecosystem services, and strategic forest certifications. Gaps in knowledge of effective corridor design include an understanding of how corridors, particularly those managed by local communities, can be protected from degradation and unsustainable hunting. There is a critical need for quantitative, data-driven models that can be used to prioritize potential corridors or multicorridor networks based on their relative contributions to long-term metacommunity persistence.© 2016 Society for Conservation Biology.
Characteristics and driving factors of land use transfer in economically developed coastal regions—A case of Nanshan District, Shenzhen
沿海经济发达地区土地利用转移特征及驱动因素: 以深圳市南山区为例
Implications of agricultural transitions and urbanization for ecosystem services
DOI:10.1038/nature13945 [本文引用: 1]
Functional and phylogenetic diversity of birds in urban habitat patches in Macao, China
澳门城市栖息地斑块中鸟类群落功能和谱系多样性
Multiscale connectivity and graph theory highlight critical areas for conservation under climate change
DOI:10.1890/15-0925 URL [本文引用: 1]
Novel methods improve prediction of species’ distributions from occurrence data
DOI:10.1111/j.2006.0906-7590.04596.x URL [本文引用: 1]
A statistical explanation of MaxEnt for ecologists
DOI:10.1111/ddi.2010.17.issue-1 URL [本文引用: 1]
International progress and evaluation on interactive coupling effects between urbanization and the eco-environment
DOI:10.1007/s11442-016-1317-9 URL [本文引用: 1]
Spatiotemporal changes of landscape pattern using impervious surface in Guangdong-Hong Kong-Macao Greater Bay Area, China
DOI:10.13287/j.1001-9332.201809.013
[本文引用: 1]
Impervious surface is a key indicator for urbanization degree and the quality of urban environment. It is of great ecological significance to study the evolution of urban landscape based on impervious surface. We explored the spatiotemporal changes of impervious surface landscape pattern in Guangdong-Hong Kong-Macao Greater Bay Area from 2006 to 2016 using multi-temporal Landsat images based on landscape pattern index. The results showed that the impervious surface area (ISA) significantly increased in Guangdong-Hong Kong-Macao Greater Bay Area from 12127.69 km<sup>2</sup> in 2006 to 20188.87 km<sup>2</sup> in 2016, with an annual growth rate of 806.12 km<sup>2</sup>. High-density ISA was distributed in Guangzhou-Foshan and Shenzhen-Dongguan districts on the east and west of the Pearl River, respectively. In general, patch numbers, patch density, and edge density, as well as shape complexity and its fragmentation kept increasing during the past decade. The landscape pattern tended to be disordered, fragmented, and irregular. Moreover, the difference of impervious surface landscape pattern is obvious between cities. The areas with highest connectivity, stability and regularization were distributed in Hong Kong and Macao, while the landscape pattern in Huizhou and Jiangmen trended to be fragmentized and complex.
基于不透水面的粤港澳大湾区景观格局时空变化
DOI:10.13287/j.1001-9332.201809.013
[本文引用: 1]
城市不透水面是反映城市化程度和城市环境质量的关键指标,基于不透水面研究城市景观格局演变具有重要的生态意义.利用遥感数据结合景观格局指数探讨了粤港澳大湾区2006—2016年城市不透水面时空演变状况,分析了基于不透水面的景观格局变化规律.结果表明: 2006—2016年,粤港澳大湾区不透水面扩张显著,总面积从12127.69 km<sup>2</sup>增至20188.87 km<sup>2</sup>,年增长速率高达806.12 km<sup>2</sup>·a<sup>-1</sup>,并且在珠江东、西两岸分布形成广佛、深莞高密度聚集区.总体上,湾区内不透水面斑块数量明显增多,斑块密度和边缘密度变大,不透水面的优势度越来越突出,不透水面斑块形状趋复杂化,聚集程度降低,整体景观格局呈无序、破碎化、不规则化的趋势.湾区内各城市不透水面的景观格局演变具有明显差异,其中,澳门、香港的不透水面连通性最强,城市景观趋于稳定性、规则化、聚集性;惠州、江门市的不透水面斑块形状复杂,城市景观趋于破碎化.
Dynamic change of the shoreline in Shenzhen during 1986-2020
综合利用Landsat TM影像数据、土地利用变更调查数据和城市总体规划成果资料,对深圳市1986-2020年期间海岸线变化进行回顾和预测分析,总结了海岸线动态变化区域土地利用时空动态变化的基本特征并进行了成因探讨.结果表明:深圳市在1986-2020年间海岸线人为改造活动表现出明显的西强东弱的空间分异格局,其中西部海岸线即将全部被改造成人工岸线,东部还保留约100.4 km的天然岸线;全市6处岸线热点变化区域累积填海造地总面积将达到108.9 km2,目前已经完成74.0 km2.缓解土地资源供需紧张矛
深圳市1986-2020年间海岸线动态变化特征及成因分析
综合利用Landsat TM影像数据、土地利用变更调查数据和城市总体规划成果资料,对深圳市1986-2020年期间海岸线变化进行回顾和预测分析,总结了海岸线动态变化区域土地利用时空动态变化的基本特征并进行了成因探讨.结果表明:深圳市在1986-2020年间海岸线人为改造活动表现出明显的西强东弱的空间分异格局,其中西部海岸线即将全部被改造成人工岸线,东部还保留约100.4 km的天然岸线;全市6处岸线热点变化区域累积填海造地总面积将达到108.9 km2,目前已经完成74.0 km2.缓解土地资源供需紧张矛
Conservation of globlally threatened migratorty waders through restoration of wetlands in an ecologically critical area—An experience from St. Martin’s Island, Bangladesh
孟加拉圣马丁岛恢复湿地生态关键区保护全球濒危迁徙涉禽的经验
Predictive habitat distribution models in ecology
DOI:10.1016/S0304-3800(00)00354-9 URL [本文引用: 1]
Spatio-temporal change and gradient differentiation of landscape pattern in Guangzhou City during its urbanization
Guangzhou City is a rapidly urbanizing city in China, and a constructed city with holistic planning. By using the remote sensing images of 1985, 1990, 1995, 2000 and 2004,this paper studied the 20 years spatio-temporal changes of landscape pattern in Guangzhou, and analyzed the relationships between these changes and urbanization. The landscape and class-level pattern indices of whole Guangzhou City and its five districts were compared, and the results indicated that the landscape pattern in Guangzhou had an obvious spatio-temporal variation, and an increase of diversity and fractal dimension. The landscape structural complexity and fragmentation increased gradually from 1985 to 2004, and the variation intensity and tendency varied during four comparative stages 1985~1990, 1990~1995, 1995~2000, and 2000~2004. It was a rapid development period from 1985 to 1995 in Guangzhou. The represents of ten districts varied in their spatio-temporal landscape pattern, because of the different development progress and planning motive. The urbanization of Panyu was from1990 to 2000, and its natural landscape was seriously disturbed by human activities. The represents of Conghua and Zengcheng districts were of integrative disturbance, and also, the urbanization process mainly took place during 1990-2000. In the city center consisting of 8 official constructed districts, the urbanization process happened earlier. In Huadu district, the landscape change revealed the frequent and severe human disturbance.
城市化进程中广州市景观格局的时空变化与梯度分异
The impacts of climate change on the wintering distribution of an endangered migratory bird
DOI:10.1007/s00442-010-1732-z
PMID:20677016
[本文引用: 1]
There is now ample evidence of the effects of anthropogenic climate change on the distribution and abundance of species. The black-faced spoonbill (Platalea minor) is an endangered migratory species and endemic to East Asia. Using a maximum entropy approach, we predicted the potential wintering distribution for spoonbills and modeled the effects of future climate change. Elevation, human influence index and precipitation during the coldest quarter contributed most to model development. Five regions, including western Taiwan, scattered locations from eastern coastal to central mainland China, coastal areas surrounding the South China Sea, northeastern coastal areas of Vietnam and sites along the coast of Japan, were found to have a high probability of presence and showed good agreement with historical records. Assuming no limits to the spread of this species, the wintering range is predicted to increase somewhat under a changing climate. However, three currently highly suitable regions (northeastern Vietnam, Taiwan and coastal areas surrounding the South China Sea) may face strong reductions in range by 2080. We also found that the center of the predicted range of spoonbills will undergo a latitudinal shift northwards by as much as 240, 450, and 600 km by 2020, 2050 and 2080, respectively. Our findings suggest that species distribution modeling can inform the current and future management of the black-faced spoonbill throughout Asia. It is clear that a strong international strategy is needed to conserve spoonbill populations under a changing climate.
Connectivity measures: A review
Optimizing MaxEnt model in the prediction of species distribution
最大熵模型在物种分布预测中的优化
DOI:10.13287/j.1001-9332.201906.029
[本文引用: 1]
最大熵模型在物种分布的预测研究中得到广泛应用,但未经优化的模型的预测结果可能存在严重的拟合偏差.本文汇总了最大熵模型在取样偏差修正、模型复杂性调整、物种分布判定阈值选择以及模型检验过程中的若干优化方法.在取样偏差的修正中,空间筛除法的修正效果最好,而背景限制法表现不佳.模型复杂性受建模变量的数量、函数模式和调控系数的影响.在样本量小于建模变量的数量时需进行变量筛选,筛选标准应侧重其生态学意义,而非变量间的相关性;函数模式对模型表现影响不大,在预测结果相近情况下应选择简单模型;建模时需要调整调控系数以控制过度拟合,一般最优模型调控系数高于默认值.判定物种出现阈值应遵从客观性、等效性和判别力3个原则,敏感度和特异性加和最大是良好的阈值判定标准.模型检验可分为不依赖阈值的检验和依赖阈值的检验,在不依赖阈值的模型评估方法中,基于信息标准选择的模型表现优于基于AUC或相关系数(COR)选择的模型;在基于阈值的模型评估方法中,真实技能统计能够兼顾模型遗漏误差和错判误差,不受假设缺失影响,且受物种流行度的影响较小.
Selecting thresholds for the prediction of species occurrence with presence-only data
DOI:10.1111/jbi.12058 URL [本文引用: 1]
Impacts of climate change on distributions and diversity of ungulates on the Tibetan Plateau
DOI:10.1890/13-1499.1 URL [本文引用: 2]
Managing wetland habitats for waterbirds: An international perspective
DOI:10.1007/s13157-009-0001-6 URL [本文引用: 1]
Dynamics of habitat suitability for waterfowls from 1990 to 2015 in the ecological function zone of Sanjiang Plain, Northeast China
DOI:10.13287/j.1001-9332.201712.036
[本文引用: 1]
As a wetland of international importance, the ecological function zone of the Sanjiang Plain (EFZSP) plays an important role in maintaining waterfowl habitat. With the increasing disturbance of human beings, land use and climate changes, habitat suitability for waterfowls (HSW) has drawn greater attention of ecologists. In this study, Landsat TM/ETM+/OLI and HJ-1B images in 1990, 2000, 2010 and 2015 were used to obtain land cover classification by object-based image analysis, and the entropy and analytic hierarchy process methods were adopted to determine the factors and their weights, the factors selected in this study included water condition (lake and river density), disturbance factor (residence and road density), shelter condition (land cover type and slope), and food abundance (NDVI). Finally, the evaluation results of habitat suitability of year 1990, 2000, 2010, and 2015 were achieved based on the habitat suitability index (HSI) system, and the spatio-temporal dynamics and driving forces causing the changes were analyzed. The results showed that the excellent level of HSW mainly distributed in abundant water areas, especially along the riparian zone of the Heilongjiang River, Naoli River, Ussuri River, Muling River and Xingkai Lake. Its area decreased by 3.2% from 1990 to 2015 because of wetland reclamation. The good level of HSW concentrated in Raohe County over the past 25 years, the condition of Hulin County and Fuyuan County were improved to a good level from 2010 to 2015 due to the substantial increase of paddy field areas. The fair level of HSW distributed dispersedly, and the areas first increased from 1990 to 2000 and then decreased during 2000-2010 and 2010-2015 periods. The areas of poor le-vel increased by 6.7% from 1990 to 2000 and decreased by 3.1% from 2000 to 2015. The change of HSW level in this study area was dominated by land cover change, and both of the increasing population and economy and the drying and worming climate resulted in the decline of the HSW level, whereas the establishment of nature reserves is crucial to protect habitat for waterfowls.
1990-2015年三江平原生态功能区水禽栖息地适宜性动态
The performance of state-of-the-art modelling techniques depends on geographical distribution of species
DOI:10.1016/j.ecolmodel.2008.10.019 URL [本文引用: 1]
The unseen uncertainties in climate change: Reviewing comprehension of an IPCC scenario graph
DOI:10.1007/s10584-015-1473-4 URL [本文引用: 1]
A graph-theory framework for evaluating landscape connectivity and conservation planning
DOI:10.1111/j.1523-1739.2007.00871.x
PMID:18241238
[本文引用: 1]
Connectivity of habitat patches is thought to be important for movement of genes, individuals, populations, and species over multiple temporal and spatial scales. We used graph theory to characterize multiple aspects of landscape connectivity in a habitat network in the North Carolina Piedmont (U.S.A). We compared this landscape with simulated networks with known topology, resistance to disturbance, and rate of movement. We introduced graph measures such as compartmentalization and clustering, which can be used to identify locations on the landscape that may be especially resilient to human development or areas that may be most suitable for conservation. Our analyses indicated that for songbirds the Piedmont habitat network was well connected. Furthermore, the habitat network had commonalities with planar networks, which exhibit slow movement, and scale-free networks, which are resistant to random disturbances. These results suggest that connectivity in the habitat network was high enough to prevent the negative consequences of isolation but not so high as to allow rapid spread of disease. Our graph-theory framework provided insight into regional and emergent global network properties in an intuitive and visual way and allowed us to make inferences about rates and paths of species movements and vulnerability to disturbance. This approach can be applied easily to assessing habitat connectivity in any fragmented or patchy landscape.
Climate change meets habitat fragmentation: Linking landscape and biogeographical scale levels in research and conservation
DOI:10.1016/j.biocon.2003.12.008 URL [本文引用: 1]
Ecological mechanisms of ecosystem services
生态系统服务的生态学机制研究进展
Maximum entropy modeling of species geographic distributions
DOI:10.1016/j.ecolmodel.2005.03.026 URL [本文引用: 1]
Global biodiversity scenarios for the year 2100
DOI:10.1126/science.287.5459.1770
PMID:10710299
[本文引用: 1]
Scenarios of changes in biodiversity for the year 2100 can now be developed based on scenarios of changes in atmospheric carbon dioxide, climate, vegetation, and land use and the known sensitivity of biodiversity to these changes. This study identified a ranking of the importance of drivers of change, a ranking of the biomes with respect to expected changes, and the major sources of uncertainties. For terrestrial ecosystems, land-use change probably will have the largest effect, followed by climate change, nitrogen deposition, biotic exchange, and elevated carbon dioxide concentration. For freshwater ecosystems, biotic exchange is much more important. Mediterranean climate and grassland ecosystems likely will experience the greatest proportional change in biodiversity because of the substantial influence of all drivers of biodiversity change. Northern temperate ecosystems are estimated to experience the least biodiversity change because major land-use change has already occurred. Plausible changes in biodiversity in other biomes depend on interactions among the causes of biodiversity change. These interactions represent one of the largest uncertainties in projections of future biodiversity change.
Network analysis to assess landscape connectivity trends: Application to European forests (1990-2000)
DOI:10.1016/j.ecolind.2010.06.011 URL [本文引用: 1]
Estimating optimal complexity for ecological niche models: A Jackknife approach for species with small sample sizes
DOI:10.1016/j.ecolmodel.2013.08.011 URL [本文引用: 1]
Vulnerability of African mammals to anthropogenic climate change under conservative land transformation assumptions
DOI:10.1111/gcb.2006.12.issue-3 URL [本文引用: 1]
Impact of land use change on bird habitat connectivity: A case study in Ezhou City
土地利用变化对鸟类栖息地连通性的影响——以鄂州市为例
Evolution and simulation of ecosystem patterns in Guangdong-Hong Kong-Macau Bay Area
粤港澳大湾区生态系统格局变化与模拟
Meta-analysis reveals the importance of matrix composition for animals in fragmented habitat
DOI:10.1111/j.1466-8238.2010.00586.x URL [本文引用: 1]
Impact of urbanization on avian diversity in different landscapes in Xi’an City
城市化对西安市不同景观鸟类多样性的影响
Changes and driving forces of Anatidae’s potential habitat connectivity in Beijing-Tianjin- Hebei region from 1980 to 2015
1980-2015年京津冀地区雁鸭类潜在栖息地连接度变化及驱动因素
MaxEnt modeling for predicting the potential distribution of medicinal plant, Justicia adhatoda L. in Lesser Himalayan foothills
DOI:10.1016/j.ecoleng.2012.12.004 URL [本文引用: 1]
Predicting potential distribution of Tibetan spruce (Picea smithiana) in Qomolangma (Mount Everest) National Nature Preserve using maximum entropy niche-based model
DOI:10.1007/s11769-011-0483-z URL [本文引用: 1]
MaxEnt modeling for predicting the potential geographical distribution of two peony species under climate change
DOI:10.1016/j.scitotenv.2018.04.112 URL [本文引用: 1]
An ecophysiological perspective on likely giant panda habitat responses to climate change
DOI:10.1111/gcb.14022
PMID:29251797
[本文引用: 1]
Threatened and endangered species are more vulnerable to climate change due to small population and specific geographical distribution. Therefore, identifying and incorporating the biological processes underlying a species' adaptation to its environment are important for determining whether they can persist in situ. Correlative models are widely used to predict species' distribution changes, but generally fail to capture the buffering capacity of organisms. Giant pandas (Ailuropoda melanoleuca) live in topographically complex mountains and are known to avoid heat stress. Although many studies have found that climate change will lead to severe habitat loss and threaten previous conservation efforts, the mechanisms underlying panda's responses to climate change have not been explored. Here, we present a case study in Daxiangling Mountains, one of the six Mountain Systems that giant panda distributes. We used a mechanistic model, Niche Mapper, to explore what are likely panda habitat response to climate change taking physiological, behavioral and ecological responses into account, through which we map panda's climatic suitable activity area (SAA) for the first time. We combined SAA with bamboo forest distribution to yield highly suitable habitat (HSH) and seasonal suitable habitat (SSH), and their temporal dynamics under climate change were predicted. In general, SAA in the hottest month (July) would reduce 11.7%-52.2% by 2070, which is more moderate than predicted bamboo habitat loss (45.6%-86.9%). Limited by the availability of bamboo and forest, panda's suitable habitat loss increases, and only 15.5%-68.8% of current HSH would remain in 2070. Our method of mechanistic modeling can help to distinguish whether habitat loss is caused by thermal environmental deterioration or food loss under climate change. Furthermore, mechanistic models can produce robust predictions by incorporating ecophysiological feedbacks and minimizing extrapolation into novel environments. We suggest that a mechanistic approach should be incorporated into distribution predictions and conservation planning.© 2017 John Wiley & Sons Ltd.
Habitat suitability assessment of shorebirds in Bohai Bay coast using MaxEnt model
基于MaxEnt模型的渤海湾沿岸鸻鹬类栖息地适宜性评价
Avian community structure of urban parks in developed and new growth areas: A landscape-scale study in Southeast Asia
DOI:10.1016/j.landurbplan.2012.08.004 URL [本文引用: 1]
