


人类对自然生态系统的干扰造成了环境污染、生境丧失和破碎化、外来种入侵等问题, 严重影响生物生存。生物多样性快速丧失已成为全球性的问题(Dirzo et al, 2014; Lewis et al, 2015; Ceballos et al, 2017)。识别和预测生物多样性的时空变化是一项重大的科学挑战, 评价生物多样性的时空格局需要能够捕捉群落和生态系统动态及复杂性的监测和分析方法(Marrugan & Dornelas, 2010)。近期, 红外相机、环境DNA和被动声学监测等技术被广泛用于生物多样性监测(Turner et al, 2003; Gasc et al, 2013; Feng et al, 2021)。被动声学监测技术是通过可编程的自动录音设备采集环境中的声信号, 景观中全部声信号的总和称为声景。根据声信号的来源, 声景可由生物声(biophony)、地理声(geophony)和人为声(anthrophony)组成(Pijanowski et al, 2011)。与传统的监测方法相比, 被动声学监测技术具有成本低、非侵入性和劳动强度低等特点, 相比于红外相机则是提升了对鸟类、昆虫和稀有物种的监测(Doser et al, 2020; Rumelt et al, 2021)。因此, 声景已成为揭示自然环境、生物多样性和人类活动之间相互作用关系的重要资源(赵莹等, 2020)。
声景生态学关注的重点通常不是单个物种, 而是通过声音的频域和时域特征反映环境的性质或生物多样性的变化(Sueur et al, 2014)。基于“较高的物种丰富度可转化为较高的声学复杂性”的假设, 目前声景生态学中已有60余种声学指数用于评估声景或动物群落的多样性或复杂度(Buxton et al, 2018)。例如, 声音复杂度指数(acoustic complexity index, ACI)与鸟类发声活动存在显著相关性, 具有综合和有效描述鸟类群落动态的能力(Pieretti et al, 2011; Shamon et al, 2021)。声景中各类声源发出的声音以不同的频率呈现。例如, 某些昆虫以12 kHz高频发出信号, 而一些鸣禽以4-8 kHz的较低频率发出信号, 人声、汽车声等以1 kHz以下的频率出现。功率谱密度(power spectral density, PSD)被用来表示每单位频段的功率贡献(Gage et al, 2017), Doser等(2020)研究发现热带森林采伐干扰导致2-9 kHz上7个单位频段的PSD表现出不同模式, 推断伐木后研究地点的主要鸟类物种发生了变化。
受生物生命周期、活动节律和环境的影响, 生物发声活动表现出特定的时间特征(Saunders, 1947; Krebs & Kacelnik, 1983)。因此, 声景也具有典型的时间格局, 已经在热带雨林、温带森林和海洋等生态系统中发现声景表现出日、月或旱雨季等周期性的变化特征。例如, 在非洲热带雨林景观中, 雨季昆虫(主要是蝉科)和灵长类动物活动增加使得雨季的声音饱和度高于旱季(Zwerts et al, 2022)。在温带地区, 鸟类晨昏和鸣使得声音多样性指数(acoustic diversity index, ADI)具有明显的双峰模式(Villanueva- Rivera et al, 2011)。海洋生态系统中, 座头鲸(Megaptera novaeangliae)主要在夜晚发声, 使得夜晚的声压级明显比白天高(Au et al, 2000)。
候鸟迁徙是鸟类对环境因素周期性变化的一种适应性行为。气候的季节性变化是候鸟迁徙的重要原因之一, 候鸟夏季在纬度较高的地区繁殖, 冬季则在纬度较低的地区过冬, 夏末秋初由繁殖地往南迁移到越冬地, 而在春季由越冬地向北返回到繁殖地。虽然候鸟的到达和离开容易观测到, 但大规模的迁徙给候鸟物种多样性和迁徙规律的调查带来挑战。被动声学监测技术能克服弱光环境和寒冷天气开展监测工作的困难, 已成为追踪鸟类迁徙的重要手段(Buxton et al, 2016)。通过声学监测到的北美五大湖地区候鸟迁徙活动峰值与雾网(mist netting)监测峰值基本一致, 声学记录准确地量化了鸟类迁徙强度(Sanders & Mennill, 2014)。有研究者用自动信号处理和机器学习方法估计了鸣禽群落到达北极繁殖地的时间, 声学估计的日期与传统调查确定的日期一致(Oliver et al, 2018)。还有研究发现黄喉蜂虎(Merops apiaster)和杜氏百灵(Chersophilus duponti)的种群数量与发声活动率指数(vocal activity rate index, VAR)存在显著的正相关, 说明发声活动率指数可用于推断鸟类数量(Pérez-Granados et al, 2019)。
图们江流域下游湿地位于中、俄、朝三国交界处, 分布有河流、沼泽和湖泊等多样的湿地类型, 是南迁越冬候鸟进入中国停留的第一站, 已成为中国候鸟三大迁徙廊道之一(王琪等, 2010)。本研究主要目的是评价鸟类迁徙活动对图们江下游湿地声景时间格局的影响。我们利用被动声学监测技术获得湿地全年的声学数据, 通过计算声学指数和功率谱密度定量分析湿地声景的月变化和日变化规律, 揭示不同时间主导声景的主要动物类群, 探讨声学指数能否准确反映鸟类迁徙时间和规模, 以期为图们江下游湿地候鸟对气候变化的响应和保护提供科学依据。
1 研究方法
1.1 研究区概况
敬信湿地(42°26′-42°42′ N, 130°24′-130°39′ E)是图们江下游的典型湿地, 位于吉林省珲春市敬信镇, 是我国距日本海最近的区域, 最近处仅约10 km (图1)。湿地东部与俄罗斯滨海边疆区接壤, 南部隔图们江与朝鲜庆兴郡、雄基郡相望。受日本海影响, 敬信湿地春秋季多风, 气候温和潮湿, 属中温带近海性季风气候区, 年平均气温为5.6℃, 年均降水量为823.7 mm。春季为全年多日照季节, 其中3月日照量最高, 达237 h, 为早春迁至的湿地水鸟提供了适宜的热量条件(杨兴家和金玄善, 2000)。湿地总面积超过80 km2, 最低海拔高度5 m, 主要包括湖泊、草本沼泽、灌丛和森林沼泽等。受人类干扰影响, 超过80%的自然湿地已变成水田、旱田和池塘等(Zheng et al, 2017), 许多水鸟会利用这些生境觅食(吴景才等, 2018)。早期调查显示图们江下游共计有湿地水鸟9目12科56种(傅桐生等, 1981), 其中夏候鸟30种, 旅鸟26种, 区系组成以中古北界为主, 占水鸟总数的75.0%, 其次为广布种和东洋界鸟类, 分别占21.4%和3.5%。敬信湿地被誉为候鸟的“五星级驿站”, 是鸟类北归和南迁的中间停歇地, 每年春季开始有大量候鸟到此停留和觅食, 包括豆雁(Anser fabalis)、白额雁(A. albifrons)、绿头鸭(Anas platyrhynchos)、针尾鸭(A. acuta)、斑嘴鸭(A. zonorhyncha)、普通秋沙鸭(Mergus merganser)、虎头海雕(Haliaeetus pelagicus)、白尾海雕(H. albicilla)、丹顶鹤(Grus japonensis)等, 以鸭科雁鸭类候鸟的数量最多, 形成“鸟风暴” (杨兴家和金玄善, 2000; 杨桄等, 2006)。
图1
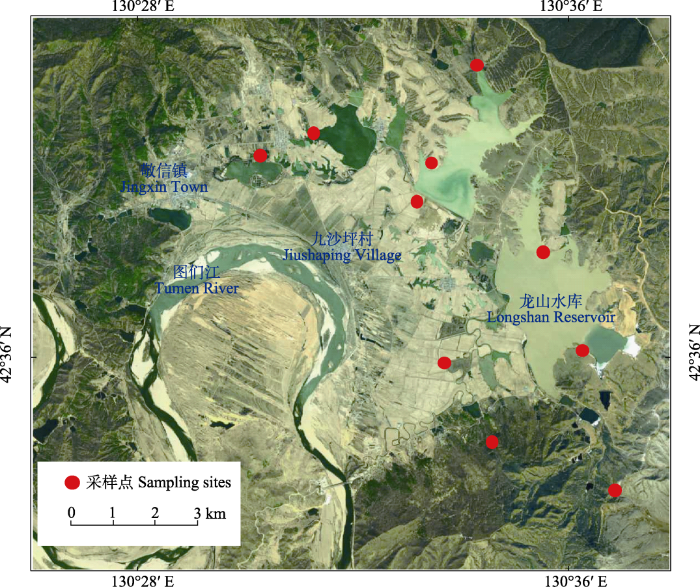
图1
图们江下游研究区域位置图及10个声学记录采样点
Fig. 1
Map of the study area in downstream of the Tumen River Basin of China showing the 10 sites where audio recordings were collected
1.2 采样与预处理
本研究在敬信湿地设置10个声音采样点(图1), 涵盖农田、湖泊、森林沼泽等鸟类重要栖息地和觅食点, 每个样点放置1台Song Meter Mini自动录音设备(Wildlife Acoustics Inc., Maynard, MA, USA)。为避免设备丢失或损坏, 录音设备放置在铁盒内并固定在距地面约1.8 m的树干上。每台设备配备1个全向麦克风, 采样率为44.1 kHz (16 bits), 音频格式为WAV (Francomano et al, 2020; Barbaro et al, 2022)。采样周期为2020年11月26日至2021年12月13日, 设置每天的整点开始连续录制5 min, 休眠25 min (Lin et al, 2017; Bradfer-Lawrence et al, 2019)。由于电量不足、设备故障而损坏或未满5 min的音频被删除。风和雨在整个频谱范围内对声学指数和功率谱密度的计算有影响, 并对动物发声活动有掩盖效应, 最大影响在1-2 kHz范围内(Bedoya et al, 2017; Lin et al, 2017; Doser et al, 2020)。本研究在Raven Pro 1.6.1程序中, 通过人工听音频和预览音频频谱图, 识别1,000条含有风雨的音频作为训练样本, 并随机选择1,000条音频作为测试样本, 然后利用R软件程序包hardRain提取训练样本特征, 确定风雨声信号的最小值和第二四分位阈值矩阵(Metcalf et al, 2020) (附录1)。我们根据测试样本判别结果, 选择准确度更高的风雨声信号阈值对全部音频进行筛选, 筛除含有风雨的音频, 最终获得不含风雨的有效音频。
1.3 声学指数的计算
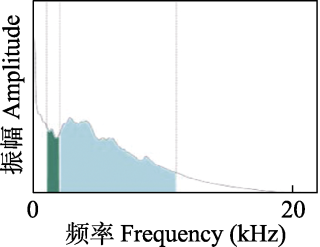
每个声学指数反映了声景的不同时间特征, 相较于单一声学指数, 多个声学指数联合使用可以更好地反映声景格局。本研究使用了4种常用的声学指数: 声音复杂度指数(ACI)、生物声学指数(bioacoustic index, BIO)、声音均匀度指数(acoustic evenness index, AEI)和标准化声景差异指数(normalized difference soundscape index, NDSI) (表1)。ACI主要用于描述声强的变异性, 例如高强度的鸟类声信号会使得ACI升高, 而持续性的昆虫声信号会使ACI降低; BIO代表2-11 kHz范围内的生物声信号强度, 生物声信号丰富则BIO高; AEI表示声信号强度在不同频段的均匀度, 多个频段被占用的饱和声景AEI低; NDSI是1-2 kHz和2-11 kHz频段声信号功率的比率, 当声信号主要占据1-2 kHz频段时, 会出现低于0的值(图2)。为进一步评价图们江下游湿地声景中不同频段的功率如何随着时间变化, 我们利用Welch法计算了1-11 kHz频段的功率谱密度(PSD)。功率谱密度是指将声音划分为单位频段, 并计算每个频段中的能量来获得声能的分布。我们从每条音频得到10个PSD值, 代表每个1 kHz频段的功率量, 把每个PSD值称为PSDi, 它代表了i到(i + 1) kHz频段的功率谱密度(例如, PSD1代表1-2 kHz频段的PSD值) (Welch, 1967; Gage et al, 2017)。4种声学指数和功率谱密度分别用R软件程序包soundecology、tuneR和seewave计算(Doser et al, 2020), 其中ACI计算中的时间窗设置为10 s, BIO的计算频率设置为2-11 kHz, AEI的最大频率设置为22 kHz, 频率步长为1 kHz, 其余参数采用默认值。
表1 4种声学指数的定义和属性
Table 1
| 示意图 Schematic diagram | 声学指数 Acoustic indices | 声景格局 Soundscape pattern | 参考文献 References |
|---|---|---|---|
时频图 Spectrogram 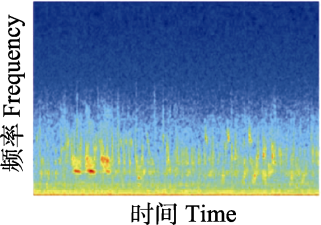 | 声音复杂度指数(ACI): 音频中相邻时间窗声强的变异性, 值的范围 > 0。Quantifies the sound complexity for estimating the variability of the intensities between time samples within a frequency band. Range = [0, +]. | 高值代表高水平的鸟类活动; 低值代表持续性的昆虫噪音。High values represent higher levels of bird activity, while low values represent consistent insect noise. | Pieretti et al, 2011 |
频谱图 Spectrum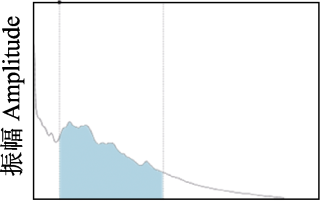 | 生物声学指数(BIO): 声谱图中2-11 kHz范围内超过分贝阈值部分的面积, 值的范围 > 0。Estimates the area under curve of the mean spectrum above a specific decibel (dB) threshold within 2-11 kHz. Range = [0, +]. | 高值代表生物声丰富, 大量频段被占据, 最高声和最安静频段差异大; 低值代表在2-11 kHz之间很少有声音。High values represent higher levels of biophonic, in which many frequency bands are occupied, and significant disparity between the loudest and quietest bands; low values represent no sound between 2 and 11 kHz. | Boelman et al, 2007 |
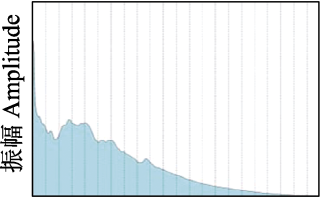 | 声音均匀度指数(AEI): 表示声信号强度在不同频段的均匀度, 计算Gini系数来表示声信号强度在每个1 kHz频段的不均等程度, 值的范围为0-1。Measures the evenness of the acoustic activity distribution estimating the Gini coefficient on the signal proportion in each 1 kHz band. Range = [0, 1]. | 高值代表少数频段由高的声强主导; 低值代表多个频段被占据或者所有频段没有声学活动。High values represent high sound intensity in a restricted range of frequencies; low values represent either high or no acoustic activity across all frequency bins. | Villanueva-Rivera et al, 2011 |
 | 标准化声景差异指数(NDSI): 人造声(1-2 kHz)与生物声(2-11 kHz)频段间声信号功率的比率, 值的范围为-1至1。The ratio of signal power in the frequency bands between anthrophony (1-2 kHz) and biophony (2-11 kHz). Range = [-1, 1]. | 高值代表高水平的生物声, 而低值代表人造声为主。High values represent higher levels of biophonic activity, and minimal noise in 1-2 kHz. | 2012 |
图2
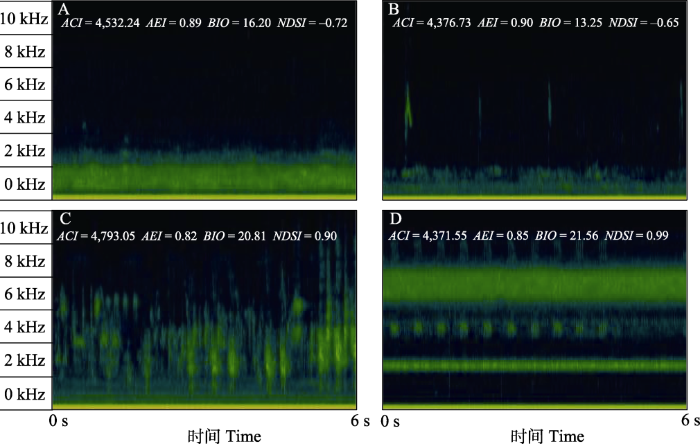
图2
具有不同声学多样性的6秒时频图示例。
A代表只有雁类声信号的声景; B代表雁类和其他鸟类声信号都存在的声景; C代表无雁类声信号, 主要为2-11 kHz频段鸟类声信号的声景; D代表多种昆虫持续性声信号主导的声景。时频图在Kaleidoscope Pro软件(Wildlife Acoustics)中绘制, 使用短时傅里叶变换和Hann窗。
Fig. 2
Examples of 6 s-spectrograms with high and low acoustic diversity.
(A) A soundscape with only wild geese vocal signals; (B) A soundscape with both wild geese and other bird vocal signals; (C) A soundscape devoid of wild geese vocal signals and dominated by bird vocal signals in the 2-11 kHz; (D) A soundscape dominated by multiple insect persistent vocal signals. Spectrograms were drawn with Kaleidoscope Pro software (Wildlife Acoustics), using short-time Fourier transform and Hann window type.
1.4 数据分析
敬信湿地鸟类迁徙活动集中在每年的2-4月和10-11月(杨兴家和吴志刚, 1994; 杨兴家和金玄善, 2000; 吴景才等, 2018)。春末夏初, 蛙类进入繁殖期, 雄蛙会为了求偶发出规律性的鸣叫。另外, 东北地区的蟋蟀、螽斯和蝉等常见鸣虫的鸣叫活动主要集中在温度较高的8-9月①(① 李晓强 (2011) 吉林省蟋蟀总科昆虫分类学研究. 硕士学位论文, 东北师范大学, 长春.)②(② 王雪松 (2016) 东北地区常见螽斯总科昆虫的鸣声研究. 硕士学位论文, 东北林业大学, 哈尔滨.)。因此, 根据候鸟迁徙的时间规律以及蛙类和昆虫的生活史特征, 我们将全年分为迁徙期(2-4月、10-11月)和非迁徙期(5-7月、8-9月和12月至次年1月)共5个时段。考虑到不同季节昼夜长短差异, 为了准确地反映动物发声活动的日变化特征, 利用overlap程序包将所有音频时间转换成当地太阳时(Ridout & Linkie, 2009)。太阳时的日出时间为6:00, 日落时间为18:00, 基于此将一天分为白天(6:00-18:00)和夜晚(18:00至次日6:00)。
利用vegan程序包对迁徙期和非迁徙期的4种声学指数进行非度量多维尺度法(non-metric multidimensional scaling, NMDS)排序, 评价鸟类迁徙活动是否对湿地声景产生了影响, 并利用相似性分析(analysis of similarities, ANOSIM)检验迁徙期和非迁徙期之间声景差异的显著性。为量化5个时段的声景差异性, 对每个采样点各声学指数每月均值进行Kruskal-Wallis检验。通过ggplot2程序包绘制5个时段以及每个时段昼夜的1-10 kHz PSD变化曲线, 分析各时段或昼夜的主要发声频段。为量化声景的昼夜差异, 在5个时段内对每个采样点各声学指数每月的昼夜均值进行Mann-Whitney U检验。通过广义加性模型(generalized additive model, GAM)拟合声学指数值获得月变化和日变化曲线。因电量不足, 有10台自动录音机在2021年2月停止工作, 所以湿地声景的月变化特征分析中2月声学指数的动态变化通过GAM拟合得出, 2-4月声景的日变化特征分析仅为3月和4月的声学数据。所有统计分析在R4.1.3软件中完成, 显著性检验水平为P = 0.05。
2 结果
2.1 鸟类迁徙对声景月变化特征的影响
10台自动录音设备共采集了115,360条时长5 min的音频。根据风雨声信号的第二四分位数阈值共筛选出91,988条有效录音(附录1)。NMDS和ANOSIM分析结果表明, 鸟类迁徙期与非迁徙期声景格局间存在显著差异(stress = 0.002, R = 0.19, P = 0.001) (图3)。ACI、BIO、AEI、NDSI值在全年5个时段间均存在显著差异(所有P < 0.001, 表2)。Kruskal-Wallis检验结果显示迁徙期的NDSI显著低于非迁徙期(P < 0.001) (表2), 而功率谱密度曲线显示迁徙期的PSD1明显高于非迁徙期(图4), 表明迁徙鸟类显著增强了湿地声景中1-2 kHz频段的声信号。
图3
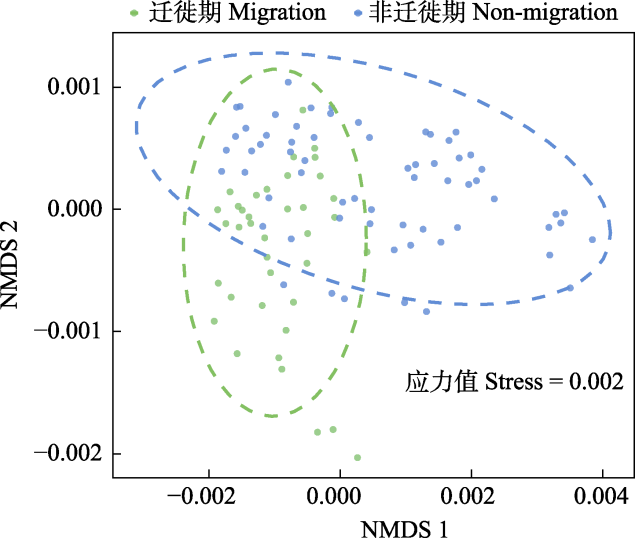
图3
迁徙期和非迁徙期声学指数的非度量多维尺度法(NMDS)排序图
Fig. 3
Non-metric multidimensional scaling (NMDS) ordination of the soundscapes between bird migration and non-migration period
图4
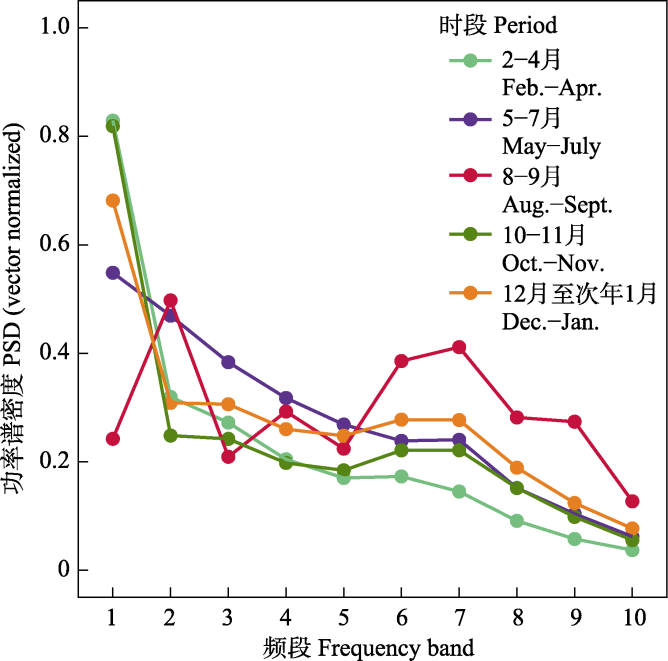
图4
五个时段的功率谱密度(PSD)归一化值。PSDi表示频段i的功率谱密度, 即i到(i + 1) kHz频段的功率谱密度。
Fig. 4
Power spectral density (PSD) levels across different periods. PSDi denotes the power spectral density of band i, i.e., the power spectral density of band i to (i + 1) kHz.
表2 一年中各时段4种声学指数的Kruskal-Wallis检验
Table 2
| 声学指数 Acoustic indices | 2-4月 Feb.-Apr. | 5-7月 May-July | 8-9月 Aug.-Sept. | 10-11月 Oct.-Nov. | 12月至次年1月 Dec.-Jan. | P |
|---|---|---|---|---|---|---|
| 声音复杂度指数 Acoustic complexity index (ACI) | 4,530.52 ± 17.78a | 4,622.86 ± 28.88a | 4,523.64 ± 22.69a | 4,449.51 ± 7.54b | 4,413.08 ± 7.26b | < 0.001 |
| 生物声学指数 Bioacoustic index (BIO) | 10.38 ± 0.48c | 12.22 ± 0.47b | 14.15 ± 0.52a | 8.32 ± 0.19d | 7.15 ± 0.20e | < 0.001 |
| 声音均匀度指数 Acoustic evenness index (AEI) | 0.90 ± 0.01b | 0.83 ± 0.01c | 0.78 ± 0.01d | 0.90 ± 0.01b | 0.92 ± 0.01a | < 0.001 |
| 标准化声景差异指数 Normalized difference soundscape index (NDSI) | -0.04 ± 0.07c | 0.46 ± 0.05b | 0.88 ± 0.01a | 0.10 ± 0.06c | 0.40 ± 0.04b | < 0.001 |
同一行不同小写字母表示差异显著
Different lowercase letters in the same row indicate significant differences (P < 0.05)
图5
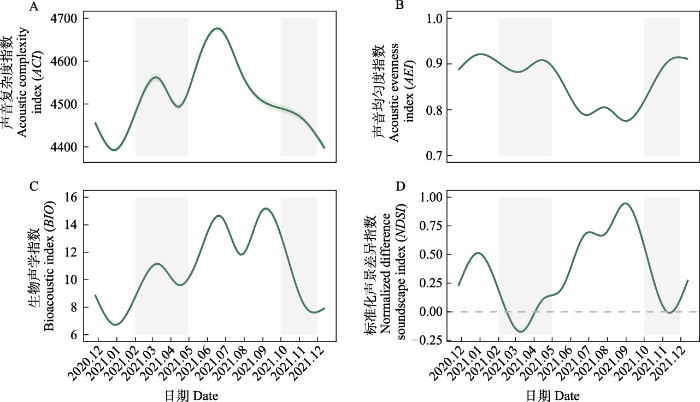
图5
广义加性模型拟合的4种声学指数的年动态变化。
曲线阴影表示95%置信区间。灰色部分代表迁徙期。
Fig. 5
The dynamics of the four acoustic indices throughout the year, with predicted values from generalized additive model (GAM) output for each index.
The shadows represent 95% confidence interval, and gray area indicate bird migration period.
综上, 图们江下游湿地2-9月的发声动物种类最多、发声强度最强。受到鸟类迁徙活动的影响, 迁徙期的湿地声景以1-2 kHz频段的雁类声信号为主。非迁徙期的湿地声景主要受到本地鸟类、蛙类和昆虫生活史的影响, 其中, 5-7月主要为鸟类快速频率调制的重复短暂声音和蛙类声信号, 8-9月主要为种类丰富的昆虫鸣叫的持续性信号, 12月至翌年1月, 声景较为安静, 偶尔有少量本地鸟类声信号出现。
2.2 鸟类迁徙对声景日变化特征的影响
2.2.1 迁徙期声景的日变化特征
图6
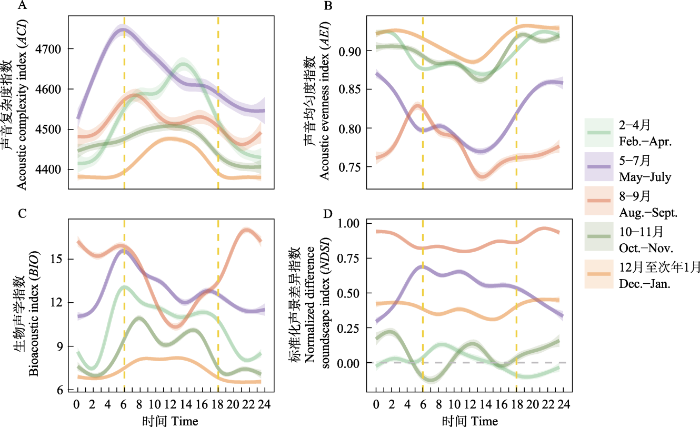
图6
广义加性模型拟合的4种声学指数的日变化。
曲线阴影表示95%置信区间, 黄色虚线代表日出(6:00)和日落(18:00)时间。
Fig. 6
Diel patterns of four acoustic indices, with predicted values from generalized additive model (GAM) output for each period.
The shadows represent 95% confidence intervals, and dashed vertical lines indicate sunrise (6:00) and sunset (18:00) time.
2-4月候鸟停歇期间, ACI呈单峰曲线, 峰值出现在14:00前后, 此时AEI也降到最低(图6A、B), BIO在6:00日出前后出现峰值(图6C), NDSI在8:00后持续下降, 14:00前后降至0 (图6D)。以上结果表明日出时鸟类发声活动增强, 2-11 kHz生物声信号最多, 频段间均匀度增加, 存在鸟类和鸣现象, 但在日出后2-11 kHz频段生物声信号逐渐减少, 除雁类外的其他鸟类发声强度降低, 而雁类发声活动不断增强。PSD3-4和PSD6-7在白天升高(附录2), 表明除雁类声信号外, 声景中鸟类声信号主要出现在3- 5 kHz和6-8 kHz频段。10-11月候鸟南迁停歇期间, BIO在8:00和16:00前后出现两个高峰(图6C), NDSI在此时出现两个低谷(图6D), 表明雁类在晨昏存在发声活动高峰。综上, 迁徙期湿地声景由1-2 kHz 的雁类声信号主导, 发声活动集中在白天, 并且存在鸟类和鸣现象。
2.2.2 非迁徙期声景的日变化特征
表3 4种声学指数昼夜差异的Mann-Whitney U检验
Table 3
| 声学指数 Acoustic indices | 时段 Period | 白天 Day | 夜晚 Night | W | P |
|---|---|---|---|---|---|
| 声音复杂度指数 Acoustic complexity index (ACI) | 2-4月 Feb.-Apr. | 4,612.30 ± 25.94a | 4,460.47 ± 12.26b | 368 | < 0.001 |
| 5-7月 May-July | 4,656.94 ± 37.25a | 4,596.90 ± 24.96a | 446 | 0.38 | |
| 8-9月 Aug.-Sept. | 4,554.53 ± 37.00a | 4,494.61 ± 15.23a | 163 | 0.20 | |
| 10-11月 Oct.-Nov. | 4,484.44 ± 8.30a | 4,417.02 ± 8.51b | 291 | < 0.001 | |
| 12月至次年1月 Dec.-Jan. | 4,443.98 ± 8.55a | 4,383.45 ± 6.25b | 366 | < 0.001 | |
| 生物声学指数 Bioacoustic index (BIO) | 2-4月 Feb.-Apr. | 11.71 ± 0.52a | 9.22 ± 0.49b | 317 | < 0.001 |
| 5-7月 May-July | 12.85 ± 0.48a | 11.65 ± 0.50a | 497 | 0.09 | |
| 8-9月 Aug.-Sept. | 12.88 ± 0.60b | 15.41 ± 0.49a | 57 | < 0.01 | |
| 10-11月 Oct.-Nov. | 9.47 ± 0.24a | 7.25 ± 0.20b | 308 | < 0.001 | |
| 12月至次年1月 Dec.-Jan. | 7.66 ± 0.22a | 6.67 ± 0.19b | 306 | < 0.01 | |
| 声音均匀度指数 Acoustic evenness index (AEI) | 2-4月 Feb.-Apr. | 0.95 ± 0.06a | 0.68 ± 0.06b | 71 | < 0.001 |
| 5-7月 May-July | 0.81 ± 0.01b | 0.83 ± 0.01a | 218 | < 0.01 | |
| 8-9月 Aug.-Sept. | 0.78 ± 0.01a | 0.79 ± 0.02a | 117 | 0.70 | |
| 10-11月 Oct.-Nov. | 0.88 ± 0.01b | 0.92 ± 0.01a | 63 | < 0.01 | |
| 12月至次年1月 Dec.-Jan. | 0.91 ± 0.01b | 0.93 ± 0.01a | 73 | < 0.001 | |
| 标准化声景差异指数 Normalized difference soundscape index (NDSI) | 2-4月 Feb.-Apr. | 0.00 ± 0.07a | -0.09 ± 0.08a | 228 | 0.58 |
| 5-7月 May-July | 0.52 ± 0.05a | 0.40 ± 0.05a | 482 | 0.14 | |
| 8-9月 Aug.-Sept. | 0.85 ± 0.02a | 0.90 ± 0.01a | 79 | 0.07 | |
| 10-11月 Oct.-Nov. | 0.03 ± 0.07a | 0.16 ± 0.07a | 127 | 0.28 | |
| 12月至次年1月 Dec.-Jan. | 0.35 ± 0.05a | 0.44 ± 0.03a | 148 | 0.17 |
同一行不同小写字母表示差异显著, 加粗为差异显著的P值
Different lowercase letters in the same row indicate significant differences, where P values are bolded (P < 0.05)
3 讨论
3.1 声景的时间格局和鸟类迁徙的影响
声学指数的动态变化主要由鸟类和昆虫的声学活动变化驱动, 另外也经常受哺乳动物、两栖动物和爬行动物的影响(Diepstraten & Willie, 2021; Opaev et al, 2021)。本研究通过计算声学指数和功率谱密度, 对图们江下游湿地声景的时间格局进行了综合评价, 发现研究区声景主要受候鸟迁徙和蛙类、昆虫鸣叫的影响, 表现出不同的月变化和日变化规律。图们江下游湿地作为鸟类迁徙活动中的重要停歇地, 每年春季大量鸭科的雁鸭类迁徙至此, 不仅数量大而且种类多, 优势种包括豆雁、白额雁、绿头鸭、针尾鸭、斑嘴鸭和普通秋沙鸭等, 其他稀有种包括虎头海雕、白尾海雕、丹顶鹤、东方白鹳(Ciconia boyciana)等。雁类通常停歇时间较短, 约3-5天, 鸭类相对停歇时间较长, 大约10天, 4月中下旬雁鸭类群体陆续离开(杨兴家和吴志刚, 1994)。几个声学指数反映了这一迁徙变化过程, 春季随着候鸟的到来ACI和BIO逐渐升高, 在3月上旬达到一个小的峰值, 随着鸟类陆续离开这两个指数逐渐下降(图5)。然而, NDSI值呈现相反的趋势, 并在鸟类迁徙高峰期达到全年最低值, 这是因为根据声谱图(图2), 雁类的发声频段主要在1-2 kHz, 表明春季鸟类迁徙停歇期研究区的声景主要由雁类低频声信号主导, 功率谱密度变化曲线也证实了这一点, 此时1-2 kHz频段的功率谱密度最高(图4)。每年春季先后有数十万只雁类在敬信湿地农田、草丛、湖泊中停歇, 此时它们进入发情期, 将更多能量投入到求偶鸣唱活动, 特别是白天发声强度最大。Buxton等(2016)在美国阿拉斯加的研究也发现, 当候鸟从越冬地返回并开始繁殖时有一个明显的春季声学活动峰值。
5-7月, 随着雁类群的离开, 对其他声信号的掩盖效应(mask effect)降低。同时, 由于温度升高、食物资源丰富、发情和繁殖增加了鸣唱投入等原因使得声景中2-11 kHz夏候鸟和本地留鸟声信号以及2-3 kHz蛙类夜间声信号快速增加, ACI和BIO值在6月中旬达到峰值, AEI值下降。表明此时发声物种丰富度高, 发声强度在一天中变化较小。根据野外观测这一时期鸟类优势种包括绿翅鸭(Anas crecca)、赤颈鸭(A. penelope)、罗纹鸭(A. falcata)、凤头潜鸭(Aythya fuligula)、红嘴鸥(Larus ridibundus)、苍鹭(Ardea cinerea)等近20种。8-9月, 随着气温升高, 蟋蟀等大量昆虫开始鸣叫, 夜晚高频声显著增多, 导致BIO和NDSI快速升高, 峰值出现在9月前后, 并达到全年最高, 同时AEI达到全年最低。声学通讯是昆虫通讯交流的主要方式之一, 昆虫鸣声受光照、温湿度、风速等多种环境因素的影响(谢令德, 2001)。昆虫白天发声较少可能与这一时段白天温度高和光照强有关。10-11月雁类群等从北向南再次来到敬信湿地停歇觅食以补充能量, 此时雁类等迁徙鸟类无繁殖需求, 鸣唱投入减少, 发声活动仅存在晨昏高峰, 但雁类的到来又一次导致声景以低频音为主, NDSI和1-2 kHz频段的功率谱密度变化显著反映了这一过程。但与春季不同的是ACI和BIO并没有出现明显的峰值, 这可能是因为受食物和气温等因素限制秋季鸟类种群数量波动较小, 不同种鸟类到达及离开图们江流域的时间各不相同, 表明不同季节鸟类迁徙模式存在差异。12月至翌年1月大部分南迁候鸟已经离开, 鸟类丰富度降低、环境温度低和食物资源少等原因使得鸟类等动物发声活动显著减少。
受动物活动节律、潮汐规律、昼夜和季节变化等因素的影响, 声景在多种生境中均表现出典型的日节律、月节律或者季节节律等周期性特征。海洋生态系统中对珊瑚礁声景的研究发现, ACI在不同岛礁均表现出明显的每月1次高峰或者每日1次高峰的周期性特征(Staaterman et al, 2014)。在城市生态系统中声景的时间节律受到人类活动严重影响, 表现为复杂的时空特征(Liu et al, 2013)。Pijanowski等(2011)对美国印第安纳州天然林、次生林、农场、果园、城郊等生境的研究发现, 声景的多样性峰值出现在以鸟类和昆虫发声为主的夏末(8-9月), 除了农场外, 其他所有土地利用都有明显的7:00和22:00的高峰, 且夜间峰值是中午峰值的2倍。本研究中的图们江下游湿地声景也表现出24 h的周期性节律, 不同时段都有指数呈现明显的日变化, 但峰值出现的时间高度异质(图6)。另外, 本文的结果显示图们江下游湿地声景并未呈现明显的春夏秋冬四季分明的变化特征。被动声学监测中, 采样间隔越小覆盖的时间越精细, 通过声学指数反映出的声景时间动态越准确。若按季节连续录音的采样方式会丢失因季节交替、生物物候变化等表现出的声景特征。例如, 本研究区夏季(6-8月)在6-7月表现为鸟类发声为主, 8月表现为昆虫发声为主, 这将使得在夏季连续录制的声学数据无法反映出季节内主要发声物种的变化。因此, 研究声景时间格局时, 建议综合考虑研究区域物候和生物发声规律采集声学数据, 并在生物或生态意义明确的时间尺度上分析声景的变化(Metcalf et al, 2021)。
3.2 多声学指数应用的重要性
尽管所有声学指数都是根据声信号的时域和频域复杂性来评估生物发声活动的变化, 但是, 不同声学指数评估发声强度的角度不同, 并且单一指数的某一高值或者低值往往会存在不同解释。例如, 本研究中8-9月的AEI保持在低值, 可能是因为8-9月声景中多个频段被占据, 声景饱和度高, 也可能是因为8-9月湿地环境很安静, 几乎没有声信号。但是, 此时的NDSI和BIO都很高, 说明AEI的低值代表声音丰富、声景均匀度高。根据4个声学指数和PSD结果, 我们推断图们江下游湿地8-9月声景以多种昆虫夜间发声活动为主。所以, 相较于任何一个单一指数, 多个指数的联合使用可以更好地反映声景变化。Eldridge等(2018)在温带地区观察到声学指数和鸟类物种丰富度之间存在高达65%的显著相关性, 并且发现复合指数比任何单一指数都能更有效地预测鸟类物种丰富度。因此, 复合声学指数可以进行高效的生物多样性监测。
另外, 研究声景的时间格局能够通过多声学指数了解动物类群的求偶繁殖、觅食和迁徙等生活史特征。Favaro等(2021)用声音熵指数(acoustic entropy index, H)估计了斑嘴环企鹅(Spheniscus demersus)觅食归来发出声信号的相对数量, 从而确定了斑嘴环企鹅的觅食效率以及食物可获得性。本研究发现声学指数能够反映鸟类的迁徙活动, 例如ACI和BIO在雁类春季迁徙中更加敏感, 未来可进一步评估监测春季雁类迁徙的可靠性。本研究还发现雁类主要发出1-2 kHz频段的声信号, 导致春秋两个迁徙期的PSD1和NDSI均表现出与其他时段的显著差异, 说明这两个指数能够较好地反映雁类迁徙活动, 未来可以作为评估和预测雁类迁徙规模和时间的有效指数, 并且可以在全球范围内研究雁类迁徙对气候变化的响应。
以往研究中NDSI常被用于评估环境中人类活动的干扰水平, 较低的NDSI代表人类活动强度高(Kasten et al, 2012)。在意大利的研究发现, 存在交通噪声的城市公园NDSI均低于0, 灌木生境NDSI接近于1 (Benocci et al, 2020, 2021)。还有研究发现NDSI与生境质量之间存在显著的正相关关系, 在景观破碎化严重、人类干扰强的地区生物声音少, NDSI表现为较低值(Fuller et al, 2015)。但是, 因为雁类主要在1-2 kHz发出低频声信号, 并且迁徙期在图们江下游湿地停歇的雁类数量多、发声活动强, 对人类活动噪声的掩蔽效应高。所以, 在本研究中NDSI用来表征雁类的发声强度而不是用来评估人类活动的干扰水平。因此, 我们建议应用声学指数描述区域声景时, 应综合考虑声学指数的计算方法与原理、声景的主要影响因素和研究区生物发声的基本特征等, 对声学指数动态反映出的声景特征进行可靠的生态学推断。
多声学指数的应用反映了区域发声活动复杂度和强度的动态, 结果显示本研究区内5-7月的鸟类发声活动最强, 但我们无法通过声学指数准确推测这一时期发声鸟类的种类和数量等特征。目前已经能够通过机器学习原理开发自动信号识别软件实现大量声学数据的训练和分类。基于Twine-pat函数的k近邻法(k-nearest neighbor, kNN)模型对鸟类和无尾目动物声音分类的准确率高达98.75% (Akbal et al, 2022)。声学多样性的多分辨率分析(multiresolution analysis of acoustic diversity, MAAD)通过短时傅里叶变换识别生物信号后, 对信号特征的聚类分析结果与人工分类结果高度一致, 并且比人工分类的速度快40倍(Ulloa et al, 2018)。本研究中鹤类、鹭类等鸟类鸣叫的主频也低于2 kHz, 尽管种群数量少, 但也对湿地声景产生了影响, 未来的工作需要建立主要发声物种声谱图, 并应用人工智能和机器学习等手段建立发声活动与物种种类和密度的关系, 实现对发声物种动态精确监测的同时, 量化不同动物类群(包括不同鸟类)对声景的贡献(Silva et al, 2022)。
附录 Supplementary Material
附录1 采用最小阈值和第二四分位阈值对1,000条声音数据样本训练结果的混淆矩阵
Appendix 1 Confusion matrices with 1,000 samples of training data using minimum threshold values and second quartile threshold values
附录2 一年不同时间段日功率谱密度
Appendix 2 Daily power spectral density levels for different periods
致谢
衷心感谢两位匿名审稿专家及编委对本文提出的宝贵意见和建议。
参考文献
An automated multispecies bioacoustics sound classification method based on a nonlinear pattern: Twine-pat
Seasonal and diurnal trends of chorusing humpback whales wintering in waters off western Maui
DOI:10.1111/j.1748-7692.2000.tb00949.x URL [本文引用: 1]
Linking acoustic diversity to compositional and configurational heterogeneity in mosaic landscapes
DOI:10.1007/s10980-021-01391-8 URL [本文引用: 1]
Automatic identification of rainfall in acoustic recordings
DOI:10.1016/j.ecolind.2016.12.018 URL [本文引用: 1]
Eco-acoustic indices to evaluate soundscape degradation due to human intrusion
DOI:10.3390/su122410455 URL [本文引用: 1]
Eco-acoustic assessment of an urban park by statistical analysis
DOI:10.3390/su13147857 URL [本文引用: 1]
Multi-trophic invasion resistance in Hawaii: Bioacoustics, field surveys, and airborne remote sensing
DOI:10.1890/07-0004.1 URL [本文引用: 1]
Guidelines for the use of acoustic indices in environmental research
DOI:10.1111/2041-210X.13254
[本文引用: 1]

Ecoacoustics, the study of environmental sound, is a growing field with great potential for biodiversity monitoring. Audio recordings could provide a rapid, cost-effective monitoring tool offering novel insights into ecosystem dynamics. More than 60 acoustic indices have been developed to date, which reflect distinct attributes of the soundscape, (i.e. the total acoustic energy at a given location, including noise produced by animals, machinery, wind and rain). However, reported patterns in acoustic indices have been contradictory, possibly because there is no accepted best practice for the collection and analysis of audio recordings. Here, we propose: (a) guidelines for designing studies using audio recordings for the rapid assessment of multiple sites; and (b) a workflow for comparing recordings with seven of the most commonly used indices, permitting discrimination among habitat-specific soundscapes. We collected and analysed over 26,000 hr of recordings from 117 sites across a range of habitats in a human-modified tropical landscape in central Panama; an order of magnitude more recordings than used in previously published studies. We demonstrate that: (a) Standard error variance of indices stabilizes within 120 hr of recordings from a single location. (b) Continuous recording should be used rather than subsample recording on a schedule; sub sampling is a common practice but delays capture of site variability and maximizing total duration of recording should be prioritized. (c) Use of multiple indices to describe soundscape patterns reveals distinct diel and seasonal soundscape patterns among habitats. We advocate collecting at least 120 hr of continuous recordings per site, and using a range of acoustic indices to categorize the soundscape, including the Acoustic Complexity Index, Acoustic Evenness Index, Acoustic Entropy Index and the Normalized Difference Soundscape Index. Differences among habitat types can be captured if multiple indices are used, and magnitude of variance is often more important than mean values. The workflow we provide will enable successful use of ecoacoustic techniques for environmental monitoring.
Using bioacoustics to examine shifts in songbird phenology
DOI:10.1002/ece3.2242
PMID:27547306
[本文引用: 2]
Monitoring patterns in biodiversity and phenology have become increasingly important given accelerating levels of anthropogenic change. Long-term monitoring programs have reported earlier occurrence of spring activity, reflecting species response to climate change. Although tracking shifts in spring migration represents a valuable approach to monitoring community-level consequences of climate change, robust long-term observations are challenging and costly. Audio recordings and metrics of bioacoustic activity could provide an effective method for monitoring changes in songbird activity and broader biotic interactions. We used 3 years of spring and fall recordings at six sites in Glacier Bay National Park, Alaska, an area experiencing rapid warming and glacial retreat, to examine the utility of bioacoustics to detect changes in songbird phenology. We calculated the Acoustic Complexity Index (ACI), an algorithm representing an index of bird community complexity. Abrupt changes in ACI values from winter to spring corresponded to spring transition, suggesting that ACI may be an effective, albeit coarse metric to detect the arrival of migrating songbirds. The first peak in ACI shifted from April 16 to April 11 from 2012 to 2014. Changes in ACI were less abrupt in the fall due to weather events, suggesting spring recordings are better suited to indicate phenology. To ensure changes in ACI values were detecting real changes in songbird activity, we explored the relationship between ACI and song of three species: varied thrush (Ixoreus naevius), Pacific wren (Troglodytes pacificus), and ruby-crowned kinglet (Regulus calendula). ACI was positively related to counts of all species, but most markedly with song of the varied thrush, the most common species in our recordings and a known indicator of forest ecosystem health. We conclude that acoustic recordings paired with bioacoustic indices may be a useful method of monitoring shifts in songbird communities due to climate change and other sources of anthropogenic disturbance.
Efficacy of extracting indices from large-scale acoustic recordings to monitor biodiversity
DOI:10.1111/cobi.13119
PMID:29676813
[本文引用: 1]
Passive acoustic monitoring could be a powerful way to assess biodiversity across large spatial and temporal scales. However, extracting meaningful information from recordings can be prohibitively time consuming. Acoustic indices (i.e., a mathematical summary of acoustic energy) offer a relatively rapid method for processing acoustic data and are increasingly used to characterize biological communities. We examined the relationship between acoustic indices and the diversity and abundance of biological sounds in recordings. We reviewed the acoustic-index literature and found that over 60 indices have been applied to a range of objectives with varying success. We used 36 of the most indicative indices to develop a predictive model of the diversity of animal sounds in recordings. Acoustic data were collected at 43 sites in temperate terrestrial and tropical marine habitats across the continental United States. For terrestrial recordings, random-forest models with a suite of acoustic indices as covariates predicted Shannon diversity, richness, and total number of biological sounds with high accuracy (R ≥ 0.94, mean squared error [MSE] ≤170.2). Among the indices assessed, roughness, acoustic activity, and acoustic richness contributed most to the predictive ability of models. Performance of index models was negatively affected by insect, weather, and anthropogenic sounds. For marine recordings, random-forest models poorly predicted Shannon diversity, richness, and total number of biological sounds (R ≤ 0.40, MSE ≥ 195). Our results suggest that using a combination of relevant acoustic indices in a flexible model can accurately predict the diversity of biological sounds in temperate terrestrial acoustic recordings. Thus, acoustic approaches could be an important contribution to biodiversity monitoring in some habitats.© 2018 The Authors. Conservation Biology published by Wiley Periodicals, Inc. on behalf of Society for Conservation Biology.
Biological annihilation via the ongoing Sixth Mass Extinction signaled by vertebrate population losses and declines
Assessing the structure and drivers of biological sounds along a disturbance gradient
Defaunation in the Anthropocene
DOI:10.1126/science.1251817
PMID:25061202
[本文引用: 1]
We live amid a global wave of anthropogenically driven biodiversity loss: species and population extirpations and, critically, declines in local species abundance. Particularly, human impacts on animal biodiversity are an under-recognized form of global environmental change. Among terrestrial vertebrates, 322 species have become extinct since 1500, and populations of the remaining species show 25% average decline in abundance. Invertebrate patterns are equally dire: 67% of monitored populations show 45% mean abundance decline. Such animal declines will cascade onto ecosystem functioning and human well-being. Much remains unknown about this "Anthropocene defaunation"; these knowledge gaps hinder our capacity to predict and limit defaunation impacts. Clearly, however, defaunation is both a pervasive component of the planet's sixth mass extinction and also a major driver of global ecological change. Copyright © 2014, American Association for the Advancement of Science.
Assessing soundscape disturbance through hierarchical models and acoustic indices: A case study on a shelterwood logged northern Michigan forest
Sounding out ecoacoustic metrics: Avian species richness is predicted by acoustic indices in temperate but not tropical habitats
DOI:10.1016/j.ecolind.2018.06.012 URL [本文引用: 1]
Passive acoustic monitoring of the endangered African penguin (Spheniscus demersus) using autonomous recording units and ecoacoustic indices
DOI:10.1111/ibi.12970 URL [本文引用: 1]
Assessing mammal species richness and occupancy in a Northeast Asian temperate forest shared by cattle
DOI:10.1111/ddi.13237 URL [本文引用: 1]
Biogeographical and analytical implications of temporal variability in geographically diverse soundscapes
Population composition and distribution of waterfowl in Jilin Province
吉林省水鸟的种群组成及分布
Connecting soundscape to landscape: Which acoustic index best describes landscape configuration?
DOI:10.1016/j.ecolind.2015.05.057 URL [本文引用: 1]
Analytical methods in ecoacoustics
Assessing biodiversity with sound: Do acoustic diversity indices reflect phylogenetic and functional diversities of bird communities?
DOI:10.1016/j.ecolind.2012.10.009 URL [本文引用: 1]
The remote environmental assessment laboratory’s acoustic library: An archive for studying soundscape ecology
The dawn chorus in the great tit (Parus major): Proximate and ultimate causes
DOI:10.1163/156853983X00200 URL [本文引用: 1]
Increasing human dominance of tropical forests
DOI:10.1126/science.aaa9932
PMID:26293955
[本文引用: 1]
Tropical forests house over half of Earth's biodiversity and are an important influence on the climate system. These forests are experiencing escalating human influence, altering their health and the provision of important ecosystem functions and services. Impacts started with hunting and millennia-old megafaunal extinctions (phase I), continuing via low-intensity shifting cultivation (phase II), to today's global integration, dominated by intensive permanent agriculture, industrial logging, and attendant fires and fragmentation (phase III). Such ongoing pressures, together with an intensification of global environmental change, may severely degrade forests in the future (phase IV, global simplification) unless new "development without destruction" pathways are established alongside climate change-resilient landscape designs. Copyright © 2015, American Association for the Advancement of Science.
Computing biodiversity change via a soundscape monitoring network
Spatiotemporal variability of soundscapes in a multiple functional urban area
DOI:10.1016/j.landurbplan.2013.03.008 URL [本文引用: 1]
Biological diversity in a changing world
Acoustic indices perform better when applied at ecologically meaningful time and frequency scales
DOI:10.1111/2041-210X.13521 URL [本文引用: 1]
hardRain: An R package for quick, automated rainfall detection in ecoacoustic datasets using a threshold-based approach
Eavesdropping on the Arctic: Automated bioacoustics reveal dynamics in songbird breeding phenology
Annual acoustic dynamics are associated with seasonality in a monsoon tropical forest in South Vietnam
Vocal activity rate index: A useful method to infer terrestrial bird abundance with acoustic monitoring
DOI:10.1111/ibi.12728 URL [本文引用: 1]
A new methodology to infer the singing activity of an avian community: The acoustic complexity index (ACI)
DOI:10.1016/j.ecolind.2010.11.005 URL [本文引用: 2]
Soundscape ecology: The science of sound in the landscape
DOI:10.1525/bio.2011.61.3.6 URL [本文引用: 2]
Estimating overlap of daily activity patterns from camera trap data
DOI:10.1198/jabes.2009.08038 URL [本文引用: 1]
Automated audio recording as a means of surveying tinamous (Tinamidae) in the Peruvian Amazon
DOI:10.1002/ece3.8078
PMID:34646487
[本文引用: 1]
The use of machine learning technologies to process large quantities of remotely collected audio data is a powerful emerging research tool in ecology and conservation.We applied these methods to a field study of tinamou (Tinamidae) biology in Madre de Dios, Peru, a region expected to have high levels of interspecies competition and niche partitioning as a result of high tinamou alpha diversity. We used autonomous recording units to gather environmental audio over a period of several months at lowland rainforest sites in the Los Amigos Conservation Concession and developed a Convolutional Neural Network-based data processing pipeline to detect tinamou vocalizations in the dataset.The classified acoustic event data are comparable to similar metrics derived from an ongoing camera trapping survey at the same site, and it should be possible to combine the two datasets for future explorations of the target species' niche space parameters.Here, we provide an overview of the methodology used in the data collection and processing pipeline, offer general suggestions for processing large amounts of environmental audio data, and demonstrate how data collected in this manner can be used to answer questions about bird biology.© 2021 The Authors. Ecology and Evolution published by John Wiley & Sons Ltd.
Acoustic monitoring of nocturnally migrating birds accurately assesses the timing and magnitude of migration through the Great Lakes
DOI:10.1650/CONDOR-13-098.1 URL [本文引用: 1]
The seasons of bird song the beginning of song in spring
DOI:10.2307/4080066 URL [本文引用: 1]
Using ecoacoustics metrices to track grassland bird richness across landscape gradients
soundClass: An automatic sound classification tool for biodiversity monitoring using machine learning
DOI:10.1111/2041-210X.13964 URL [本文引用: 1]
Celestial patterns in marine soundscapes
DOI:10.3354/meps10911 URL [本文引用: 1]
Acoustic indices for biodiversity assessment and landscape investigation
Remote sensing for biodiversity science and conservation
DOI:10.1016/S0169-5347(03)00070-3 URL [本文引用: 1]
Estimating animal acoustic diversity in tropical environments using unsupervised multiresolution analysis
DOI:10.1016/j.ecolind.2018.03.026 URL [本文引用: 1]
A primer of acoustic analysis for landscape ecologists
DOI:10.1007/s10980-011-9636-9 URL [本文引用: 2]
Ecological evaluation of the wetland in the downstream region of Tumen River
图们江下游地区湿地生态评价
The use of fast Fourier transform for the estimation of power spectra: A method based on time averaging over short, modified periodograms
DOI:10.1109/TAU.1967.1161901 URL [本文引用: 1]
Investigation and diversity analysis on the number of winter waterfowl in Jingxin Wetland of Hunchun Nature Reserve in Jilin Province
吉林省珲春保护区敬信湿地冬季水鸟数量调查及多样性分析
Studies on the Time Domain Characters of Songs and the Stridulatory Organs of Grylloidea from China
中国蟋蟀总科昆虫发声器及鸣声时域特征的研究
Biodiversity and their protection in the Jingxin Wetland in the Tumen River Basin
图们江流域敬信湿地生物多样性及其保护对策
The water birds and their ecology distribution along the lower reaches of Tumen River
图们江下游湿地水鸟及其生态分布
Community structure of Anatidae in spring in Jingxin area of Hunchun, Jilin Province
吉林省珲春敬信地区春季鸭科鸟类群落结构的研究
Progress and outlook for soundscape ecology
DOI:10.17520/biods.2020114
[本文引用: 1]
Soundscape ecology studies the patterns of sounds across a variety of spatial and temporal scales, which reflects coupled natural-human dynamics in a changing landscape. We reviewed peer-reviewed studies on soundscape ecology, and summarized the conceptual framework of soundscape ecology, the methodology used and acoustic indices developed in these studies. Current studies primarily focus on the following aspects: 1) acoustic composition of soundscape; 2) acoustic interactions between soundscape components; 3) temporal patterns and spatial variability in the soundscapes; 4) acoustic indices developed for biodiversity monitoring and their efficacy. For future studies on soundscape ecology and biodiversity conservation, we suggest: 1) establishing systematic acoustic monitoring network and data management platform; 2) developing new methods for data collection and analysis (e.g., recording matrix and machine learning algorithm); and 3) treating soundscape as an important resource in future research and conservation.
声景生态学研究进展和展望
DOI:10.17520/biods.2020114
[本文引用: 1]
声景生态学以景观中的声音为研究对象,探讨其在不同时空维度上的分布和变化模式,从而揭示自然环境、野生动物和人类活动的相互作用关系。通过系统检索声景生态学研究的相关文献,本文回顾了该学科的研究框架、研究方法,总结了目前常用的声学指标,重点归纳了声景生态学的研究内容,包括声景组成和各组分间的相互作用,声景的时空格局,以及声景生态学在生物多样性监测中的应用。目前,声景监测中存在的问题主要包括监测的生态系统类型和物种类群有限、声学指标效力有待提高等。建议未来着重推进建立系统性的声景监测网络和数据管理平台;开发和完善音频数据采集、分析方法和评估指标;并重视声景数据的采集,将声景视作一种资源进行研究和保护。
Landscape dynamics and driving forces of wetlands in the Tumen River Basin of China over the past 50 years
DOI:10.1007/s11355-016-0304-8 URL [本文引用: 1]
Exploring spatio-temporal variation in soundscape saturation of an African tropical forest landscape
