鸟类迁徙对图们江下游湿地声景时间格局的影响
Effects of bird migration on the temporal patterns of the wetland soundscape in the downstream region of the Tumen River Basin of China
| 示意图 Schematic diagram | 声学指数 Acoustic indices | 声景格局 Soundscape pattern | 参考文献 References |
|---|---|---|---|
时频图 Spectrogram 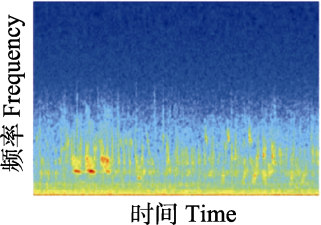 | 声音复杂度指数(ACI): 音频中相邻时间窗声强的变异性, 值的范围 > 0。Quantifies the sound complexity for estimating the variability of the intensities between time samples within a frequency band. Range = [0, +]. | 高值代表高水平的鸟类活动; 低值代表持续性的昆虫噪音。High values represent higher levels of bird activity, while low values represent consistent insect noise. | Pieretti et al, |
频谱图 Spectrum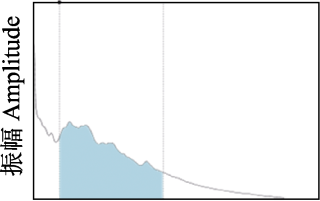 | 生物声学指数(BIO): 声谱图中2-11 kHz范围内超过分贝阈值部分的面积, 值的范围 > 0。Estimates the area under curve of the mean spectrum above a specific decibel (dB) threshold within 2-11 kHz. Range = [0, +]. | 高值代表生物声丰富, 大量频段被占据, 最高声和最安静频段差异大; 低值代表在2-11 kHz之间很少有声音。High values represent higher levels of biophonic, in which many frequency bands are occupied, and significant disparity between the loudest and quietest bands; low values represent no sound between 2 and 11 kHz. | Boelman et al, |
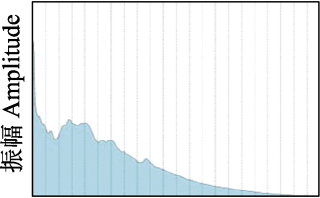 | 声音均匀度指数(AEI): 表示声信号强度在不同频段的均匀度, 计算Gini系数来表示声信号强度在每个1 kHz频段的不均等程度, 值的范围为0-1。Measures the evenness of the acoustic activity distribution estimating the Gini coefficient on the signal proportion in each 1 kHz band. Range = [0, 1]. | 高值代表少数频段由高的声强主导; 低值代表多个频段被占据或者所有频段没有声学活动。High values represent high sound intensity in a restricted range of frequencies; low values represent either high or no acoustic activity across all frequency bins. | Villanueva-Rivera et al, |
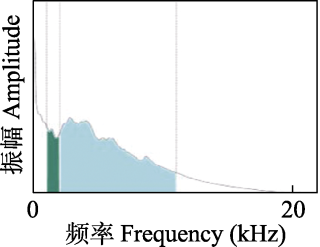 | 标准化声景差异指数(NDSI): 人造声(1-2 kHz)与生物声(2-11 kHz)频段间声信号功率的比率, 值的范围为-1至1。The ratio of signal power in the frequency bands between anthrophony (1-2 kHz) and biophony (2-11 kHz). Range = [-1, 1]. | 高值代表高水平的生物声, 而低值代表人造声为主。High values represent higher levels of biophonic activity, and minimal noise in 1-2 kHz. |