
Biodiv Sci ›› 2026, Vol. 34 ›› Issue (1): 25278. DOI: 10.17520/biods.2025278 cstr: 32101.14.biods.2025278
• Special Feature: Methods for Ecological Data Analysis • Previous Articles Next Articles
Yi Zou*( )(
)( )
)
Received:2025-07-18
Accepted:2025-09-17
Online:2026-01-20
Published:2026-01-21
Contact:
Yi Zou
Yi Zou. Alpha-diversity index selection: Simulation comparison under unequal sampling[J]. Biodiv Sci, 2026, 34(1): 25278.
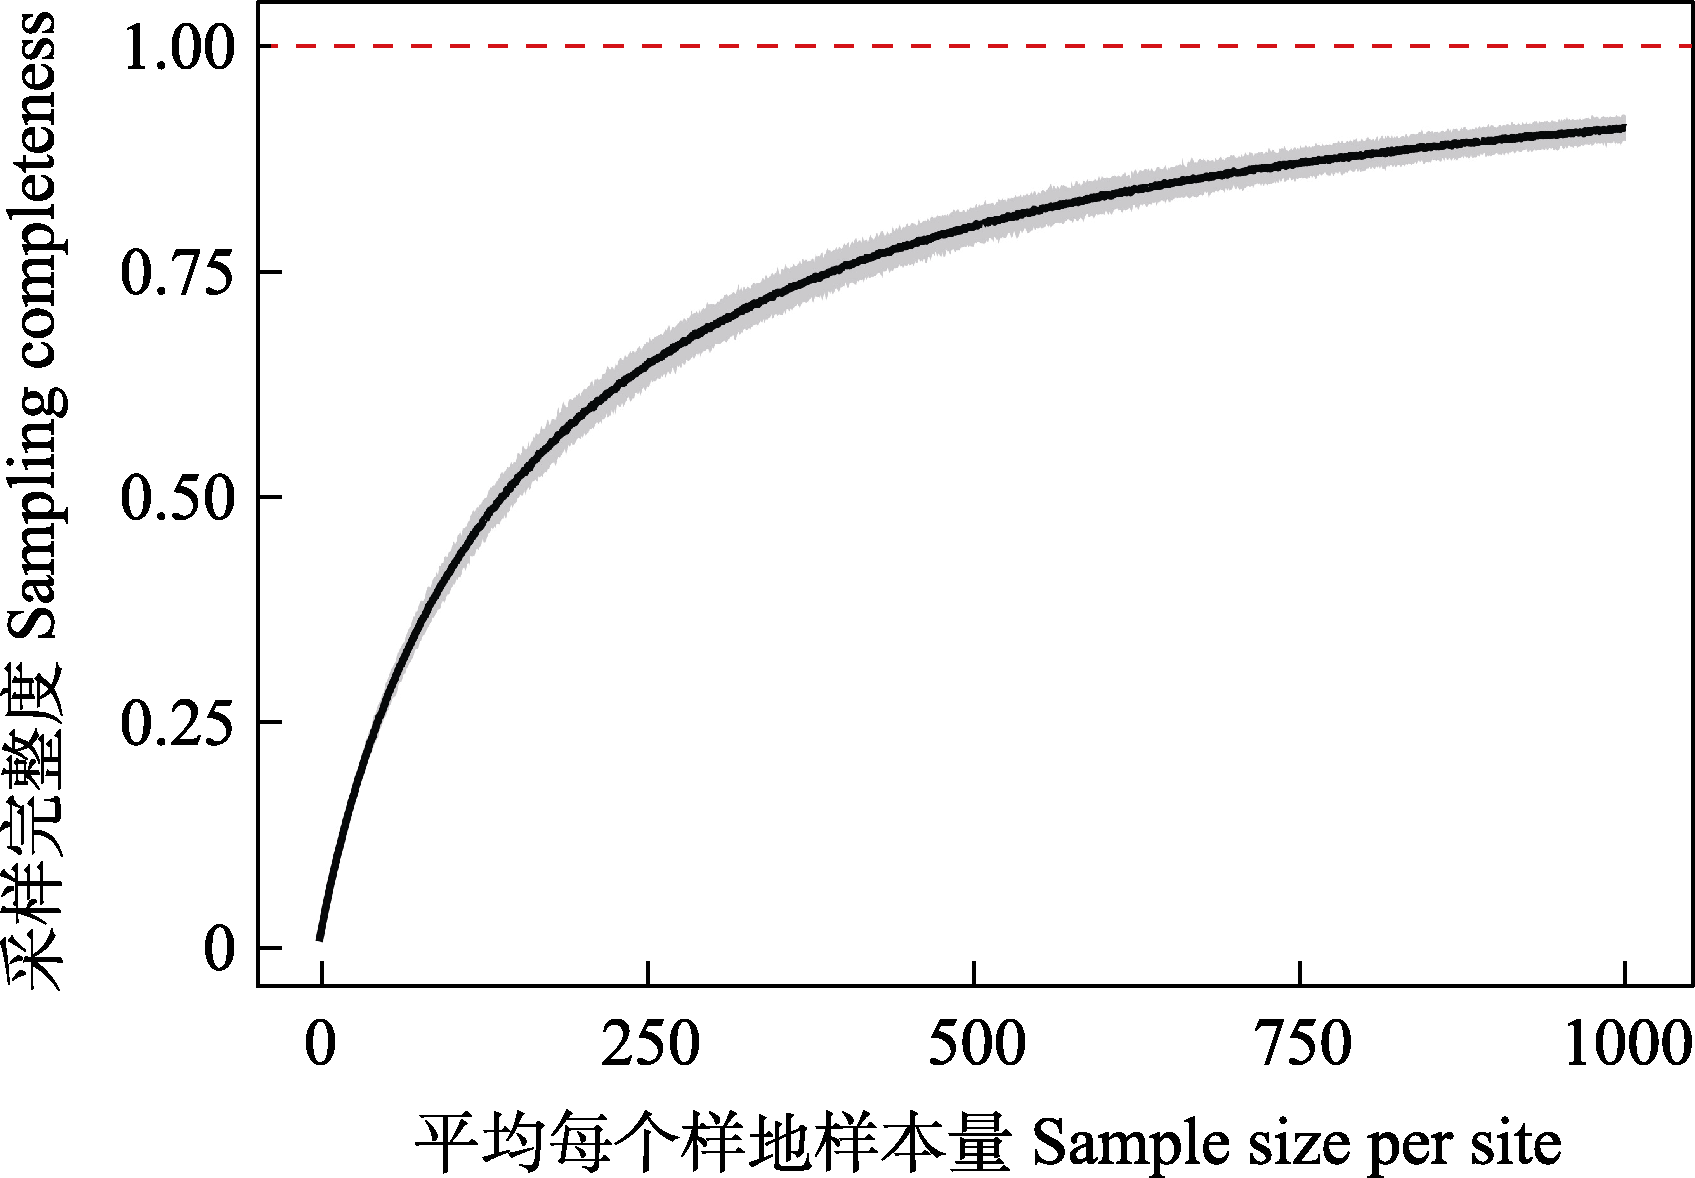
Fig. 1 Relationship between sample size per site and the sampling completeness. Shade area refers to the 95% confidence interval.
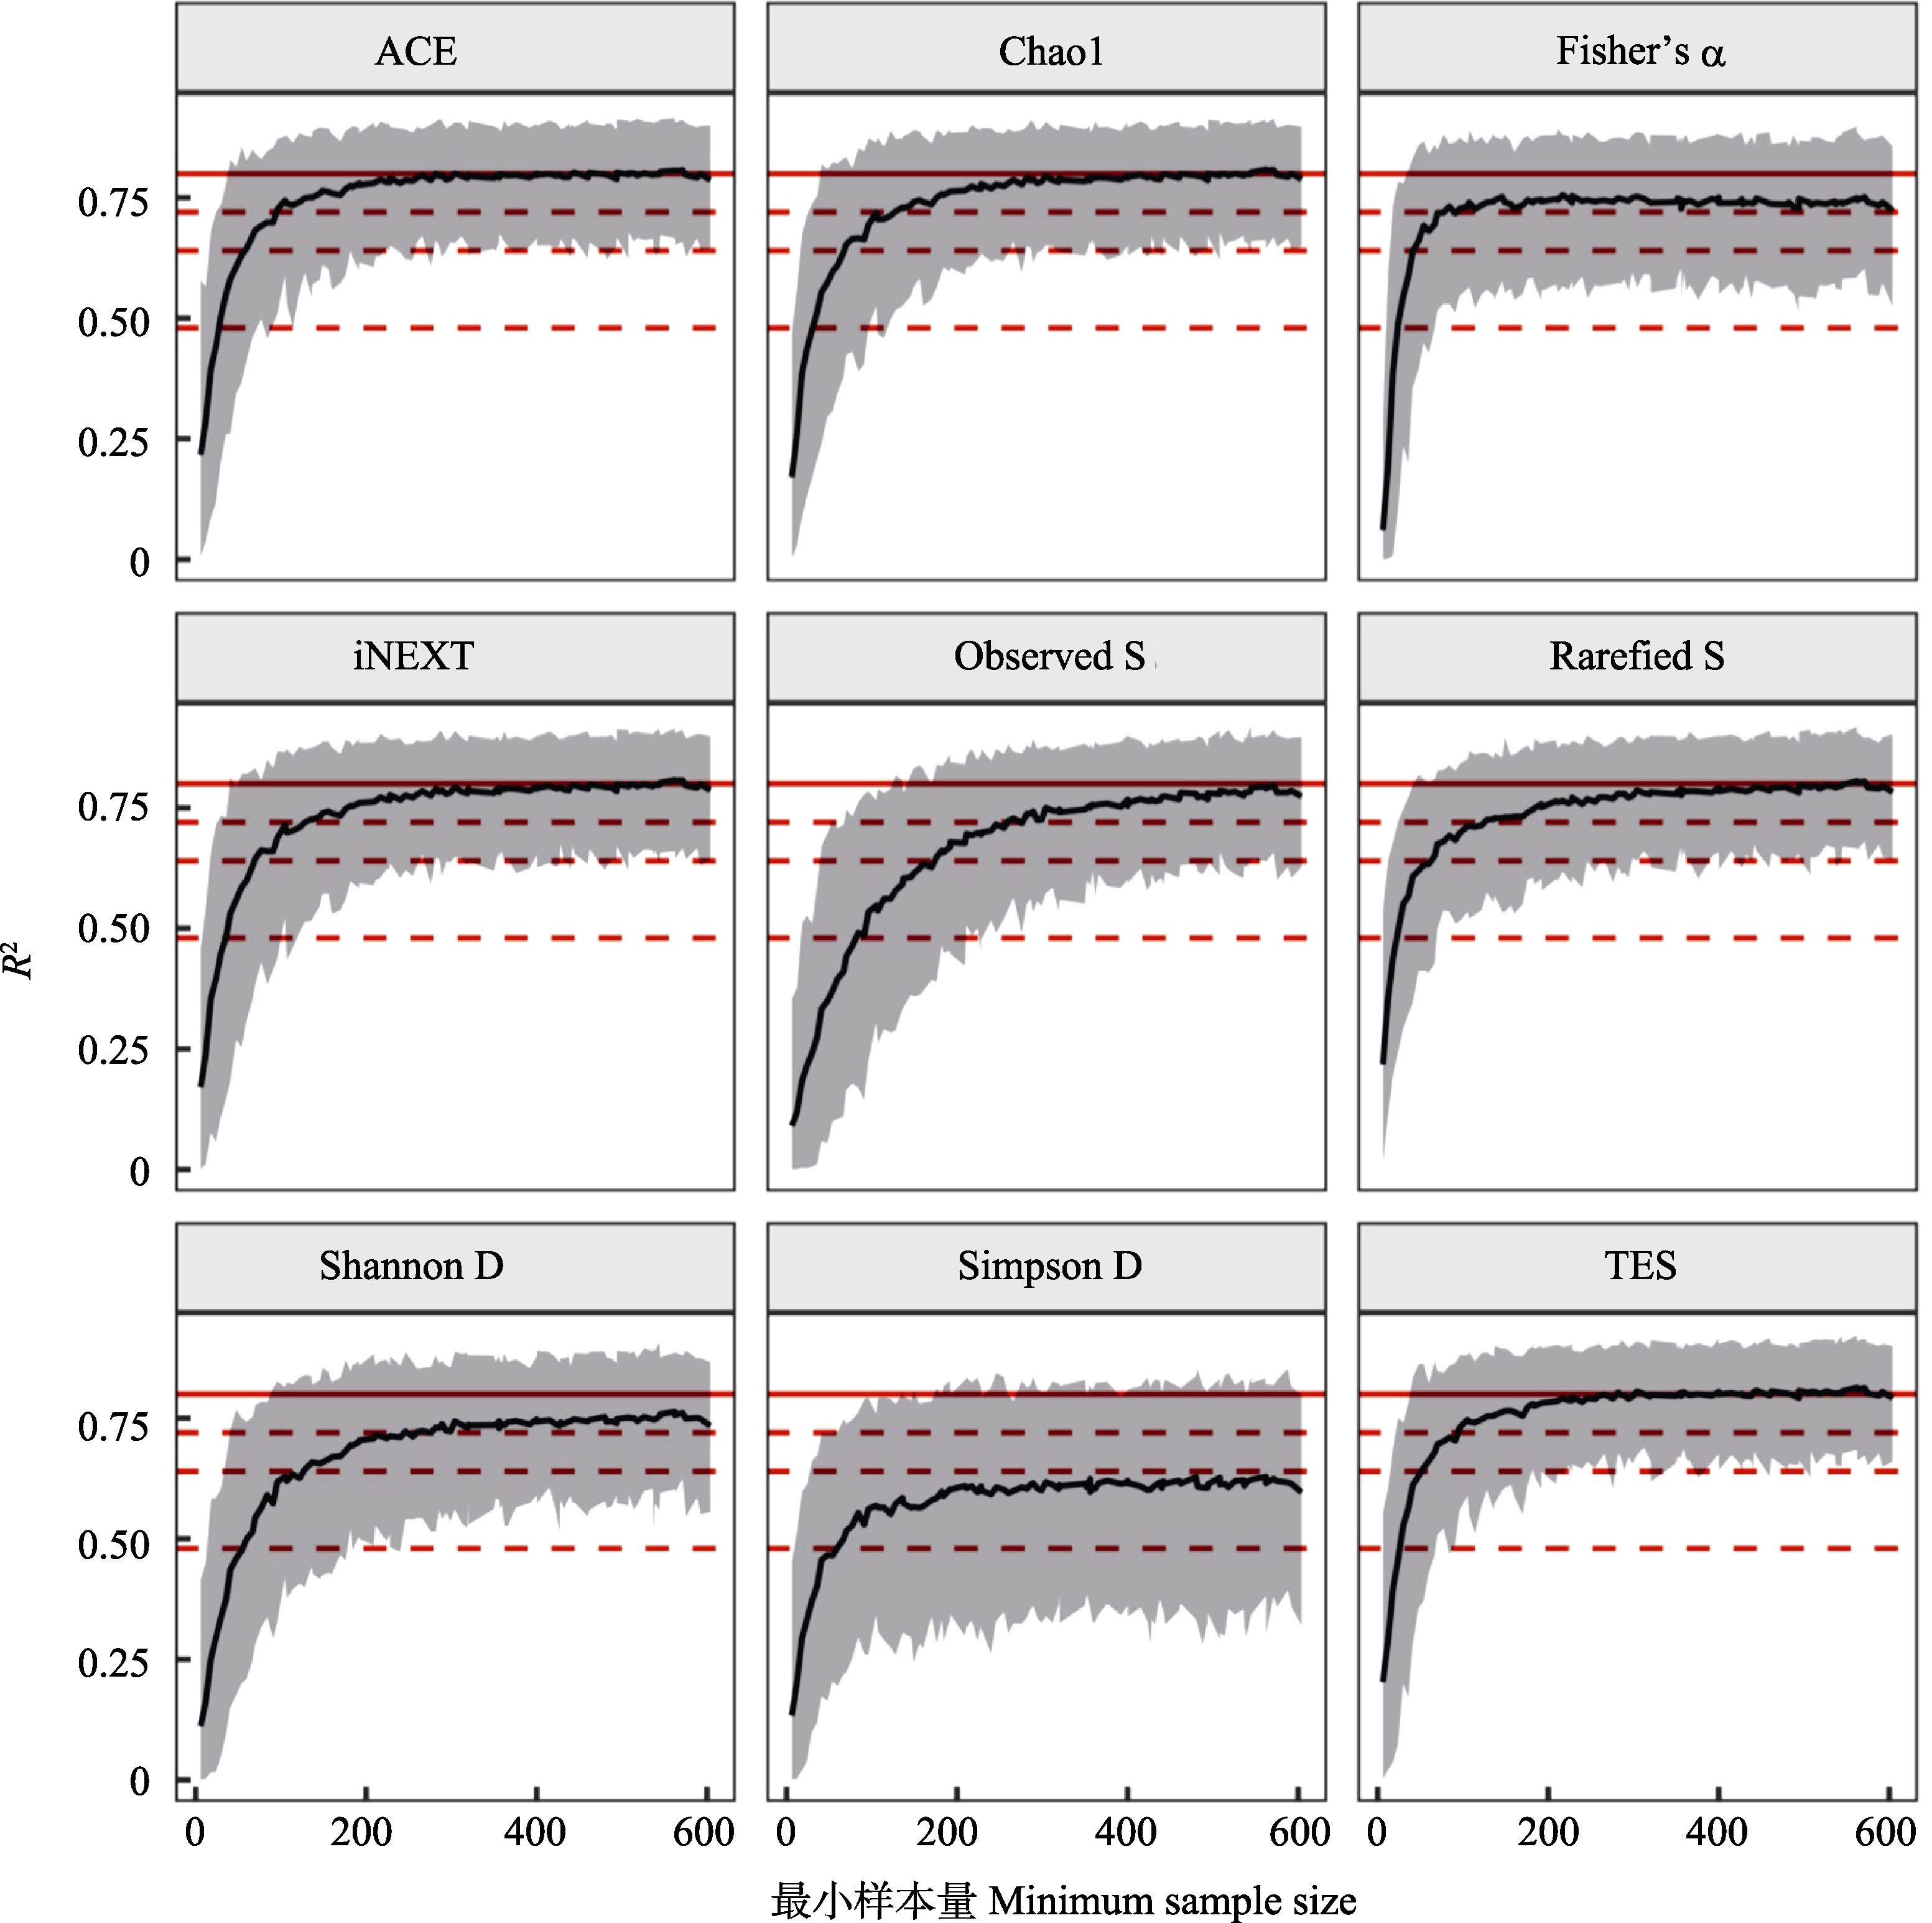
Fig. 2 Relationship between the minimum sample size and coefficient of determination (R2) from linear regression. Lines and shade areas refer to the mean and 95% confidence interval (CI) from 200 simulations. Three dashed red lines refer to R2 = 0.48 (60% set value), 0.64 (80% set value), and 0.72 (90% set value), respectively, while the solid red line represents R2 = 0.80 (theoretical setting value).
| 指数 Index | 60% (CV < 0.2) | 80% (CV < 0.2) | 90% (CV < 0.2) | 60% (CV < 0.3) | 80% (CV < 0.3) | 90% (CV < 0.3) |
|---|---|---|---|---|---|---|
| Observed S | 160 (53.1%) | 176 (55.5%) | 260 (65.3%) | 96 (40.6%) | 176 (55.5%) | 260 (65.3%) |
| Shannon D | 105 (42.8%) | 128 (47.5%) | 246 (64%) | 60 (30.3%) | 128 (47.5%) | 246 (64%) |
| Simpson D | 105 (42.8%) | - | - | 60 (30.3%) | - | - |
| Rarefied S | 48 (25.8%) | 67 (32.5%) | 128 (47.5%) | 24 (15.3%) | 67 (32.5%) | 128 (47.5%) |
| Fisher’s α | - | 48 (25.8%) | 84 (37.5%) | 30 (18.3%) | 48 (25.8%) | 84 (37.5%) |
| Chao1 | 67 (32.5%) | 70 (33.5%) | 128 (47.5%) | 36 (21.1%) | 70 (33.5%) | 128 (47.5%) |
| ACE | - | 60 (30.3%) | 96 (40.6%) | 30 (18.3%) | 60 (30.3%) | 96 (40.6%) |
| iNEXT | - | 70 (33.5%) | 136 (49%) | 48 (25.8%) | 70 (33.5%) | 136 (49%) |
| TES | - | 60 (30.3%) | 96 (40.6%) | 30 (18.3%) | 54 (28.3%) | 96 (40.6%) |
Table 1 Minimum sample sizes required for different diversity indices to achieve predefined recovery levels of 60% (0.48), 80% (0.64), 90% (0.72) to the target correlation R2, with the corresponding sample completeness shown in parentheses. Results are reported under two error thresholds, CV < 0.2 and CV < 0.3. “-” indicates that the criterion was not met.
| 指数 Index | 60% (CV < 0.2) | 80% (CV < 0.2) | 90% (CV < 0.2) | 60% (CV < 0.3) | 80% (CV < 0.3) | 90% (CV < 0.3) |
|---|---|---|---|---|---|---|
| Observed S | 160 (53.1%) | 176 (55.5%) | 260 (65.3%) | 96 (40.6%) | 176 (55.5%) | 260 (65.3%) |
| Shannon D | 105 (42.8%) | 128 (47.5%) | 246 (64%) | 60 (30.3%) | 128 (47.5%) | 246 (64%) |
| Simpson D | 105 (42.8%) | - | - | 60 (30.3%) | - | - |
| Rarefied S | 48 (25.8%) | 67 (32.5%) | 128 (47.5%) | 24 (15.3%) | 67 (32.5%) | 128 (47.5%) |
| Fisher’s α | - | 48 (25.8%) | 84 (37.5%) | 30 (18.3%) | 48 (25.8%) | 84 (37.5%) |
| Chao1 | 67 (32.5%) | 70 (33.5%) | 128 (47.5%) | 36 (21.1%) | 70 (33.5%) | 128 (47.5%) |
| ACE | - | 60 (30.3%) | 96 (40.6%) | 30 (18.3%) | 60 (30.3%) | 96 (40.6%) |
| iNEXT | - | 70 (33.5%) | 136 (49%) | 48 (25.8%) | 70 (33.5%) | 136 (49%) |
| TES | - | 60 (30.3%) | 96 (40.6%) | 30 (18.3%) | 54 (28.3%) | 96 (40.6%) |
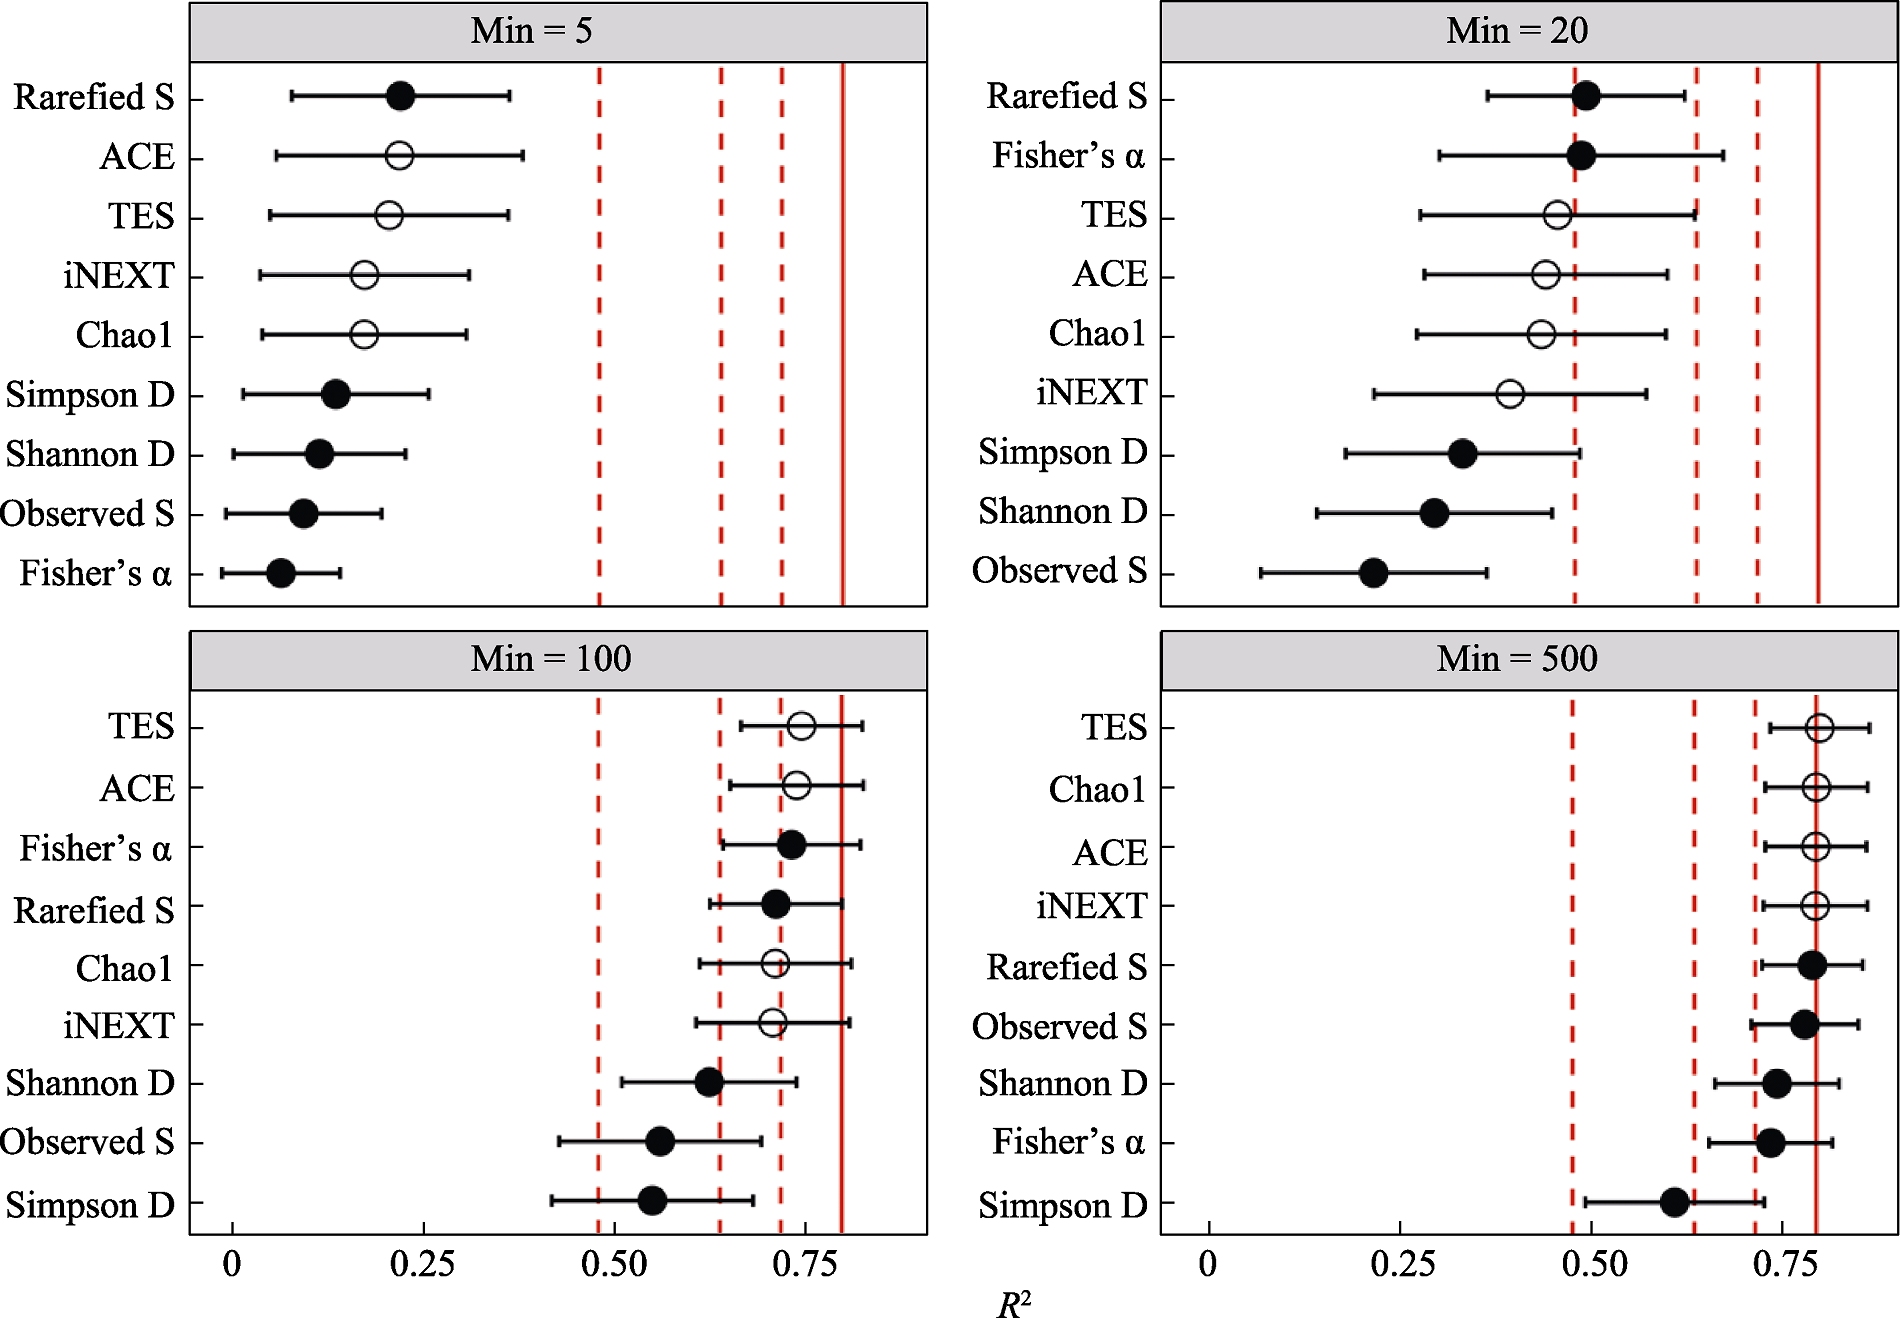
Fig. 3 Coefficient of determination (R2) between each α-diversity metric and the environmental gradient under four minimum-sample scenarios (Min = 5, 20, 100, 500). (mean ± SD, 200 simulations). Solid dots are directly calculated diversity indices, and open symbols are richness estimators. Red three dashed red lines refer to R2 = 0.48 (60% set value), 0.64 (80% set value), and 0.72 (90% set value), respectively, while the solid red line represents R2 = 0.80 (theoretical setting value).
| [1] |
Beck J, Schwanghart W (2010) Comparing measures of species diversity from incomplete inventories: An update. Methods in Ecology and Evolution, 1, 38-44.
DOI URL |
| [2] |
Brehm G, Süssenbach D, Fiedler K (2003) Unique elevational diversity patterns of geometrid moths in an Andean montane rainforest. Ecography, 26, 456-466.
DOI URL |
| [3] | Chao A (1984) Nonparametric estimation of the number of classes in a population. Scandinavian Journal of Statistics, 11, 265-270. |
| [4] | Chao A, Chiu C (2016) Species richness:Estimation and comparison. Wiley StatsRef: Statistics Reference Online, 1-26. |
| [5] |
Chao A, Colwell RK, Chiu CH, Townsend D (2017) Seen once or more than once: Applying Good-Turing theory to estimate species richness using only unique observations and a species list. Methods in Ecology and Evolution, 8, 1221-1232.
DOI URL |
| [6] |
Chao A, Jost L (2012) Coverage-based rarefaction and extrapolation: Standardizing samples by completeness rather than size. Ecology, 93, 2533-2547.
DOI PMID |
| [7] |
Chao A, Lee SM (1992) Estimating the number of classes via sample coverage. Journal of the American Statistical Association, 87, 210-217.
DOI URL |
| [8] |
Currie DJ (1991) Energy and large-scale patterns of animal- and plant-species richness. The American Naturalist, 137, 27-49.
DOI URL |
| [9] | Engel T, Blowes SA, McGlinn DJ, May F, Gotelli NJ, McGill BJ, Chase JM (2021) Using coverage-based rarefaction to infer non-random species distributions. Ecosphere, 12, e03745. |
| [10] |
Fisher RA, Corbet AS, Williams CB (1943) The relation between the number of species and the number of individuals in a random sample of an animal population. Journal of Animal Ecology, 12, 42-58.
DOI URL |
| [11] |
Flather C (1996) Fitting species-accumulation functions and assessing regional land use impacts on avian diversity. Journal of Biogeography, 23, 155-168.
DOI URL |
| [12] | Gorrod EJ, Keith DA (2009) Observer variation in field assessments of vegetation condition: Implications for biodiversity conservation. Ecological Management & Restoration, 10, 31-40. |
| [13] |
Gotelli NJ, Colwell RK (2001) Quantifying biodiversity: Procedures and pitfalls in the measurement and comparison of species richness. Ecology Letters, 4, 379-391.
DOI URL |
| [14] | Hayek LAC, Buzas MA (2010) Surveying Natural Populations: Quantitative Tools for Assessing Biodiversity, 2nd edn. Columbia University Press, New York. |
| [15] |
Hsieh TC, Ma KH, Chao A (2016) iNEXT: An R package for rarefaction and extrapolation of species diversity (Hill numbers). Methods in Ecology and Evolution, 7, 1451-1456.
DOI URL |
| [16] |
Hurlbert AH, Haskell JP (2003) The effect of energy and seasonality on avian species richness and community composition. The American Naturalist, 161, 83-97.
DOI URL |
| [17] |
Hurlbert SH (1971) The nonconcept of species diversity: A critique and alternative parameters. Ecology, 52, 577-586.
DOI PMID |
| [18] |
Jost L (2006) Entropy and diversity. Oikos, 113, 363-375.
DOI URL |
| [19] |
Kreyling J, Schweiger AH, Bahn M, Ineson P, Migliavacca M, Morel-Journel T, Christiansen JR, Schtickzelle N, Larsen KS (2018) To replicate, or not to replicate—that is the question: How to tackle nonlinear responses in ecological experiments? Ecology Letters, 21, 1629-1638.
DOI PMID |
| [20] | Lomolino MV (2001) The species-area relationship: New challenges for an old pattern. Progress in Physical Geography: Earth and Environment, 25, 1-21. |
| [21] | Ma KP, Liu YM (1994) Measurement of biotic community diversity. I. α diversity (Part 2). Chinese Biodiversity, 2, 231-239. (in Chinese with English abstract) |
| [马克平, 刘玉明 (1994) 生物群落多样性的测度方法. I. α多样性的测度方法(下). 生物多样性, 2, 231-239.] | |
| [22] |
McGill BJ (2011) Linking biodiversity patterns by autocorrelated random sampling. American Journal of Botany, 98, 481-502.
DOI PMID |
| [23] | McGill BJ, Etienne RS, Gray JS, Alonso D, Anderson MJ, Benecha HK, Dornelas M, Enquist BJ, Green JL, He FL, Hurlbert AH, Magurran AE, Marquet PA, Maurer BA, Ostling A, Soykan CU, Ugland KI, White EP (2007) Species abundance distributions: Moving beyond single prediction theories to integration within an ecological framework. Ecology Letters, 10, 995-1015. |
| [24] | Mersmann O, Trautmann H, Steuer D, Bornkamp B (2018) truncnorm: Truncated Normal Distribution. R package version 1.0-8. |
| [25] | Oksanen J, Blanchet FG, Friendly M, Kindt R, Legendre P, McGlinn D, Minchin PR, O’Hara RB, Simpson GL, Solymos P, Stevens MHH, Szoecs E, Wagner H (2018) vegan: Community Ecology Package. R package version 2.5-6. |
| [26] | R Core Team (2021) R: A Language and Environment for Statistical Computing. Version 4.1.2. R Foundation for Statistical Computing, Vienna, Austria. |
| [27] |
Reese GC, Wilson KR, Flather CH (2014) Performance of species richness estimators across assemblage types and survey parameters. Global Ecology and Biogeography, 23, 585-594.
DOI URL |
| [28] | Soley-Guardia M, Alvarado-Serrano DF, Anderson RP (2024) Top ten hazards to avoid when modeling species distributions: A didactic guide of assumptions, problems, and recommendations. Ecography, 2024, e06852. |
| [29] |
Whittaker RH (1960) Vegetation of the Siskiyou Mountains, Oregon and California. Ecological Monographs, 30, 279-338.
DOI URL |
| [30] | Wickham H (2009) ggplot2: Elegant Graphics for Data Analysis. Springer Publishing Company, New York. |
| [31] | Wickham H, François R, Henry L, Müller K, Vaughan D (2023) dplyr: A Grammar of Data Manipulation. R package version 1.1.4. |
| [32] | Zou Y, Zhao P, Axmacher JC (2023) Estimating total species richness: Fitting rarefaction by asymptotic approximation. Ecosphere, 14, e4363. |
| [33] | Zou Y, Zhao P, Wu NC, Lai JS, Peres-Neto PR, Axmacher JC (2025) rarestR: An R package using rarefaction metrics to estimate α- and β-diversity for incomplete samples. Diversity and Distributions, 31, e13954. |
| [1] | Zhicheng Kang, Chunlei Gao, Jianing Guo, Fanping Meng, Zongling Wang. Diversity, distribution and environmental correlation of harmful dinoflagellate cysts in the Bohai Sea and the North Yellow Sea in spring [J]. Biodiv Sci, 2026, 34(3): 25426-. |
| [2] | Jiqi Gu, Jiangshan Lai, Ying Wang, Haoran Wu, Xue Zhang, Xiaotong Song, Xiaoming Shao, Anru Lou. Theoretical foundations, methodological advances, and applications of joint species distribution models with a focus on the HMSC framework in ecology [J]. Biodiv Sci, 2026, 34(1): 25364-. |
| [3] | Qilong Yu, Minhui Hao, Huaijiang He, Chunyu Zhang, Xiuhai Zhao. Relationships of biodiversity and productivity change with forest succession in Changbai Mountains: Insights from species, traits, and phylogeny [J]. Biodiv Sci, 2025, 33(8): 25060-. |
| [4] | Song Yuanhao, Gong Lü, Li Ben, Hu Yang, Li Xiuzhen. Impacts of different pond-to-wetland restoration methods on macrofauna in the Liao River Estuary, China [J]. Biodiv Sci, 2025, 33(2): 24316-. |
| [5] | Jia Zhenni, Zhang Yicen, Du Yanjun, Ren Haibao. Influences of disturbances on successional dynamics of species diversity in mid- subtropical forests [J]. Biodiv Sci, 2025, 33(2): 24078-. |
| [6] | Xiaoqian Ju, Yun Tian, Mingze Xu, Yuanmeng Dai, Manle Li, Yuhan Zhou, Peng Liu, Xin Jia, Tianshan Zha. How soil environmental factors shape leaf traits in arid-land vegetation [J]. Biodiv Sci, 2025, 33(11): 25158-. |
| [7] | Shangxuan Li, Jiao Ming, Genjuan Chen, Jie Wu, Bingchang Zhang. Effects of synergistic development between vegetation and biological soil crusts on soil bacterial communities in the wind-sandy area of northwestern Shanxi Province [J]. Biodiv Sci, 2025, 33(10): 25236-. |
| [8] | Shiyu Wei, Tianjiao Song, Jiayi Luo, Yan Zhang, Zixuan Zhao, Jingwen Ru, Hua Yi, Yanbing Lin. Altitudinal distribution patterns of soil bacterial communities in the Huoditang coniferous forests of the Qinling Mountains [J]. Biodiv Sci, 2024, 32(9): 24180-. |
| [9] | Xinyi He, Yumei Pan, Yan Zhu, Jiayi Chen, Sirong Zhang, Naili Zhang. Impact of ectomycorrhizal tree dominance and species richness on soil nitrogen turnover in a warm temperate forest [J]. Biodiv Sci, 2024, 32(9): 24173-. |
| [10] | Yiyun Gu, Jiaqi Xue, Jinhui Gao, Xinyi Xie, Ming Wei, Jinyu Lei, Cheng Wen. A public science data-based regional bird diversity assessment method [J]. Biodiv Sci, 2024, 32(7): 24080-. |
| [11] | Jingci Meng, Guodong Wang, Guanglan Cao, Nanlin Hu, Meiling Zhao, Yantong Zhao, Zhenshan Xue, Bo Liu, Wenhua Piao, Ming Jiang. Patterns and drivers of plant species richness in Phragmites australis marshes in China [J]. Biodiv Sci, 2024, 32(2): 23194-. |
| [12] | Guoshan Shi, Feng Liu, Guanghong Cao, Dian Chen, Shangwen Xia, Yun Deng, Bin Wang, Xiaodong Yang, Luxiang Lin. Beta diversity of woody plants in a tropical seasonal rainforest at Xishuangbanna: Roles of space, environment, and forest stand structure [J]. Biodiv Sci, 2024, 32(12): 24285-. |
| [13] | Liyuan Wang, Huijian Hu, Jie Jiang, Yiming Hu. Species richness patterns of mammals and birds and their drivers in the Nanling Mountain Range [J]. Biodiv Sci, 2024, 32(1): 23026-. |
| [14] | Zhifa Liu, Xincai Wang, Yuening Gong, Daojian Chen, Qiang Zhang. Diversity and elevational distribution of birds and mammals based on infrared camera monitoring in Guangdong Nanling National Nature Reserve [J]. Biodiv Sci, 2023, 31(8): 22689-. |
| [15] | Yali Zhang, Bingchang Zhang, Kang Zhao, Kaikai Li, Yanjin Liu. Variation of bacterial communities and their driving factors in different types of biological soil crusts in Mu Us sandy land [J]. Biodiv Sci, 2023, 31(8): 23027-. |
| Viewed | ||||||
|
Full text |
|
|||||
|
Abstract |
|
|||||
Copyright © 2026 Biodiversity Science
Editorial Office of Biodiversity Science, 20 Nanxincun, Xiangshan, Beijing 100093, China
Tel: 010-62836137, 62836665 E-mail: biodiversity@ibcas.ac.cn