


大型食肉动物在生态系统中具有重要功能(Malhi et al, 2016; Hoeks et al, 2020)。大型食肉动物位于较高的营养级, 不仅直接影响猎物的数量和分布, 也通过营养级联反应间接影响生态系统中更多营养级的其他生物和非生物组成(Schmitz et al, 2000; Estes et al, 2011; Ripple et al, 2014; Hoeks et al, 2020), 维持生态系统的整体性和稳定性(Sergio et al, 2008; Ritchie & Johnson, 2009)。大型食肉动物的减少会带来生态系统中总体生物量下降、初级生产力降低、关键生态功能丧失等一系列严重后果(Estes et al, 2011; Hoeks et al, 2020), 且无法由中小型食肉动物补偿(Ripple et al, 2014)。今天, 全球的大型食肉动物普遍受到土地覆盖变化、生境质量下降、猎物减少、人兽冲突加剧等的威胁(Ripple et al, 2014), 近60%的大型食肉动物面临灭绝的风险, 亟需研究和保护(Enquist et al, 2020)。
在大型食肉动物中, 豹(Panthera pardus)被认为具有最强的环境适应能力, 能够适应森林、草地、农田等多种栖息地类型(Jacobson et al, 2016), 有广泛的食谱和较宽的生态位(Hayward et al, 2006), 因此对于人类改造的环境具有相对较强的适应性(Athreya et al, 2013; Odden et al, 2014; Jacobson et al, 2016)。华北豹(Panthera pardus japonensis)是中国特有的豹亚种, 为国家一级重点保护野生动物(蒋志刚, 2021), 曾经广泛分布于中国的大部分区域, 但经历了种群数量和分布范围的急剧减少, 目前面临着栖息地破碎化和质量下降、小种群隔离及人兽冲突等威胁(Jacobson et al, 2016; Laguardia et al, 2017)。
1 研究区域
本研究区位于宁夏回族自治区南部的六盘山国家级自然保护区及其周边区域(106.02°-106.98° E, 35.03°-35.99° N), 面积约905 km2。六盘山位于宁夏回族自治区南部与甘肃省交界处, 地处黄土高原中西部, 其山麓南端与秦岭西段相接(卓正大和张宏建, 1987)。六盘山的整体森林覆盖率在70%以上, 有完整的森林生态系统, 是多种植物区系的交汇处, 有多样的生境和丰富的生物多样性资源(常保华, 2013; 戴君虎等, 2013; 袁彩霞和余杨春, 2016)。六盘山的山体主要由东西两列近平行的山脉组成, 两列山脉呈南北走向。六盘山国家级自然保护区边界位于东西两侧山脉上, 中间被山脉之间宽5-10 km的低地和农田、居民点、道路隔断(郜二虎等, 2007)。
2 研究方法
2.1 外业调查
在外业调查前, 需依据目标物种的家域大小进行合理的取样设置。考虑到亚洲地区豹各亚种的平均家域面积约20-100 km2 (Karanth & Sunquist, 2000; Odden & Wegge, 2005; Simcharoen et al, 2008; Odden et al, 2014; Rodríguez-Recio et al, 2022), 我们首先利用5 km × 5 km的取样条带覆盖六盘山国家级自然保护区的不同区域, 包括目标物种在保护区内外所有已知的分布区域, 并保证任何区域5 km内均设置取样条带。共设置了16个取样网格, 随后在每个划定的5 km × 5 km取样网格内部生成25个1 km × 1 km的取样栅格。每年开展4次野外调查, 每次野外调查前通过生成随机数的方式, 从每个25 km2的取样网格中随机抽取6-10个取样栅格, 在每个随机取样栅格中心点300 m距离内布设红外相机(图1)。每次野外调查布设的红外相机的调查周期为60-90 d, 在一个调查周期结束后即开始下一次野外工作。回收上一个调查周期中安装的红外相机, 更换电池和存储卡, 并将红外相机转移到下一轮调查的随机取样位点(肖文宏等, 2019)。
图1
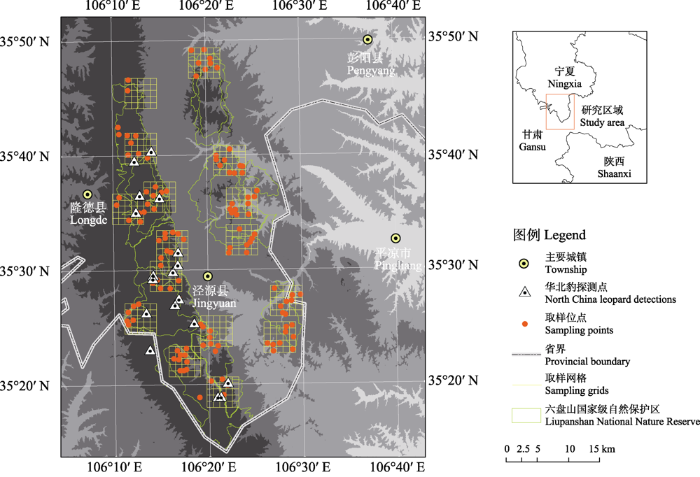
图1
六盘山红外相机布设位点及华北豹探测位点示意图
Fig. 1
Location of camera trap stations and North China leopard detections in the Liupanshan Mountains
在安装红外相机时, 使用两步路app记录相机的具体点位, 在生境调查表中记录取样点的编号、调查人、调查日期、经纬度等基本信息, 生境类型、森林起源、乔木层/灌木层/草本层覆盖度等生境信息由富有野外调查经验的调查员和保护区工作人员, 在以红外相机为中心的20 m样地中, 通过样方调查的方式进行记录(Wang et al, 2015)。本研究中红外相机的工作模式设置为“拍照 + 视频”, 当红外相机被触发, 会连续拍摄3张照片, 然后录制10 s的视频。
本项目第一期(2020年1-3月)共布设了95台红外相机, 第二期(2020年4-8月)布设了75台红外相机, 本研究基于两期共170个红外相机位点数据展开。
2.2 红外相机照片物种识别
回收红外相机的储存卡后, 提取照片位点和拍摄日期等信息, 导出带有每张照片相机编号、拍摄日期、拍摄时间等信息的表格。然后在电脑上查看储存卡中的照片, 识别物种并记录其中文名、数量、性别等信息。
2.3 环境和人类活动数据的获得与提取
我们首先在ArcMap中将研究区域划分为14,480个250 m × 250 m的网格, 提取每个网格的崎岖度、夏季和冬季的归一化植被指数(normalized difference vegetation index, NDVI)、距道路距离、距居民点距离、距农田距离、生物气候变量、农田-自然植被占比、草地占比、草地-灌丛-森林占比、针叶林占比、阔叶林占比共13个变量作为候选的环境协变量(ψ), 并将每个调查位点的取样季节作为探测协变量(p) (表1)。
表1 华北豹占域模型协变量表
Table 1
| 协变量 Covariate | 描述 Description | 数据类型 Data type | 变量类型 Covariate type | 方差膨胀因子 Variance inflation factor |
|---|---|---|---|---|
| 生境因素 Habitat factor | ||||
| 崎岖度 Roughness (ROU) | 250 m × 250 m网格内的崎岖度 Roughness within 250 m × 250 m grids | 连续变量 Continuous | ψ | 1.55 |
| 夏季归一化植被指数 Summer NDVI (SNV) | 夏季(7月)平均NDVI Average NDVI in summer (July) | 连续变量 Continuous | ψ | 1.73 |
| 冬季归一化植被指数 Winter NDVI (WNV) | 冬季(1月)平均NDVI Average NDVI in winter (January) | 连续变量 Continuous | ψ | 1.72 |
| 人类因素 Human factor | ||||
| 距道路距离 Road (ROA) | 距最近道路的距离 Distance to the nearest road | 连续变量 Continuous | ψ | 1.30 |
| 距居民点距离 Residence (RES) | 距最近居民点的距离 Distance to the nearest residence | 连续变量 Continuous | ψ | 1.49 |
| 距农田距离 Cropland (CRO) | 距最近农田的距离 Distance to the nearest cropland | 连续变量 Continuous | ψ | 2.63 |
| 生物气候因素 Bioclimate factor | ||||
| 最冷月最低温 Minimum temperature of coldest month (TMI) | 最冷月最低温 Minimum temperature of coldest month (BIO 6) | 连续变量 Continuous | ψ | 2.09 |
| 最干月降水量 Precipitation of driest month (DPR) | 最干月降水量 Precipitation of driest month (BIO 14) | 连续变量 Continuous | ψ | 1.46 |
| 地表覆盖因素 Landcover factor | ||||
| 农田-自然植被占比 Cropland-natural vegetation percentage (CVP) | 农田-自然植被镶嵌带面积占比* Percentage area of cropland-natural vegetation mixture* | 连续变量 Continuous | ψ | 1.50 |
| 草地占比 Grassland percentage (GRP) | 草地面积占比* Percentage area of grassland* | 连续变量 Continuous | ψ | 1.60 |
| 草地-灌丛-森林占比 Grassland-shrub-forest percentage (GSP) | 草地-灌丛-森林镶嵌带面积占比* Percentage area of grassland-shrub-forest mixture* | 连续变量 Continuous | ψ | 1.23 |
| 针叶林占比 Needle-leaved forest percentage (NEP) | 针叶林面积占比* Percentage area of needle-leaved forest* | 连续变量 Continuous | ψ | 1.69 |
| 阔叶林占比 Broad-leaved forest percentage (BRP) | 阔叶林面积占比* Percentage area of broad-leaved forest* | 连续变量 Continuous | ψ | 2.46 |
| 季节因素 Season factor | ||||
| 季节 Season (SEA) | 生长季(5-10月)或非生长季(11月至次年4月) Growing season (May-October) or non-growing season (November-next April) | 类型变量 Categorical | p | - |
NDVI: 归一化植被指数; ψ代表占域协变量; p代表探测协变量; *变量数值基于1 km范围计算。
NDVI, Normalized difference vegetation index; ψ, Occupancy covariates; p, Detection covariates; * values were calculated within 1 km range.
为检验华北豹对不同地形的利用偏好, 本研究选择用崎岖度作为衡量生境地形的环境协变量, 每个网格的崎岖度等于区域内最高海拔与最低海拔之差, 基于STRM DEM 30 m分辨率高程数据计算。
生态系统中顶级捕食者的分布常受到猎物分布情况的影响, 有研究将猎物的相对多度指数(relative abundance index, RAI)等作为猎物协变量代入模型, 来评估华北豹等捕食者的分布受猎物影响的情况(Yang et al, 2021)。考虑到华北豹的主要猎物如野猪(Sus scrofa) 、狍(Capreolus capreolus)同时受到植被类型、地形地貌、人类活动等因素的影响, 为保证模型能够在较大空间尺度上外推, 本研究选择与地面初级生产力有较强相关性的归一化植被指数、不同植被类型覆盖率等基于遥感数据的协变量来衡量栖息地森林质量, 从而间接衡量华北豹的几种食草动物猎物的分布情况(Pettorelli et al, 2005; Hayward et al, 2006)。六盘山地区为典型的温带气候, 冬夏两季物候变化明显(戴君虎等, 2013), 并且有面积占比近50%的华北落叶松(Larix principis- rupprechtii)针叶林, 林下多覆盖华西箭竹(Fargesia nitida)林等常绿灌木(戴君虎等, 2013)。终年存在的常绿灌木可能会对六盘山的野生动物存在影响, 但灌木被华北落叶松林覆盖, 通过传统的遥感方法难以快速获取其分布情况。考虑到冬季落叶松凋落后的NDVI在一定程度上反映了林下植被, 尤其是箭竹林等常绿灌木的生长分布情况, 我们同时使用了夏季和冬季的NDVI作为华北豹占域的环境协变量, 来代表不同植被类型的栖息地(王荣等, 2021)。通过冬夏两季的NDVI衡量地面植被的分布、生长状况, 能在一定程度上反映这一区域支持华北豹主要猎物生存的能力(Pettorelli et al, 2005)。NDVI数据均来自MODIS Vegetation Index Products, 时空分辨率为16 d/250 m, 从Earthdata检索并下载。地表覆盖类型数据由ESA CCI的300 m分辨率全球地表覆盖地图获取, 提取了以每个取样点为中心、半径1 km缓冲区内的农田-自然植被镶嵌带、草地、草地-灌丛-森林镶嵌带、针叶林等几种植被类型所占地表面积的比例(表1)。
因为六盘山为南北走势的狭长山脉, 不同区域的温度、降水等气候指标存在差异, 为检验华北豹对不同生物气候因素的响应, 本研究下载了WorldClim version 2.1的19个生物气候变量(Fick & Hijmans, 2017)。
2.4 华北豹栖息地利用的占域分析
2.4.1 构建华北豹探测历史
根据物种识别数据构建探测历史表格, 以每5 d为一个重复探测, 5 d内如果拍摄到华北豹, 则记该探测单元的探测结果为1; 如5 d内没有拍摄到华北豹, 则记该单元的探测结果为0。每个探测位点最多进行10次重复探测(即连续探测50 d), 如果相机工作天数超过50 d, 则将50 d之后的探测历史数据拆分为一个新的位点(肖文宏等, 2019)。经过处理和汇总后, 本研究用于后续数据分析的红外相机位点共有256个。
2.4.2 检验变量多重共线性
为避免环境协变量之间的多重共线性对模型构建带来的影响, 使用方差膨胀因子(VIF)检验协变量之间的相关性(Naimi et al, 2014)。本研究选择以VIF < 5为共线性的检验阈值, 认为VIF < 5时变量间不存在多重共线性关系, 并逐步舍去造成VIF > 5的变量(Kock & Lynn, 2012; James et al, 2021)。经过筛选, 最终留下的变量有: 崎岖度、夏季NDVI、冬季NDVI、距道路距离、距居民点距离、距农田距离、最冷月最低温(BIO 6)、最干月降水量(BIO 14)、农田-自然植被占比、草地占比、草地-灌丛-森林占比、针叶林占比和阔叶林占比, 共13个占域协变量和1个探测协变量被用于构建占域模型(表1)。
2.4.3 占域模型的构建与筛选
本研究使用赤池信息指数(Akaike information criterion, AIC)对模型进行选择(James et al, 2021)。首先使用AIC对探测协变量季节进行选择, 发现将季节作为探测变量代入时, 模型的AIC较小, 说明代入探测协变量季节的华北豹占域模型更优。然后使用AIC检验环境协变量与华北豹占域是否存在非线性关系。将协变量标准化后的原始数值、对数变换和二次项变换后的值分别代入占域模型中, 通过模型AIC排序判断各协变量与华北豹占域率之间是否存在非线性关系。经检验, 发现与占域率之间更接近对数关系的协变量为: 距道路距离、最干月降水量、农田-自然植被占比、草地-灌丛-森林占比、针叶林占比和阔叶林占比。其余变量与占域率之间更接近线性关系。最后使用AIC对所有变量组合进行选择。将所有环境协变量的可能组合与探测协变量一起代入构建占域模型, 使用AIC筛选最优模型。所有ΔAIC < 2的模型为等价最优模型(equivalent optimal model) (James et al, 2021), 将这些模型进行加权平均(weighted average), 用于评价华北豹的栖息地利用。本研究中共构建了8,191个占域模型, 并最终筛选出4个等价最优模型(表2)。得到加权平均模型后, 计算每个协变量在模型中的权重, 若协变量权重大于0.5, 则认为该协变量可能对华北豹的空间使用造成显著影响。
表2 华北豹的等价最优占域模型
Table 2
| 模型 Models | 自由度 K | 赤池信息指数 AIC | ΔAIC ΔAIC | 权重 Weight | 占域率 Occurrence rate (ψ) | 探测率 Detection rate (p)* | ||
|---|---|---|---|---|---|---|---|---|
| ψ(SNV, ROA, RES, TMI, DPR, GRP, BRP), p(SEA) | 10 | 309.763 | 0.000 | 0.44 | 0.132 | 0.055/0.004 | ||
| ψ(ROU, WNV, RES, CRO, TMI, CVP, GRP), p(SEA) | 10 | 310.807 | 1.044 | 0.30 | 0.133 | 0.054/0.005 | ||
| ψ(SNV, CRO, TMI, DPR, BRP), p(SEA) | 8 | 311.254 | 1.491 | 0.18 | 0.137 | 0.051/0.004 | ||
| ψ(ROU, WNV, ROA, RES, TMI, DPR, GRP), p(SEA) | 10 | 311.338 | 1.575 | 0.08 | 0.142 | 0.054/0.004 | ||
| 模型加权平均结果 Model weighted average results | 0.135 | 0.053/0.004 | ||||||
*: “/”前后的探测率分别代表非生长季和生长季的平均探测率; 表中协变量缩写含义见
*, Detection rate of non-growing season in front of ‘/’, and detection rate of growing season behind ‘/’. Meaning of covariate abbreviation see
2.5 华北豹的适宜栖息地预测
为了检验华北豹占域模型是否受到空间自相关的影响, 在R中使用Moran指数(Moran’s I)进行空间自相关检验。在3 km之外, 相邻探测位点之间不存在显著的空间自相关, 而在3 km之内相邻红外相机之间存在显著但弱的空间自相关(Moran’s I指数 < 0.15, P < 0.05), 说明占域模型受空间自相关的影响较弱(Dormann et al, 2007)。
基于占域模型结果, 提取研究区域中每个250 m × 250 m网格的环境协变量。在R中使用predict函数, 基于华北豹的占域模型预测其在每个250 m × 250 m网格中的占域率。在ArcMap中生成华北豹占域率在研究区域内的占域率预测图。以华北豹占域率阈值为分界线, 在ArcMap中对华北豹占域率分布图进行重分类, 将占域率介于0与阈值之间的区域定义为非适宜栖息地, 大于阈值的区域定义为适宜栖息地。
2.6 华北豹适宜栖息地斑块景观格局分析
在ArcMap中计算适宜栖息地斑块的面积, 根据面积大小将栖息地斑块分类为极小(1-9 km2)、小(10-99 km2)、中(100-999 km2)、大(1,000-9,999 km2)、极大(> 10,000 km2) (Cao et al, 2019)。之后将适宜栖息地图层导出为栅格图层, 使用Fragstats计算栖息地斑块之间的最短欧氏距离的平均值和标准差。在ArcMap中, 计算六盘山国家级自然保护区边界与华北豹适宜栖息地重叠部分的面积, 并计算与保护区重叠部分的面积占华北豹适宜栖息地面积的比例。
3 结果
3.1 华北豹的分布情况
在2020年1-8月的调查中, 共有24个位点记录到华北豹, 其中独立探测事件36次(图1)。
3.2 华北豹的占域模型与栖息地利用
占域模型中所有变量的参数估计值、标准误、权重和95%置信区间如表3所示。华北豹占域模型的AUC值为0.768, 说明模型表现较好。
图2
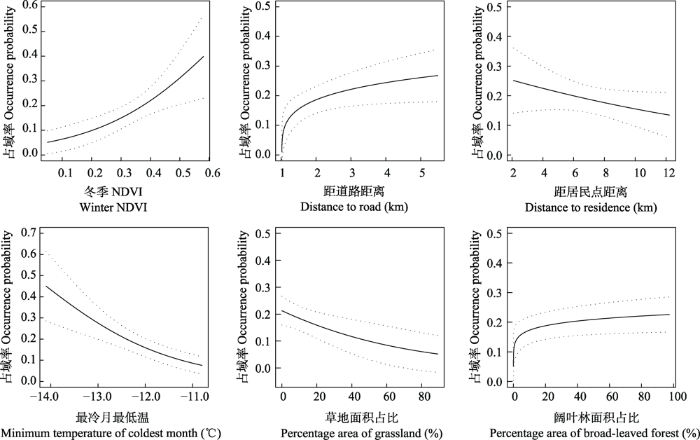
图2
华北豹占域率对不同环境变量的响应曲线
Fig. 2
Response curve of North China leopard’s occurrence probability to different environment covariates
在地表覆盖类型相关因素中, 华北豹的占域率与针叶林占比、阔叶林占比呈正相关, 与草地占比呈负相关, 与草地-灌丛-森林占比无明显相关关系。这说明六盘山的华北豹偏好针叶林、阔叶林覆盖率相对较高的生境, 但会回避草地覆盖率过高的生境, 而对草地-灌丛-森林占比较高的生境则没有明显偏好(图2)。
和人类活动相关的指标中, 六盘山的华北豹对道路和农田表现出显著回避, 但在一定距离范围内(1-10 km)靠近居民点(图2), 并且偏好农田与自然植被二者边缘交界带的生境。
3.3 华北豹的适宜栖息地预测
华北豹适宜栖息地的占域率阈值约0.231。共识别了35个适宜栖息地斑块, 且各斑块之间主要受各级道路的阻隔, 而东西两侧山脉上的栖息地斑块除了受到主要公路阻隔外, 还受到居民区和农田的阻隔(图3)。
图3
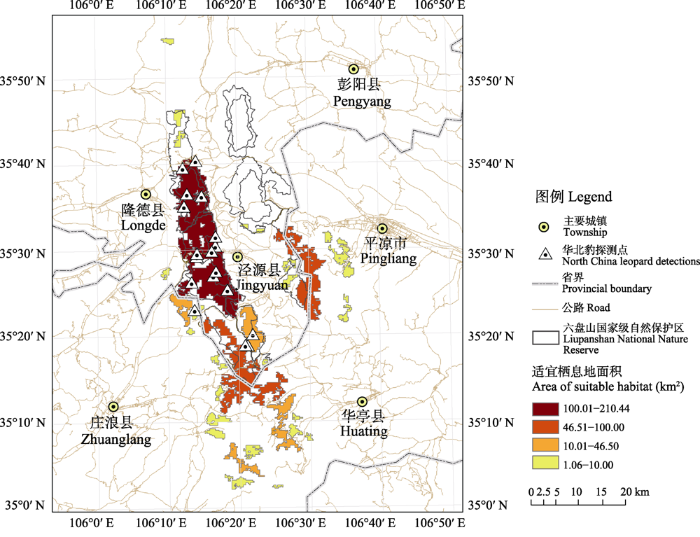
图3
六盘山华北豹适宜栖息地分布图
Fig. 3
North China leopards suitable habitat in the Liupanshan Mountains
适宜栖息地斑块的平均面积为16 km2, 斑块间的平均最近距离约1 km, 东侧和西侧山脉的适宜栖息地斑块间的最近直线距离约5 km。面积大于100 km2的中型斑块有1块, 面积在10-99 km2之间的小型斑块有7块, 面积小于10 km2的极小型斑块有27块。其中最大的斑块为面积214 km2的中型斑块, 位于六盘山西侧山脉, 与六盘山国家级自然保护区的轮廓基本重合(图3)。西侧适宜栖息地在保护区内的面积约占58%, 尚有42%位于保护区外。在六盘山东侧山脉, 华北豹的适宜栖息地主要分布在山脉南部宁夏与甘肃的交界处, 东侧适宜栖息地在保护区内的面积占比较低, 仅有约18% (图3)。整体而言共有约290 km2的适宜栖息地在六盘山国家级自然保护区范围内, 约占所有适宜栖息地面积的55%。
4 讨论
本研究中, 我们通过在六盘山国家级自然保护区内建立红外相机生物多样性监测网络, 开展了以华北豹为主的野生动物调查, 并对华北豹的栖息地利用进行了分析。结果发现华北豹偏好NDVI较高、针叶林占比或阔叶林占比较大的栖息地(图2)。在六盘山及其周边区域, 类似栖息地具有较为成熟的植被群落和较高的基础生产力(Pettorelli et al, 2005), 能够为华北豹的主要猎物狍、林麝(Moschus berezovskii)和野猪等有蹄类提供高质量的栖息环境(Pettorelli et al, 2005; Hayward et al, 2006), 是六盘山完整森林生态系统的基础。与此相对, 华北豹的占域率与草地占比呈负相关(图2, 表3), 这很可能与豹习惯以树木、灌丛作掩护伏击猎物的习性相吻合(Stein et al, 2020)。这些信息说明, 近年来在六盘山及其周边区域开展的退耕还林、天然林保护工程等工作符合华北豹对于栖息地的需求, 对恢复华北豹适宜栖息地、持续推动华北豹的保护工作具有重要意义。
在对人类活动的响应方面, 我们发现六盘山的华北豹表现出对道路和农田的显著回避, 但并未表现出回避居民点(表3, 图3)。这与先前在我国山西铁桥山自然保护区以及在印度卡纳塔克邦得到的豹靠近公路、水田, 回避村庄的结果不同(Athreya et al, 2015; Zhu et al, 2021)。这一差异可能体现了不同区域、不同状况下的豹种群对人类活动的不同响应策略。例如在印度地区, 豹进入农田的目的是捕食家犬和袭击牲畜, 这在豹种群密度较高的区域尤为高发(Athreya et al, 2015)。六盘山地区豹种群密度较小、有蹄类物种丰富, 且当地已推行多年封山禁牧的管理政策, 因此当前华北豹基本不存在袭击牲畜和捕食家犬等行为, 表现为较少进入开阔的农田寻找猎物。但是, 六盘山山势狭长, 保护区与居民区、村庄相邻, 在本研究的现有探测记录中, 有两次华北豹出现在距离村庄不足500 m的记录, 占域模型也发现华北豹有靠近森林-农田边缘交界带的偏好(图2)。结合其他地区豹进入居民区、引起人兽冲突的先例(Inskip & Zimmermann, 2009; Odden et al, 2014), 我们依然需要注意六盘山的华北豹可能在探索和扩张中误入村落、引起极端人兽冲突的可能。
表3 环境协变量与探测协变量对华北豹占域率和探测率的影响
Table 3
| 模型成分 Model component | 协变量 Covariate | 估计值 Estimate | 标准误 SE | 权重 Weight | 95%置信区间 95% confidence interval |
|---|---|---|---|---|---|
| 占域 Occupancy | 截距 Intercept | -3.520 | 5.152 | - | -13.617~6.578 |
| 崎岖度 Roughness | 0.112 | 1.484 | 0.38 | -2.796~3.021 | |
| 夏季NDVI Summer NDVI | 4.180 | 4.934 | 0.18 | -5.490~13.850 | |
| 冬季NDVIWinter NDVI | 3.084 | 2.120 | 0.82 | -1.071~7.239 | |
| 距道路距离 Distance to road | 0.235 | 0.324 | 0.52 | -0.400~0.871 | |
| 距居民点距离 Distance to residence | -1.686 | 2.078 | 0.82 | -5.760~2.388 | |
| 距农田距离 Distance to cropland | 0.296 | 1.665 | 0.48 | -2.967~3.559 | |
| 最冷月最低温 Minimum temperature of coldest month | -3.007 | 1.778 | 1 | -6.493~0.478 | |
| 最干月降水量 Precipitation of the driest month | 0.114 | 0.107 | 0.26 | -0.096~0.324 | |
| 农田-自然植被占比Cropland-natural vegetation percentage | 0.178 | 0.112 | 0.3 | -0.041~0.396 | |
| 草地占比 Grassland percentage | -1.820 | 2.092 | 0.82 | -5.919~2.279 | |
| 阔叶林占比Broad-leaved forest percentage | 0.048 | 0.174 | 0.62 | -0.292~0.389 | |
| 探测 Detection | 截距 Intercept | -1.820 | 0.289 | - | -2.390~1.256 |
| 季节 Season | -2.510 | 0.769 | - | -4.015~-1.000 |
加粗字体表示在加权平均模型中权重高于0.5的协变量。
Covariates in bold text are those with a weight greater than 0.5 in the weighted-averaged model.
基于印度豹(P. p. fusca)、远东豹(P. p. orientalis)等亚种的分析表明, 亚洲地区豹的平均家域大小约为46.5 km2 (Rodríguez-Recio et al, 2022)。然而根据我们的适宜栖息地预测结果, 六盘山华北豹的35个潜在适宜栖息地斑块中, 仅有3个斑块的面积在46.5 km2以上(图3)。本研究识别的面积最大的适宜栖息地斑块有214 km2, 与六盘山国家级自然保护区高度重合, 说明该保护区有效地保护并留存了六盘山区域较连续完整的优质栖息地(图3)。但该栖息地斑块沿山体分布, 形状狭长, 东西方向的最宽处仅约8 km, 加之北方是大面积的半干旱区(卓正大和张宏建, 1987), 我们推测随着华北豹种群数量的持续增长, 新生华北豹在迁移扩散的过程中可能会在南北方向上受阻。与同样有华北豹分布的子午岭区域相比, 六盘山华北豹的占域率明显偏低(Yang et al, 2021), 这同样可能是华北豹种群扩散受到地形限制的结果。因此, 我们建议进行栖息地改造和人类活动管理, 恢复六盘山东西两侧山脉间的栖息地连通性。另外, 由于六盘山并非全部坐落在宁夏境内, 六盘山东侧山脉南端的适宜栖息地有部分落在甘肃境内的平凉市内, 因此我们建议宁夏与甘肃两省的相关单位可以尝试开展联合保护研究工作, 对于六盘山区域华北豹和其他野生动物进行跨省保护, 以期取得更大的生物多样性保护成效。
目前对六盘山华北豹种群的研究存在空白, 本研究的发表有利于增进对六盘山华北豹习性的了解, 并对该种群的保护管理提供科学理论支持。在未来更长期的监测调查中, 更多数据的获取能够提升华北豹栖息地利用等研究的准确程度, 更好地指导这一区域濒危物种的保护工作。
致谢
本研究得到了宁夏固原市六盘山林业局和宁夏六盘山国家级自然保护区的大力支持和协助。研究设计、野外红外相机的布设等工作得到了宋大昭、刘炎林、刘蓓蓓、刁奕欣、翁悦等的支持, 野外工作得到了六盘山国家级自然保护区员工和中国猫科动物保护联盟志愿者的奉献和投入, 部分研究资金得到了阿拉善SEE生态协会的支持, 在此表示最诚挚的谢意!
参考文献
Big cats in our backyards: Persistence of large carnivores in a human dominated landscape in India
DOI:10.1371/journal.pone.0057872 URL [本文引用: 1]
Spotted in the news: Using media reports to examine leopard distribution
Mapping wilderness in China: Comparing and integrating Boolean and WLC approaches
DOI:10.1016/j.landurbplan.2019.103636 URL [本文引用: 1]
Studies on landscape pattern of Liupan Mountains and the relationship with main climate factors
DOI:10.11821/dlyj201312017
[本文引用: 3]

Based on Landsat TM Image, vegetation field survey data and meteorological data, we derived the distribution patterns of vegetation types, temperature and precipitation in Liupan Mountains by using image classification methods and regression analysis method. Subsequently, we analyzed the changes of landscape pattern in three transects with different climate conditions. The results showed that the annual mean temperatures in Liupan Mountains vary at different altitudes, ranging from 0.8℃ to 7.0℃, (the mean temperature lapse rate is 0.51℃/100m). The annual precipitation ranges from 599 mm in northwest region to 770 mm in southeast region. In the vertical direction, the precipitation tends to increase as the altitude increases and then begin to decrease when the altitude is more than 2502 m. The main vegetation type in Liupan Mountains is warm temperate deciduous broad-leaved forest. However, as the precipitation decreases from southeast to northwest, there is a tendency in vegetation types from forest to steppe. Therefore, precipitation is dominant factor affecting the vegetation landscape pattern in arid area of Northwest China. The conclusion is helpful for people to understand the mechanism of ecological response to climate changes and it can also provide scientific basis for regional ecological construction.
六盘山景观格局及与主要气候因子的关系
DOI:10.11821/dlyj201312017
[本文引用: 3]
以六盘山为研究区,根据野外植被调查资料、Landsat TM影像和气象数据,利用遥感影像分类方法、回归分析方法等,在研究区从南向北选取三条东西走向的等大、平行样区,系统研究景观格局与主要气候要素之间的关系。结果表明:六盘山地区年平均气温为0.8℃-7.0℃,主要受高程控制,气温直减率为0.51℃/100 m;降水量为599-770 mm,在水平方向上东南多、西北少;在垂直方向上,先随着海拔高度上升而增加,至最大降水高度(2502 m)后呈下降趋势。六盘山地区主要植被类型为暖温带落叶阔叶林,随着南至北降水量的逐步减少,植被类型有从森林经由灌丛草甸向草原过渡的趋势,北部草原成分逐渐增加。因此区域降水条件对西北干旱区的植被格局起到决定性作用。该结论有助于理解气候变化背景下生态系统的响应机理,可为区域生态建设提供理论依据。
Methods to account for spatial autocorrelation in the analysis of species distributional data: A review
DOI:10.1111/j.2007.0906-7590.05171.x URL [本文引用: 1]
The megabiota are disproportionately important for biosphere functioning
DOI:10.1038/s41467-020-14369-y
PMID:32019918
[本文引用: 1]
A prominent signal of the Anthropocene is the extinction and population reduction of the megabiota-the largest animals and plants on the planet. However, we lack a predictive framework for the sensitivity of megabiota during times of rapid global change and how they impact the functioning of ecosystems and the biosphere. Here, we extend metabolic scaling theory and use global simulation models to demonstrate that (i) megabiota are more prone to extinction due to human land use, hunting, and climate change; (ii) loss of megabiota has a negative impact on ecosystem metabolism and functioning; and (iii) their reduction has and will continue to significantly decrease biosphere functioning. Global simulations show that continued loss of large animals alone could lead to a 44%, 18% and 92% reduction in terrestrial heterotrophic biomass, metabolism, and fertility respectively. Our findings suggest that policies that emphasize the promotion of large trees and animals will have disproportionate impact on biodiversity, ecosystem processes, and climate mitigation.
Trophic downgrading of planet earth
DOI:10.1126/science.1205106
PMID:21764740
[本文引用: 2]
Until recently, large apex consumers were ubiquitous across the globe and had been for millions of years. The loss of these animals may be humankind's most pervasive influence on nature. Although such losses are widely viewed as an ethical and aesthetic problem, recent research reveals extensive cascading effects of their disappearance in marine, terrestrial, and freshwater ecosystems worldwide. This empirical work supports long-standing theory about the role of top-down forcing in ecosystems but also highlights the unanticipated impacts of trophic cascades on processes as diverse as the dynamics of disease, wildfire, carbon sequestration, invasive species, and biogeochemical cycles. These findings emphasize the urgent need for interdisciplinary research to forecast the effects of trophic downgrading on process, function, and resilience in global ecosystems.
WorldClim 2: New 1-km spatial resolution climate surfaces for global land areas
DOI:10.1002/joc.5086 URL [本文引用: 1]
Unmarked: An R package for fitting hierarchical models of wildlife occurrence and abundance
irr: Various Coefficients of Interrater Reliability and Agreement
An investigation of leopards in Liupan Mountain Nature Reserve
宁夏六盘山自然保护区金钱豹资源初步调查
Prey preferences of the leopard (Panthera pardus)
DOI:10.1111/j.1469-7998.2006.00139.x URL [本文引用: 3]
Mechanistic insights into the role of large carnivores for ecosystem structure and functioning
DOI:10.1111/ecog.05191 URL [本文引用: 3]
Human-felid conflict: A review of patterns and priorities worldwide
DOI:10.1017/S003060530899030X URL [本文引用: 1]
Leopard (Panthera pardus) status, distribution, and the research efforts across its range
Behavioural correlates of predation by tiger (Panthera tigris), leopard (Panthera pardus) and dhole (Cuon alpinus) in Nagarahole, India
DOI:10.1111/j.1469-7998.2000.tb01076.x URL [本文引用: 1]
Lateral collinearity and misleading results in variance-based SEM: An illustration and recommendations
The current distribution and status of leopards Panthera pardus in China
DOI:10.1017/S0030605315000988 URL [本文引用: 1]
Estimating site occupancy rates when detection probabilities are less than one
Megafauna and ecosystem function from the Pleistocene to the Anthropocene
Where is positional uncertainty a problem for species distribution modelling?
DOI:10.1111/j.1600-0587.2013.00205.x URL [本文引用: 1]
Adaptable neighbours: Movement patterns of GPS-collared leopards in human dominated landscapes in India
Spacing and activity patterns of leopards Panthera pardus in the Royal Bardia National Park, Nepal
DOI:10.2981/0909-6396(2005)11[145:SAAPOL]2.0.CO;2 URL [本文引用: 1]
Statistical inference from capture data on closed animal populations
Using the satellite-derived NDVI to assess ecological responses to environmental change
DOI:10.1016/j.tree.2005.05.011
PMID:16701427
[本文引用: 4]
Assessing how environmental changes affect the distribution and dynamics of vegetation and animal populations is becoming increasingly important for terrestrial ecologists to enable better predictions of the effects of global warming, biodiversity reduction or habitat degradation. The ability to predict ecological responses has often been hampered by our rather limited understanding of trophic interactions. Indeed, it has proven difficult to discern direct and indirect effects of environmental change on animal populations owing to limited information about vegetation at large temporal and spatial scales. The rapidly increasing use of the Normalized Difference Vegetation Index (NDVI) in ecological studies has recently changed this situation. Here, we review the use of the NDVI in recent ecological studies and outline its possible key role in future research of environmental change in an ecosystem context.
Status and ecological effects of the world’s largest carnivores
Predator interactions, mesopredator release and biodiversity conservation
Estimating global determinants of leopard home range size in a changing world
Trophic cascades in terrestrial systems: A review of the effects of carnivore removals on plants
DOI:10.1086/303311
PMID:10686157
[本文引用: 1]
We present a quantitative synthesis of trophic cascades in terrestrial systems using data from 41 studies, reporting 60 independent tests. The studies covered a wide range of taxa in various terrestrial systems with varying degrees of species diversity. We quantified the average magnitude of direct effects of carnivores on herbivore prey and indirect effects of carnivores on plants. We examined how the effect magnitudes varied with type of carnivores in the study system, food web diversity, and experimental protocol. A metaanalysis of the data revealed that trophic cascades were common among the studies. Exceptions to this general trend did arise. In some cases, trophic cascades were expected not to occur, and they did not. In other cases, the direct effects of carnivores on herbivores were stronger than the indirect effects of carnivores on plants, indicating that top-down effects attenuated. Top-down effects usually attenuated whenever plants contained antiherbivore defenses or when herbivore species diversity was high. Conclusions about the strength of top-down effects of carnivores varied with the type of carnivore and with the plant-response variable measured. Vertebrate carnivores generally had stronger effects than invertebrate carnivores. Carnivores, in general, had stronger effects when the response was measured as plant damage rather than as plant biomass or plant reproductive output. We caution, therefore, that conclusions about the strength of top-down effects could be an artifact of the plant-response variable measured. We also found that mesocosm experiments generally had weaker effect magnitudes than open-plot field experiments or observational experiments. Trophic cascades in terrestrial systems, although not a universal phenomenon, are a consistent response throughout the published studies reviewed here. Our analysis thus suggests that they occur more frequently in terrestrial systems than currently believed. Moreover, the mechanisms and strengths of top-down effects of carnivores are equivalent to those found in other types of systems (e.g., aquatic environments).
Top predators as conservation tools: Ecological rationale, assumptions, and efficacy
DOI:10.1146/annurev.ecolsys.39.110707.173545 URL [本文引用: 1]
Home range size and daytime habitat selection of leopards in Huai Kha Khaeng Wildlife Sanctuary, Thailand
DOI:10.1016/j.biocon.2008.06.015 URL [本文引用: 1]
ROCR: Visualizing classifier performance in R
DOI:10.1093/bioinformatics/bti623
PMID:16096348
[本文引用: 1]
ROCR is a package for evaluating and visualizing the performance of scoring classifiers in the statistical language R. It features over 25 performance measures that can be freely combined to create two-dimensional performance curves. Standard methods for investigating trade-offs between specific performance measures are available within a uniform framework, including receiver operating characteristic (ROC) graphs, precision/recall plots, lift charts and cost curves. ROCR integrates tightly with R's powerful graphics capabilities, thus allowing for highly adjustable plots. Being equipped with only three commands and reasonable default values for optional parameters, ROCR combines flexibility with ease of usage.http://rocr.bioinf.mpi-sb.mpg.de. ROCR can be used under the terms of the GNU General Public License. Running within R, it is platform-independent.tobias.sing@mpi-sb.mpg.de.
Using camera trap to monitor a North Chinese leopard (Panthera pardus japonesis) population and their main ungulate prey
DOI:10.3724/SP.J.1003.2014.14198 URL [本文引用: 1]
山西晋中庆城林场华北豹及其主要猎物种群的红外相机监测
DOI:10.3724/SP.J.1003.2014.14198
[本文引用: 1]
华北豹(Panthera pardus japonesis)是中国特有的豹亚种。由于长期缺乏有效的科学调查, 目前对其分布、种群及动态、行为、猎物现状等基础信息不清。在2007-2014年期间, 本研究应用红外相机技术(camera trap)对山西晋中庆城林场的华北豹种群开展了长达7年的连续监测。先后监测到14只华北豹, 其中成年个体11只(3♀, 8♂), 幼体3只, 成年雌雄比例为0.375; 在其间出现了2次繁殖。该区域主要的有蹄类猎物为野猪(Sus scrofa)和西伯利亚狍(Capreolus pygargus), 其相对密度分别为4.16和3.48, 绝对密度分别为1.35只/km<sup>2</sup>和3.61只/km<sup>2</sup>。
Panthera pardus (amended version of 2019 assessment)
Shared resources between giant panda and sympatric wild and domestic mammals
DOI:10.1016/j.biocon.2015.03.032 URL [本文引用: 1]
Phenology zonal variation of vegetation and its response to climate change in Liupan Mountains
六盘山山地植被物候地带性分异及其对气候变化的响应
Using occupancy models in wildlife camera- trapping monitoring and the study case
DOI:10.17520/biods.2018195 URL [本文引用: 3]
占域模型的原理及在野生动物红外相机研究中的应用案例
DOI:10.17520/biods.2018195
[本文引用: 3]
占域模型解决了探测率常常被忽略的问题, 所需数据要求简单, 具有数据来源广泛、经济高效等优点, 越来越多地应用在野生动物监测和研究中。本文综述了占域模型的概念、基本原理及其近年来在国内外的应用进展, 并以红外相机数据为基础, 总结了占域模型所要求的数据采集、处理和分析等流程和基本原则, 同时以广东车八岭国家级自然保护区的花面狸(Paguma larvata)作为研究案例, 展示了占域模型的数据分析过程。最后根据近年来的发展和应用, 总结了占域模型的应用范围和发展趋势以及研究中存在的主要问题。
Elusive cats in our backyards: Persistence of the North Chinese leopard (Panthera pardus japonensis) in a human-dominated landscape in central China
DOI:10.1111/1749-4877.12482 URL [本文引用: 2]
Endanger factors and protection countermeasure of rare and endangered plants of Liupan Mountain Natural Reserve
六盘山国家级自然保护区珍稀濒危植物濒危原因分析及保护对策
Population density and driving factors of North China leopards in Tie Qiao Shan Nature Reserve
DOI:10.3390/ani11010001 URL [本文引用: 1]
