


近年来, 人类活动与气候变化的加剧使得全球范围内的生物多样性面临前所未有的威胁(Díaz et al, 2006; Barnosky et al, 2011; Dirzo et al, 2014)。鉴于此, 全球已有196个缔约方签署了联合国《生物多样性公约》(Convention on Biological Diversity, CBD), 以阻止生物多样性的进一步丧失(Hoban et al, 2020)。快速、准确地评估生物多样性是支撑生物多样性保护工作的必要前提。为此, 地球观测组织生物多样性观测网络(The Group on Earth Observations Biodiversity Observation Network, GEO BON)提出了一套评估生物多样性的核心监测指标(Essential Biodiversity Variables, EBVs), 旨在建立全球统一、协调且有效的生物多样性监测标准。
传统的生物多样性监测主要以实地调查为主, 存在调查范围有限、耗时耗力等缺点。遥感技术可对地球系统进行大范围、长时间序列的观测, 为EBVs指标的生物多样性监测提供了可靠的数据来源。近年来, 随着遥感传感器类型的不断丰富和性能的不断提升, 海量可共享的卫星遥感数据得以积累; 通过遥感技术实现EBVs观测数据的获取, 在生物多样性监测研究中得到了越来越多的关注。
我国是生物多样性最为丰富的国家之一, 保护生物多样性已被纳入国家发展战略。然而, 广阔的地域以及复杂的地理空间格局为实现全国范围的生物多样性调查带来了极大的挑战。利用遥感技术进行EBVs的有效观测为上述难题提供了一种具有潜力的解决方案。采用遥感手段在整个中国范围内对生物多样性的核心监测指标进行连续监测, 能够在一定程度上填补生物多样性地面监测的时空覆盖数据空白。加强中国EBVs领域的研究, 尤其是促进EBVs指标与遥感技术研究的结合, 对于中国融入到全球生物多样性保护和评估体系将起到重要的推动作用。目前国内相关研究主要集中在单一EBVs指标的观测上(例如: 生态系统功能中的初级生产力), 如何采用遥感技术进行更全面、更完善的EBVs监测, 仍有待深入研究。基于此, 本文系统性地阐述了遥感技术在各个EBVs类别监测中的应用, 对目前遥感生物多样性产品的优先排序标准进行了更新, 构建了中国EBVs遥感监测产品体系, 并探讨了中国EBVs遥感监测中的不足与发展潜力, 为促进中国EBVs研究的进一步发展提供一定的参考支持。
1 生物多样性核心监测指标(EBVs)简介
生物多样性核心监测指标被定义为一套用于捕捉生物多样性变化的最核心的测量指标集。EBVs是进行研究、报告、管理生物多样性变化的重要测量手段, 是全球生物多样性信息基础建设的关键组成部分。它与其他环境变化监测计划相互补充, 共同构成全球监测计划的基础。EBVs指标分别从分子水平、物种水平、群落水平到生态系统水平对生物多样性进行描绘, 细分为20个子类, 可归纳为6个大类, 分别为遗传组成、物种种群、物种性状、群落组成、生态系统功能与生态系统结构(
图1
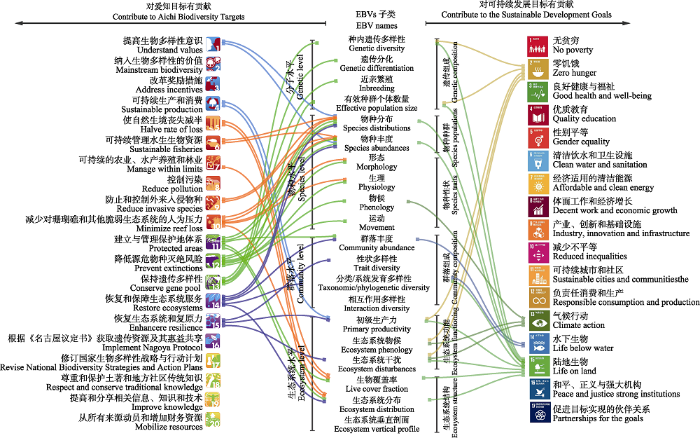
图1
EBVs子类与《生物多样性公约》爱知目标及可持续发展目标的关系
Fig. 1
The relationship of Essential Biodiversity Variables (EBVs) names to Aichi Biodiversity Targets and the United Nations Sustainable Development Goals (SDGs)
2 EBVs遥感研究概况
EBVs的6大类别从不同尺度对生物多样性进行描绘, 由于它们的观测尺度、观测对象有所不同, 因此不同类别的EBVs在最佳的遥感观测方式上存在差异。由于遗传组成无法通过遥感进行直接监测, 因此本章只总结当前遥感在“物种种群” “物种性状” “群落组成” “生态系统功能”和“生态系统结构” 5个类别的研究情况。
2.1 物种种群
物种种群(species populations)的动态即物种地理分布和时空丰度的变化, 代表了生物多样性及其变化的最基本的方面之一。物种种群EBVs可分为2个子类, 分别为物种分布和物种丰度。物种分布与丰度的变化是生态系统功能与服务变化的关键驱动因素。物种分布、物种丰度以及它们的空间聚集或物种属性的组合, 共同代表了物种种群EBVs类别(Jetz et al, 2019)。
传统的物种种群调查数据存在时空覆盖不连 续等问题(Proença et al, 2017)。因此, 在没有长时间尺度和大范围生物多样性监测计划的情况下, 基于遥感的物种分布/丰度模型(species distribution models/species abundance models, SDMs/SAMs)可以提供一种替代性的、在较大时空尺度上的物种分布与丰度估算。卫星遥感平台能够获取全球覆盖范围、具有高重访周期的中高分辨率数据, 如MODIS、Landsat、Sentinel、GF等系列卫星数据。这些数据可以提供气候、地形等环境信息, 作为SDMs/SAMs的输入。与此同时, 遥感数据获取的生态系统功能属性能够较为灵敏地反映生态系统对环境变化的响应, 同样可以作为模型的预测因子, 它们提供了与碳(如植被绿度)、水循环(如蒸散发)、能量平衡(如地表温度和反照率)有关的生态系统过程和功能的信息(Arenas-Castro et al, 2019)。将生态系统功能属性纳入SDMs/SAMs可以提高预测能力和可转移性。遥感数据的物种分布/丰度模型为入侵物种、珍稀物种的分布与丰度以及生物多样性研究提供了更为准确的参考。
2.2 物种性状
物种性状(species traits)被定义为一个物种所有生物的特征, 如重量、高度等。目前, 物种性状EBVs被分为4个子类, 分别是形态、生理、物候、运动。在物种性状的遥感监测中, 可能会出现与群落组成、生态系统结构和功能EBVs子类的遥感研究相混淆的情况。因此, 首先要界定物种性状的监测对象——只有对生物个体或由同种生物组成的种群的性状监测可以视为物种性状的监测, 而包含多物种的性状监测则属于群落组成、生态系统结构和功能EBVs子类的研究范围。
在物种性状的遥感监测中, 搭载不同传感器的近地面遥感平台可以获取较高的空间分辨率, 成为“物种性状”测量中最常用的观测平台。激光雷达(Light Detection and Ranging, LiDAR)可以快速、准确地获取地物的三维点云数据, 因此可以获取多种表征物种形态性状的参数(郭庆华等, 2014)。以树木为例, 可以获取个体到种群的树高、冠幅、胸径、材积、枝干形状等形态学信息(Dalla Corte et al, 2020; Slavík et al, 2020; Liu et al, 2021; Pinton et al, 2021; Xu et al, 2021)。高光谱传感器具有十分丰富的光谱信息, 其纳米级光谱分辨率为物种的叶绿素含量、叶面积指数、元素含量等生理生化性状的精确探测提供了可能(Ye et al, 2018; Jiao et al, 2021; Zhang JJ et al, 2021)。近地面遥感平台(无人机、高塔等)搭载物候相机, 构建物候观测网络, 能够探测到植物物候更加精细的变化, 可以达到每日或每半日的时间分辨率(Hufkens et al, 2012; Zhao et al, 2012; Hmimina et al, 2013; Nasahara & Nagai, 2015; Liu Y et al, 2017)。无人机、飞艇等平台搭载高分辨率影像与视频传感器, 能够对陆地大型动物迁徙模式进行调查(Su et al, 2018); 也能够对浅海中海洋动物的捕食行为(Butcher et al, 2021)以及运动模式(Ruiz-García et al, 2020)进行监测。
机载平台搭载激光雷达与成像光谱仪, 能够对区域尺度的物种形态与生理性状进行相对精细的监测。针对全球尺度的“物种性状”监测, 目前Wordview、GF等系列卫星具有较高的空间分辨率,然而想要在全球尺度上进行丰富的物种性状监测, 仍然需要提出新的星载成像光谱仪与LiDAR发射计划来弥补这一需求与技术之间的差距(Skidmore et al, 2021)。
2.3 群落组成
群落组成(community composition)主要描述的是定义空间区域内(例如网格单元或生态系统类型的整个范围)生态系统的生物组成多样性, 包括4个子类, 分别为群落多度、分类/系统发育多样性、性状多样性以及相互作用多样性。
机载平台搭载成像光谱仪是“群落组成”研究中应用广泛的一种观测方式(Féret & Asner, 2014; Gholizadeh et al, 2018), 主要以冠幅较大的森林作为研究对象, 可对群落多度、分类/系统发育多样性、性状多样性3个“群落组成”的EBVs子类进行研究。激光雷达提供的三维点云信息能够精细地定位群落的个体信息, 因此有众多研究同时结合高光谱与激光雷达, 能够获取更为准确的群落组成结果(Hakkenberg et al, 2018; Zhao et al, 2018)。虽然目前已有部分研究通过机载平台进行了草地群落组成的量化(Gholizadeh et al, 2018; Rossi et al, 2022), 但草地植物个体规模小, 物种混杂程度高, 机载平台并不是最佳的草地群落组成观测平台。而无人机由于其平台飞行高度较低, 能够提供更高空间分辨率的观测数据, 因此被越来越多地应用到草地群落组成的研究中(Conti et al, 2021; Zhao et al, 2021)。
结合卫星遥感数据与SVH能够估算大尺度的群落多度以及α、β多样性等指标(Rocchini et al, 2016; Madonsela et al, 2017; Rocchini et al, 2021; Sun et al, 2021), 然而由于大部分卫星遥感数据的光谱分辨率有限, 因此在精度上存在一定的局限性。与此同时, 众多研究利用卫星遥感获取生境因子以及生态系统功能属性, 并与实地测量的植被、哺乳动物、鸟类等物种多样性数据进行建模, 从而推测整个研究区域内的物种多样性与分布格局。针对植被性状多样性的研究中, 越来越多的学者探讨了卫星遥感在功能多样性研究上的可行性(Jetz et al, 2016; Rocchini et al, 2018; Rossi et al, 2020; Frye et al, 2021)。目前已有Sentinel系列、GF系列、GEDI等卫星均可用于植被性状多样性的研究, 随着地球观测的不断发展, 植被性状多样性的研究将不断完善。
2.4 生态系统功能
生态系统功能(ecosystem functioning)指生态系统所体现的各种功效或作用, 主要表现在物质生产、能量流动、物质循环和信息传递等方面(方精云和刘玲莉, 2021)。在GEOBON对该类别的描述中分为初级生产力、生态系统物候、生态系统干扰3个子类。
在2.2节“物种性状”提到的物候与初级生产力等相关性状的监测中, 主要观测对象为个体和种群。而本节主要关注生态系统水平的监测, 因此相较于近地面与机载平台, 卫星遥感具有更大的观测范围, 能够对生态系统进行宏观且全面的监测, 其中星载多光谱遥感数据是生态系统功能研究中最为常用的数据来源。
目前, 针对初级生产力的EBVs遥感研究中, 总/净初级生产力(gross/net primary production, GPP/NPP)是反映初级生产力的直接指标, 而叶面积指数、叶绿素含量、光合有效辐射分量(fraction of absorbed photosynthetically active radiation, FAPAR)、叶片营养指标(如氮磷钾含量、比叶面积)等一系列间接指标也能够在一定程度上反映初级生产力。根据上述指标, 结合卫星多光谱遥感数据与站点通量数据, 采用经验模型、物理模型、机器学习模型等, 现有研究已生产了一系列的全球尺度的遥感产品(Yu et al, 2018; Fang et al, 2019)。
生态系统物候是判断生态系统应对气候变化的有力指标。在过去几十年中, 通过卫星采集的遥感数据, 已开发了众多的地表物候产品, 目前这些地表物候产品的数据源包含AVHRR、MODIS、Sentinel-2、VIIRS等卫星数据。MODIS具有较高的时间分辨率(每日), 因此以MODIS为数据源的物候产品类型较多, 如MODIS全球物候产品(MCD12Q2)等; AVHRR (1981年开始)与MODIS (2001年开始)相比具有更长期、多年代的数据, 结合AVHRR与MODIS能够获取更长时间序列的物候产品(Reed et al, 1994; Ganguly et al, 2010)。由于Sentinel-2与VIIRS具有较高的分辨率, 因此它们在生态系统物候监测中具有很大的潜力(Liu LL et al, 2017; Vrieling et al, 2018)。
生态系统干扰通常会导致生态系统的功能突然偏离其正常动态, 其类型包括水、火、雪、病虫害等造成的自然灾害, 也包括砍伐、放牧、土地利用结构改变等人为干扰(陈利顶和傅伯杰, 2004)。目前公开的星载遥感数据(Sentinel-1/-2、Landsat TM/ETM+/OLI、AVHRR和MODIS)能够在区域和全球尺度绘制大规模林分范围和位置, 并通过探测植被绿度、叶面积以及水分的变化, 从而反映如火灾、土地利用变化、砍伐等干扰的强度与范围; 且自上世纪70年代起就可获取Landsat数据, 可以进行长时间序列的干扰以及生态系统恢复的研究(Frolking et al, 2009; Xiao et al, 2019)。激光雷达、合成孔径雷达(Synthetic Aperture Radar, SAR)等遥感数据可以对上述可见近红外数据进行补充, 它们能够对生态系统扰动造成的生物量和冠层结构的变化进行更准确的评估(Frolking et al, 2009)。目前公开的生态系统干扰的数据产品有火灾(Justice et al, 2002; Hargrove et al, 2009; Jolly et al, 2015)、洪水(Tellman et al, 2021)、病虫害(Meddens & Hicke, 2014)、土地利用变化(Liu et al, 2020)等。
2.5 生态系统结构
生态系统结构(ecosystem structure)包含了形成并维持生物多样性的生态系统结构的各类参数。在GEOBON对生态系统结构EBVs类别的描述中, 分为3个有代表性的子类: 生物覆盖度、生态系统分布和生态系统垂直剖面。
生物覆盖度子类与生态系统分布子类描述的是生态系统在水平方向的特征, 而生态系统垂直剖面描述的是生态系统在垂直方向的特征。对植被面积指数(Plant Area Index Profile, PAI)剖面的研究, 已经超出了传统光学传感器的能力, LiDAR作为绝佳的数据获取手段能够计算获取植被面积指数的垂直分布(Liu J et al, 2017)。由于星载激光雷达数据的足迹覆盖有限, 不易获取生态系统的剖面信息, 因此植被高度作为重要的垂直信息备受关注。众多学者采用卫星光学影像(MODIS、Sentinel-2等)、雷达影像(PALSAR、Sentinel-1等)或二者的结合, 以星载激光雷达足迹作为输入数据, 通过参数回归或机器学习模型进行大范围的冠层高度数据产品的获取(Potapov et al, 2021); 也有研究开发新的基于神经网络的插值方法, 采用ICESat-2与GEDI激光雷达数据结合海量地面与无人机激光雷达数据, 得到了国家尺度的高精度森林冠层高度产品(Liu et al, 2022)。
3 EBVs文献数量调研分析
以“Essential Biodiversity Variables”为关键词在Web of Science上对研究年份进行统计, 可以看出自2013年EBVs概念提出以来, 研究热度不断上升; 鉴于遥感技术是大尺度EBVs研究的有效手段, 以“remote sensing” + “Essential Biodiversity Variables”为主题词进行搜索统计, 发现相关研究数量逐年攀升, 但整体数量仍然较小, 如图2所示。
图2
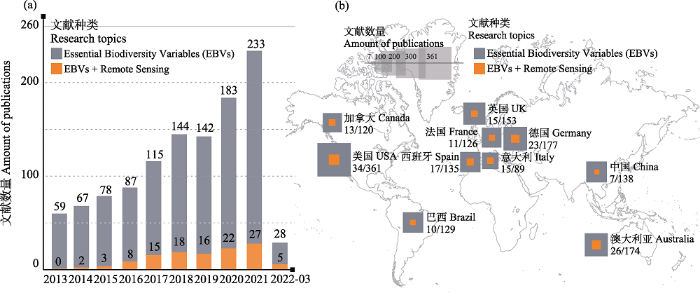
图2
基于文献汇总的生物多样性核心监测指标(EBVs)遥感研究发展情况
Fig. 2
The overview of the publications on Essential Biodiversity Variables (EBVs) field and remote sensing research within EBVs
将“Essential Biodiversity Variables”作为主题词, 以国家为单位进行论文数量统计, 中国的论文数量位列世界第五, 在国际上处于较为领先的水平。然而相对于其他国家来说, 采用遥感手段进行EBVs的研究并未得到我国学者足够的重视(图2)。在中国, “remote sensing” + “Essential Biodiversity Variables”的研究文章数量, 仅占该领域研究数量的5%。
与此同时, 本文通过结合EBVs子类名称与“remote sensing”作为关键词进行文献搜索(如“species distributions” + “remote sensing” “primary product” + “remote sensing”), 并按照EBVs大类进行统计, 如图3所示。在文献检索过程中, 其中由于物种性状的子类可能与生态系统功能的子类存在一定的混淆, 因此在物种性状子类的文献调研中, 增加“species”作为关键词(例如在“morphology EBVs”子类的文献调研中, 检索关键词为“morphology” + “remote sensing” + “species”)。与物种以及群落层面的遥感研究相比, 我国在生态系统层面的遥感研究较为深入。我国针对EBVs子类的遥感研究数量占全球EBVs子类的遥感文章总数的32%。可以看出, 我国对于EBVs子类的遥感研究相对较为深入。
图3
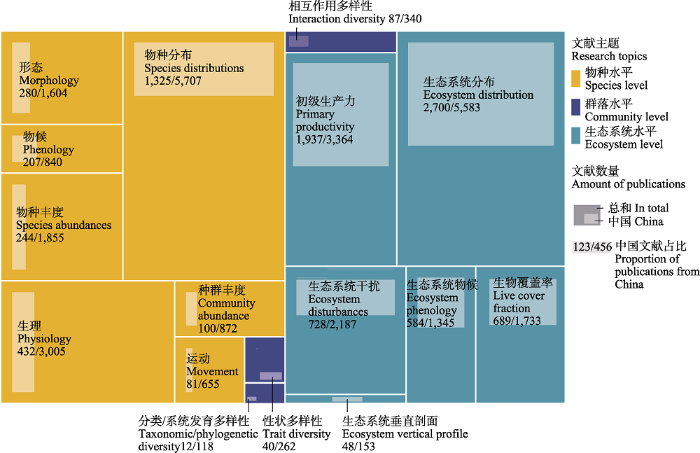
图3
中国生物多样性核心监测指标(EBVs)子类遥感研究文章数量占比情况
Fig. 3
The proportion of the publications from China in the field of Essential Biodiversity Variables (EBVs) names
然而, 相较于EBVs子类与遥感相结合的研究,以“Essential Biodiversity Variables” + “remote sensing”为主题词, 我国的研究仅占全球研究数量的5%, 可以推断目前这些研究彼此相对割裂, 并未从EBVs指标角度进行系统的考虑。
4 构建中国EBVs遥感监测产品体系
4.1 遥感生物多样性产品的优先排序标准更新
随着人类活动与气候变化的加剧, 生物多样性正经历着前所未有的快速变化, 因此实现宏观、周期性调查与观测对于了解中国生物多样性现状以及变化具有十分重要的意义。然而目前我国十分缺乏系统性的EBVs遥感研究, 尤其缺乏一套能够覆盖全国的EBVs遥感监测数据集指标。
Skidmore等(2021)提出了四项原则(表1原则1-4), 帮助对EBVs遥感产品进行选择, 但这四项原则多聚焦于遥感数据在生物多样性监测中的有效性, 未直接考虑可重复性这一指标。对生物多样性的监测而言, 单一时期的本底调查固然重要, 但是周期性的生物多样性监测对生物多样性变化探测及保护具有非常重要的意义。遥感产品可按照预期进行规律性的获取也是EBVs遥感监测数据集的重要筛选原则, 因此本文将数据的“可重复性”放到与上述四项原则并列的位置(表1原则5)。“可重复性”主要描述的是遥感生物多样性产品在未来预期能够按照一定时间分辨率获取的能力。本文根据Skidmore等(2021)所提出的四项原则对目前覆盖中国的EBVs遥感产品进行了筛选, 并对它们的“可重复性”进行打分(表2)。“可重复性”的评分范围在1-3分。1分表示“可重复性”好, 该项遥感生物多样性产品具有成熟的遥感卫星基础, 完善的数据处理能力, 目前已存在权威机构采用统一的标准并以一定的时间间隔进行较高质量的生产, 且在未来数年内能够保持该频率进行生物多样性遥感产品的生产。3分表示“可重复性”较差, 目前完全缺乏相关的遥感卫星基础设施, 尚不具备该数据产品的生产能力, 还需要大量的研究和开发工作。
表1 遥感生物多样性产品的优先排序标准更新(修改自Skidmore等(2021))
Table 1
| 序号 Number | 优先原则 Prioritization criteria | 描述 Description |
|---|---|---|
| 1 | 关联性 Relevance | 遥感生物多样性产品的使用目的与方法决定了关联性的强弱。主要关注以下方面与遥感生物多样性产品的相关性: (1)管理问题; (2)为CBD目标提供信息; (3)为SDGs提供信息; (4)为生物多样性和生态系统服务政府间科学政策平台(IPBES)的风险评估过程提供数据。It is known who wants the remote sensing biodiversity product, what they will do with it and how it will be used. The remote sensing biodiversity product is relevant: (1) for management questions; (2) to inform the CBD targets; (3) to inform the SDGs; and (4) to provide data for the IPBES risk assessment processes. |
| 2 | 可行性 Feasibility | 可行性这一标准考虑了遥感数据的可用性、获取数据的便利性、遥感在时空尺度的完整性以及数据整合与分析的便利性和经济性。This criterion considers the availability of remote sensing data, the ease of access to such data, the completeness of remote sensing in space and time and the ease and affordability of data integration and analysis. |
| 3 | 准确性(遥感状态) Accuracy (remote sensing status) | 准确性是指衡量某一遥感生物多样性产品观测准确性的标准, 该标准考虑了遥感数据以及获取精准遥感生物多样性产品技术的有效性。A measure of the current activity for the accurate observation of a given remote sensing biodiversity product. This criterion considers the effectiveness of remote sensing data and techniques to achieve an accurate and precise value of the remote sensing-enabled biodiversity product. |
| 4 | 成熟度(遥感状态) Maturity (remote sensing status) | 成熟度这项标准指的是目前遥感生物多样性产品是否成熟且其程度如何, 即有能力生产遥感生物多样性产品的组织/机构是否可以向资助机构提出产品生产建议, 以及该项任务完成的难度如何。Maturity refers to the maturity and status of the current remote sensing biodiversity products. Institutions/organizations with hopes to generate remote sensing biodiversity products can be identified and/or proposed to a funding body. |
| 5 | 可重复性(新添加) Repeatability (new addition) | 可重复性主要描述某一遥感生物多样性产品在未来预期能够按照一定时间分辨率获取的能力, 即评判能否按照预期规律性获取遥感生物多样性产品及该需求的难度。Repeatability mainly describes the ability of a certain remotely sensed biodiversity product to be expected to be accessible at a certain temporal resolution in the future, i.e., it judges whether the remotely sensed biodiversity product can be accessed with the expected regularity and the difficulty of that demand. |
表2 能够免费获取的覆盖中国的生物多样性核心监测指标(EBVs)遥感产品指标集
Table 2
| 遥感产品 Remote sensing product | 数据名称 Data name | 卫星平台 Satellite platform | 获取时间 Acquire time | 时间分辨率 Time resolution | 空间分辨率/比例尺 Spatial resolution /Scale | 可重 复性 Repeata- bility | 下载链接 Download link | ||||||||
|---|---|---|---|---|---|---|---|---|---|---|---|---|---|---|---|
| 生态系统功能 Ecosystem functioning | |||||||||||||||
| 叶面积指数 LAI | MCD15A3H v006 | MODIS | 2000-present | 4 d | 500 m | 1 | https://lpdaac.usgs.gov/products/mcd15a3hv006/ | ||||||||
| CGLS-LAI300 | Sentinel-3/ PROBA-V | 2014-present | 10 d | 300 m | https://land.copernicus.eu/global/products/lai | ||||||||||
| GLASS-LAI | AVHRR | 1981-2018 | 8 d | 0.05° | 1 | http://www.glass.umd.edu/ | |||||||||
| 光合有效辐射分量 FAPAR | MCD15A3H v061 | MODIS | 2002-present | 8 d | 500 m | https://lpdaac.usgs.gov/products/mcd15a2hv061/ | |||||||||
| CGLS-FAPAR300 | Sentinel-3/ PROBA-V | 2014-present | 10 d | 300 m | https://land.copernicus.eu/global/products/fapar | ||||||||||
| GLASS-FAPAR | AVHRR | 1981-2018 | 8 d | 0.05° | http://www.glass.umd.edu/ | ||||||||||
| 蒸散 ET | MOD16A2 v006 | MODIS | 2001-present | 8 d | 500 m | 1 | https://lpdaac.usgs.gov/products/mod16a2v006/ | ||||||||
| GLASS-ET | MODIS | 2000-2018 | 8 d | 1 km, 0.05° | 1 | http://www.glass.umd.edu/Download.html | |||||||||
| 净初级生产力 NPP | MOD17A3Hv006 | MODIS | 2001-present | Yearly | 500 m | https://lpdaac.usgs.gov/products/mod17a3hv006/ | |||||||||
| 总初级生产力 GPP | MOD17A2HGF v061 | MODIS | 2000-present | 8 d | 1 km | 1 | https://lpdaac.usgs.gov/products/mod17a2hgfv061/ | ||||||||
| NIRv-GPP | AVHRR | 1982-2018 | Monthly | 0.05° | https://doi.org/10.12199/nesdc.ecodb.2016YFA0600200.02.002 | ||||||||||
| GLASS-GPP | MODIS | 2000-2020 2000-2020 | 8 d | 500 m, 0.05° | http://www.glass.umd.edu/ | ||||||||||
| 叶绿素荧光 SIF | OCO2_L2_Lite_SIF 10r | OCO-2 | 2014-2022 | 16 d | 2.25 km | 1 | https://disc.gsfc.nasa.gov/datasets?keywords=OCO2%20SIF&page=1 | ||||||||
| OCO2_L2_Lite_SIF 11r | OCO-2 | 2019-2022 | 16 d | 2.25 km | https://disc.gsfc.nasa.gov/datasets?keywords=OCO2%20SIF&page=1 | ||||||||||
| OCO3_L2_Lite_SIF 10r | ISS OCO-3 | 2019-2022 | 16 d | 2.25 km | https://disc.gsfc.nasa.gov/datasets?keywords=OCO2%20SIF&page=1 | ||||||||||
| Tansat-SIF | TanSat | 2017-2019 | Daily | 2 km | http://www.geodata.cn/data/datadetails.html?dataguid=3695497&docId=10126 | ||||||||||
| 叶绿素含量 Chlorophyll content | Chlleaf | ENVISAT- MERIS | 2011 | 7 d | 300 m | 2 | https://doi.org/10.1016/j.rse.2019.111479 | ||||||||
| 物候 Phenology | MCD12Q2 v006 | MODIS | 2001-2019 | Yearly | 500 m | 1.5 | https://lpdaac.usgs.gov/products/mcd12q2v006/ | ||||||||
| 叶片性状 Leaf traits | 叶片磷含量 LPC 比叶面积 LA 叶片干物质含量 LDMC | Global trait maps | 2015 | - | - | 1 km, 3 km | 2.5 | https://www.try-db.org/TryWeb/Data.php#59 | |||||||
| 生物量 Biomass | China forest Aboveground Biomass (AGB) map | ICESat/ GLAS, MODIS | 2004 | - | 1 km | 2 | http://www.3decology.org/dataset-software/ | ||||||||
| Global Aboveground Biomass (AGB) Map (version: V02) | MODIS/ GLAS | 2005 | - | 1 km | http://www.glass.umd.edu/ | ||||||||||
| 遥感产品 Remote sensing product | 数据名称 Data name | 卫星平台 Satellite platform | 获取时间 Acquire time | 时间分辨率 Time resolution | 空间分辨率/比例尺 Spatial resolution /Scale | 可重 复性 Repeata- bility | 下载链接 Download link | ||||||||
| 生态系统结构 Ecosystem structure | |||||||||||||||
| 植被连续覆盖/全球森林覆盖变化 VCF/GFCC | Global 2010 Tree Cover (30 m) | Landsat | 2010 | - | 30 m | 2 | https://glad.umd.edu/dataset/global-2010-tree-cover-30-m | ||||||||
| 土地覆盖 LC | MCD12Q1 v006 | MODIS | 2001-2020 | Yearly | 500 m | 1.5 | https://lpdaac.usgs.gov/products/mcd12q1v006/ | ||||||||
| GlobeLand30 | Landsat | 2000, 2010, 2020 | - | 30 m | http://www.globallandcover.com/ | ||||||||||
| FROM_GLC30 | Landsat | 2010, 2015, 2017 | - | 30 m | http://data.ess.tsinghua.edu.cn/ | ||||||||||
| GLC_FCS30 | Landsat | 1985-2020 | Every 5 years | 30 m | https://data.casearth.cn/thematic/glc_fcs30?lang=zh_CN | ||||||||||
| 火烧迹地 BA | MCD64A1 v006 | MODIS | 2000-present | Monthly | 500 m | 1.5 | https://lpdaac.usgs.gov/products/mcd64a1v006/ | ||||||||
| Burnt Area 300m | Sentinel-3/OLCI, SLSTR, PROBA-V | 2014-2020 | 10 d/monthly | 300 m | https://land.copernicus.eu/global/products/ba | ||||||||||
| 植被覆盖度 FCover | FCover | Sentinel-3/OLCI, PROBA-V | 2014-present | 10 d | 300m | 1.5 | https://land.copernicus.eu/global/products/fcover | ||||||||
| Fractional Vegetation Coverage (FCover) (version: V40) | MODIS | 2000-2018 | 8 d | 500 m | http://www.glass.umd.edu/ | ||||||||||
| 冰面范围 IE | MODIS/Terra Sea Ice Extent 5-Min L2 Swath 1km, Version 6 | MODIS | 2000-present | 5 mins | 1 km | 1 | https://nsidc.org/data/mod29/versions/6#anchor-1 | ||||||||
| SMOS L3 Sea Ice Thickness | SMOS | 2010-present | Daily | 12.5 km | https://earth.esa.int/eogateway/catalog/smos-l3-sea-ice-thickness | ||||||||||
| 栖息地异质性 Habitat heterogeneity | Global Habitat Heterogeneity | MODIS | 2005 | - | 1 km, 5 km, 25 km | 2 | http://www.earthenv.org/texture | ||||||||
| 森林冠层高度 Forest canopy height | Forest tree height map of China | GEDI, ICESAT2 | 2019 | - | 30 m | 2.5 | http://www.3decology.org/dataset-software/ | ||||||||
| 植被类型 Vegetation type | An updated Vegetation Map of China (1:1000,000) | Landsat | 2018 | - | 1:1,000,000 | 2.5 | http://www.3decology.org/dataset-software/ | ||||||||
LAI, Leaf area index; FAPAR, Fraction of photosynthetically active radiation; ET, Evapotranspiration; NPP: Net primary production; GPP: Gross primary productivity; SIF, Solar-induced chlorophyll fluorescence; LPC, Leaf phosphorus content per leaf dry mass; SLA, specific leaf area; LDMC, Leaf dry mass per leaf fresh mass; VCF/GFCC, Vegetation continuous fields/global forest cover change; LC, Land cover; BA, Burnt area; FCover, Fractional vegetation cover; IE, Ice extent.
4.2 中国生物多样性核心遥感监测产品指标集
相对于其他EBVs遥感产品, 获取可重复的国家尺度森林冠层高度与植被类型产品对于生物多样性的动态描述具有重要作用, 然而难度较大。森林冠层高度是了解森林生物多样性的起源和维持机制的重要遥感产品, 然而在目前的森林冠层高度生产中存在遥感产品的饱和问题以及星载激光雷达脚点数据的离散分布问题, Liu等(2022)提出了一种深度学习指导的空间内插(Neural Network Guided Interpolation) NNGI模型, 借助140 km2无人激光雷达数据进行NNGI的训练, 最终绘制了中国30 m分辨率的森林冠层高度产品。
传统的植被图绘制依赖大量的植被实地调查数据, 通过专家经验, 结合文献史料记载与地形图, 最终综合地图制图学与生态学知识实现植被图的绘制。我国第一代1:100万植被图从20世纪80年代启动, 通过三代人200多位研究人员的努力, 耗时30年于2007年完成。2020年, 通过“众源数据采集-变化检测分类-专家知识”的植被测绘策略进行了中国1:100万植被图的现实性更新。在2022年末, 中国新一代1:50万植被图有望完成。
上述最新研究成果的数据更新能够对EBVs遥感监测数据集进行有力补充。
5 中国EBVs研究存在问题与展望
5.1 存在问题
(1)我国缺乏对EBVs的系统性研究。EBVs为记录和量化全球生物多样性变化提供了一种具有潜力的解决方案, 中国科学家在全球EBVs研究中起到了积极的作用。遥感作为EBVs的重要的观测手段, 国内学者结合遥感针对如初级生产力、生态系统物候等EBVs子类进行了较为深入的研究, 然而, 目前这些研究之间存在割裂, 缺乏从宏观的EBVs视角进行系统性的归纳和有效的整合。而相比于生态系统层次的研究, 我国在物种层面和群落层面的EBVs子类研究有所不足, 需要更多的专家学者投入来推动我国相应领域的EBVs研究。
(2)国产卫星的潜力有待深入挖掘。在上述展示的覆盖中国的EBVs遥感产品中, 数据源大多来自于国外的卫星遥感产品, 而国产卫星进行EBVs遥感产品生产以及研究相对较少。近年来, 随着我国卫星遥感技术的不断发展, 与国外的遥感技术水平逐渐缩小, 发射了一系列的陆地资源观测卫星。目前国产系列卫星覆盖了从全色、多光谱到高光谱, 从光学到雷达等不同传感器类型(表3)。近20年来, 国产卫星积累了大量的遥感数据, 在中国EBVs遥感产品的生产中存在巨大潜力。国产卫星中的亚米级高空间分辨率卫星(如高分二号)能够满足获取“物种性状” EBVs遥感产品的空间分辨率要求。高光谱卫星(如高分五号、HJ-1A)具备描绘“群落组成”与“生态系统功能”的能力。SAR卫星(如高分三号)能够为“生态系统功能”与“生态系统结构”提供可靠的数据支持。具有高时间分辨率、中/高空间分辨率的全色多光谱卫星在目前的国产卫星中数量最多, 能够对“群落组成”与“生态系统功能” EBVs子类进行全国范围内的持续监测。
表3 有潜力进行生物多样性核心监测指标(EBVs)遥感数据获取的国产卫星及其主要参数介绍
Table 3
| 卫星名称 Satellite name | 发射日期 Launch time | 轨道高度 Orbit height (km) | 重访周期 Revisit capacity | 幅宽 Swath width (km) | 传感器类型 Sensor type | 波段 Number of bands | 空间分辨率 Spatial resolution (m) |
|---|---|---|---|---|---|---|---|
| 高分系列 GF series | |||||||
| 高分一号 GF-1 | 2013/4/26 | 645 | 4 d | 60 | 全色/多光谱 PAN/MS | 5 | 2/8 |
| 2 d | 800 | 宽视场多光谱 WFV-MS | 4 | 16 | |||
| 高分二号 GF-2 | 2014/8/19 | 631 | 5 d | 45 | 全色/多光谱 PAN/MS | 5 | 0.8/3.2 |
| 高分三号 GF-3 | 2016/8/10 | 755 | 2 d | 5-650 | 合成孔径雷达 SAR | 1 | 1-500 |
| 高分四号 GF-4 | 2015/12/29 | 36,000 | 20 s | 400 | 多光谱 MS | 5 | 50 |
| 400 | 中红外 MWIR | 1 | 400 | ||||
| 高分五号 GF-5 | 2018/5/9 | 705 | 5 d | 60 | 高光谱 HS | 330 | 30 |
| 60 | 多光谱 MS | 12 | 20/40 | ||||
| 高分六号 GF-6 | 2018/6/2 | 645 | 4 d | 90 | 全色/多光谱 PAN/MS | 5 | 2/8 |
2 d | 800 | 宽视场多光谱 WFV MS | 8 | 16 | |||
| 高分七号 GF-7 | 2019/11/3 | 505 | 5 d | 20 | 双线阵相机 DLC | 1 | 0.8/0.65 |
| 20 | 多光谱 MS | 4 | 3.2 | ||||
| 1.6 | 激光测高仪 LA | 1 | 0.1 | ||||
| 高分一号 02/03/04星 GF-1-02\03\04 | 2018/3/31 | 645 | 2 d | 66 | 全色/多光谱 PAN/MS | 5 | 2/8 |
| 资源系列 ZY series | |||||||
| 资源一号01/02星 ZY-1-01/02 | 1999/10/14 | 778 | 3 d | 113 | CCD相机 CCD | 5 | 20 |
| 3 d | 890 | 宽视场多光谱 WFV-MS | 2 | 258 | |||
| 26 d | 119.5 | 红外多光谱 MS-IR | 4 | 78/156 | |||
| 资源一号02B星 ZY-1-02B | 2007/12/19 | 778 | 3 d | 27 | 高分辨率相机 HD | 1 | 2.36 |
| 113 | CCD相机 CCD | 5 | 20 | ||||
| 890 | 宽视场多光谱 WFV-MS | 2 | 258 | ||||
| 资源一号02C星 ZY-1-02C | 2011/12/22 | 780 | 3 d | 54 | 高分辨率相机 HD | 1 | 2.36 |
| 60 | 全色/多光谱 PAN/MS | 4 | 5/10 | ||||
| 资源一号04星 ZY-1-04 | 2014/12/7 | 778 | 3 d | 60 | 全色/多光谱 PAN/MS | 4 | 5/10 |
| 26 d | 120 | 红外多光谱 MS-IR | 4 | 40/80 | |||
| 26 d | 120 | 多光谱 MS | 4 | 20 | |||
| 3 d | 866 | 宽视场多光谱 WFV MS | 4 | 73 | |||
| 资源一号02D星 ZY-1-02D | 2019/12/12 | 778 | 3 d | 115 | 全色/多光谱 PAN/MS | 9 | 2.5/10 |
| 60 | 高光谱相机 HS | 166 | 30 | ||||
| 资源三号01星 ZY-3-01 | 2012/1/9 | 506 | 5 d | 52 | 双线阵相机 DLC | 1 | 3.5 |
| 52 | 全色/多光谱 PAN/MS | 5 | 2.1/5.8 | ||||
| 资源三号02星 ZY-3-02 | 2016/5/3 | 505 | 3-5 d | 51 | 双线阵相机 DLC | 1 | 2.5 |
| 3 d | 51 | 全色/多光谱 PAN/MS | 4 | 2.1/5.8 | |||
| 资源三号03星 ZY-3-03 | 2020/7/25 | 505 | 3-5 d | 51 | 双线阵相机 DLC | 1 | 2.5 |
| 3 d | 51 | 全色/多光谱 PAN/MS | 4 | 2.1/5.8 | |||
| 5 d | 0.07 | 激光测高仪 LA | 1 | 1 | |||
| 环境一号 HS-1 | |||||||
| 环境一号 A星 HS-1A | 2008/9/6 | 649 | 4 d | 360 | CCD相机 CCD | 4 | 30 |
| 50 | 高光谱 HS | 115 | 100 | ||||
| 环境一号 B星 HS-1B | 2008/9/6 | 649 | 4 d | 360 | CCD相机 CCD | 4 | 30 |
| 720 | 红外多光谱 MS-IR | 4 | 150/300 | ||||
| 环境一号 C星 HS-1C | 2012/12/9 | 499 | 4 d | 40/100 | 合成孔径雷达 SAR | 1 | 5/25 |
| 实践九号 SJ-9 | |||||||
| 实践九号 A星 SJ-9A | 2012/10/14 | 645 | 4 d | 30 | 全色/多光谱 PAN/MS | 5 | 2.5/10 |
| 实践九号 B星 SJ-9B | 2012/10/14 | 645 | 8 d | 18 | 红外相机 IR | 1 | 73 |
PAN, Panchromatic; MS, Multispectral; WFV, Wide-field of view; SAR, Synthetic aperture radar; MWIR, Medium wave infrared; HS, Hyperspectral; DLC, Dual-line array camera; LA, Laser altimetry; CCD, Charge-coupled device; IR, Infrared.
(3)部分EBVs遥感产品目前尚未具备“可重复性”, 尤其是描述生态系统结构EBVs子类的部分数据产品。NASA、ESA凭借其丰富的卫星数据, 生产了众多可周期性获取的EBVs遥感数据产品, 如NPP、ET等。然而在生态系统结构EBVs类别, 尤其是生态系统垂直结构方面, 遥感产品数量稀少。如表2所示, 目前国内生产了森林树高产品以及植被类型分布产品等重要的生态系统结构产品, 然而目前尚未实现可重复获取。
5.2 展望
EBVs的提出为全球生物多样性标准化监测提供了可能性, 中国科学家在全球EBVs的研究中起到了积极的作用。然而目前我国仍存在EBVs研究缺乏系统性、国产卫星潜力挖掘不足、部分EBVs遥感产品尚未具备“可重复性”等问题。在未来, 需要促进生态学、遥感科学、航空航天科学等领域的科学家合作, 进一步推动EBVs与遥感结合的科学研究, 加强EBVs各个类别研究的整合, 以及EBVs遥感监测指标体系的顶层设计; 更好地利用国产卫星数据形成我国EBVs遥感数据集, 并弥补目前EBVs遥感数据集的“可重复性”不足的问题, 尤其是生态系统垂直结构的相关数据产品。在此基础上, 结合我国的地理空间格局与生态系统特点, 根据中国的EBVs遥感监测指标体系, 为我国的生物多样性监测提供一套统一的、标准化的大尺度调查标准, 为全球生物多样性监测提供可靠的数据支撑与合作基础。
致谢
感谢审稿专家和责任编委提出的宝贵意见, 感谢迈阿密大学马倩对于文章图片编辑给予的帮助与建议。
参考文献
Remotely sensed variables of ecosystem functioning support robust predictions of abundance patterns for rare species
DOI:10.3390/rs11182086 URL [本文引用: 1]
Spectranomics: Emerging science and conservation opportunities at the interface of biodiversity and remote sensing
DOI:10.1016/j.gecco.2016.09.010 URL [本文引用: 1]
Has the Earth’s sixth mass extinction already arrived?
DOI:10.1038/nature09678 URL [本文引用: 1]
Neighborhood competition and crown asymmetry in Acer saccharum
DOI:10.1139/x01-161 URL [本文引用: 1]
Recent advances in plant-herbivore interactions
DOI:10.12688/f1000research.10313.1
PMID:28232868
[本文引用: 1]

Plant-herbivore interactions shape community dynamics across marine, freshwater, and terrestrial habitats. From amphipods to elephants and from algae to trees, plant-herbivore relationships are the crucial link generating animal biomass (and human societies) from mere sunlight. These interactions are, thus, pivotal to understanding the ecology and evolution of virtually any ecosystem. Here, we briefly highlight recent advances in four areas of plant-herbivore interactions: (1) plant defense theory, (2) herbivore diversity and ecosystem function, (3) predation risk aversion and herbivory, and (4) how a changing climate impacts plant-herbivore interactions. Recent advances in plant defense theory, for example, highlight how plant life history and defense traits affect and are affected by multiple drivers, including enemy pressure, resource availability, and the local plant neighborhood, resulting in trait-mediated feedback loops linking trophic interactions with ecosystem nutrient dynamics. Similarly, although the positive effect of consumer diversity on ecosystem function has long been recognized, recent advances using DNA barcoding to elucidate diet, and Global Positioning System/remote sensing to determine habitat selection and impact, have shown that herbivore communities are probably even more functionally diverse than currently realized. Moreover, although most diversity-function studies continue to emphasize plant diversity, herbivore diversity may have even stronger impacts on ecosystem multifunctionality. Recent studies also highlight the role of risk in plant-herbivore interactions, and risk-driven trophic cascades have emerged as landscape-scale patterns in a variety of ecosystems. Perhaps not surprisingly, many plant-herbivore interactions are currently being altered by climate change, which affects plant growth rates and resource allocation, expression of chemical defenses, plant phenology, and herbivore metabolism and behavior. Finally, we conclude by noting that although the field is advancing rapidly, the world is changing even more rapidly, challenging our ability to manage these pivotal links in the food chain.
The drone revolution of shark science: A review
DOI:10.3390/drones5010008 URL [本文引用: 1]
GEOV1: LAI, FAPAR essential climate variables and FCOVER global time series capitalizing over existing products. Part 2: Validation and intercomparison with reference products
DOI:10.1016/j.rse.2013.02.030 URL [本文引用: 1]
Ecological significance, characteristics and types of disturbance
干扰的类型、特征及其生态学意义
The relationship between species and spectral diversity in grassland communities is mediated by their vertical complexity
Forest inventory with high-density UAV-Lidar: Machine learning approaches for predicting individual tree attributes
DOI:10.1016/j.compag.2020.105815 URL [本文引用: 1]
Biodiversity loss threatens human well-being
DOI:10.1371/journal.pbio.0040277 PMID:16895442 [本文引用: 1]
Defaunation in the anthropocene
DOI:10.1126/science.1251817
PMID:25061202
[本文引用: 1]
We live amid a global wave of anthropogenically driven biodiversity loss: species and population extirpations and, critically, declines in local species abundance. Particularly, human impacts on animal biodiversity are an under-recognized form of global environmental change. Among terrestrial vertebrates, 322 species have become extinct since 1500, and populations of the remaining species show 25% average decline in abundance. Invertebrate patterns are equally dire: 67% of monitored populations show 45% mean abundance decline. Such animal declines will cascade onto ecosystem functioning and human well-being. Much remains unknown about this "Anthropocene defaunation"; these knowledge gaps hinder our capacity to predict and limit defaunation impacts. Clearly, however, defaunation is both a pervasive component of the planet's sixth mass extinction and also a major driver of global ecological change. Copyright © 2014, American Association for the Advancement of Science.
An overview of global leaf area index (LAI): Methods, products, validation, and applications
DOI:10.1029/2018RG000608 URL [本文引用: 1]
Mapping tropical forest canopy diversity using high-fidelity imaging spectroscopy
DOI:10.1890/13-1824.1 URL [本文引用: 1]
Global MODIS fraction of green vegetation cover for monitoring abrupt and gradual vegetation changes
DOI:10.3390/rs10040653 URL [本文引用: 1]
Forest disturbance and recovery: A general review in the context of spaceborne remote sensing of impacts on aboveground biomass and canopy structure
Plant spectral diversity as a surrogate for species, functional and phylogenetic diversity across a hyper-diverse biogeographic region
DOI:10.1111/geb.13306 URL [本文引用: 1]
Land surface phenology from MODIS: Characterization of the Collection 5 global land cover dynamics product
DOI:10.1016/j.rse.2010.04.005 URL [本文引用: 1]
Remote sensing of biodiversity: Soil correction and data dimension reduction methods improve assessment of α-diversity (species richness) in prairie ecosystems
DOI:10.1016/j.rse.2017.12.014 URL [本文引用: 2]
Perspectives and prospects of LiDAR in forest ecosystem monitoring and modeling
激光雷达在森林生态系统监测模拟中的应用现状与展望
Mapping multi-scale vascular plant richness in a forest landscape with integrated LiDAR and hyperspectral remote-sensing
DOI:10.1002/ecy.2109
PMID:29231965
[本文引用: 1]
The central role of floristic diversity in maintaining habitat integrity and ecosystem function has propelled efforts to map and monitor its distribution across forest landscapes. While biodiversity studies have traditionally relied largely on ground-based observations, the immensity of the task of generating accurate, repeatable, and spatially-continuous data on biodiversity patterns at large scales has stimulated the development of remote-sensing methods for scaling up from field plot measurements. One such approach is through integrated LiDAR and hyperspectral remote-sensing. However, despite their efficiencies in cost and effort, LiDAR-hyperspectral sensors are still highly constrained in structurally- and taxonomically-heterogeneous forests - especially when species' cover is smaller than the image resolution, intertwined with neighboring taxa, or otherwise obscured by overlapping canopy strata. In light of these challenges, this study goes beyond the remote characterization of upper canopy diversity to instead model total vascular plant species richness in a continuous-cover North Carolina Piedmont forest landscape. We focus on two related, but parallel, tasks. First, we demonstrate an application of predictive biodiversity mapping, using nonparametric models trained with spatially-nested field plots and aerial LiDAR-hyperspectral data, to predict spatially-explicit landscape patterns in floristic diversity across seven spatial scales between 0.01-900 m. Second, we employ bivariate parametric models to test the significance of individual, remotely-sensed predictors of plant richness to determine how parameter estimates vary with scale. Cross-validated results indicate that predictive models were able to account for 15-70% of variance in plant richness, with LiDAR-derived estimates of topography and forest structural complexity, as well as spectral variance in hyperspectral imagery explaining the largest portion of variance in diversity levels. Importantly, bivariate tests provide evidence of scale-dependence among predictors, such that remotely-sensed variables significantly predict plant richness only at spatial scales that sufficiently subsume geolocational imprecision between remotely-sensed and field data, and best align with stand components including plant size and density, as well as canopy gaps and understory growth patterns. Beyond their insights into the scale-dependent patterns and drivers of plant diversity in Piedmont forests, these results highlight the potential of remotely-sensible essential biodiversity variables for mapping and monitoring landscape floristic diversity from air- and space-borne platforms.© 2017 by the Ecological Society of America.
Toward a national early warning system for forest disturbances using remotely sensed canopy phenology
Evaluation of the potential of MODIS satellite data to predict vegetation phenology in different biomes: An investigation using ground-based NDVI measurements
DOI:10.1016/j.rse.2013.01.010 URL [本文引用: 1]
Genetic diversity targets and indicators in the CBD post-2020 Global Biodiversity Framework must be improved
DOI:10.1016/j.biocon.2020.108654 URL [本文引用: 1]
Linking near-surface and satellite remote sensing measurements of deciduous broadleaf forest phenology
DOI:10.1016/j.rse.2011.10.006 URL [本文引用: 1]
Monitoring plant functional diversity from space
DOI:10.1038/nplants.2016.24 PMID:27249357 [本文引用: 1]
Essential biodiversity variables for mapping and monitoring species populations
A random forest algorithm for retrieving canopy chlorophyll content of wheat and soybean trained with PROSAIL simulations using adjusted average leaf angle
DOI:10.3390/rs14010098 URL [本文引用: 1]
Climate-induced variations in global wildfire danger from 1979 to 2013
DOI:10.1038/ncomms8537
PMID:26172867
[本文引用: 1]
Jolly, W. Matt; Freeborn, Patrick H. US Forest Serv, Rocky Mt Res Stn, Fire Sci Lab, Missoula, MT 59803 USA. Cochrane, Mark A.; Freeborn, Patrick H. S Dakota State Univ, GSCE, Brookings, SD 57007 USA. Holden, Zachary A. US Forest Serv Reg 1, Missoula, MT 59802 USA. Brown, Timothy J. Western Reg Climate Ctr, DRI, Reno, NV 89512 USA. Williamson, Grant J.; Bowman, David M. J. S. Univ Tasmania, Sch Biol Sci, Hobart, Tas 7001, Australia.
The MODIS fire products
DOI:10.1016/S0034-4257(02)00076-7 URL [本文引用: 1]
Towards global data products of Essential Biodiversity Variables on species traits
Linking Earth Observation and taxonomic, structural and functional biodiversity: Local to ecosystem perspectives
DOI:10.1016/j.ecolind.2016.06.022 URL
Assessing tree dendrometrics in young regenerating plantations using terrestrial laser scanning
DOI:10.1007/s13595-014-0358-4 URL [本文引用: 1]
Annual dynamics of global land cover and its long-term changes from 1982 to 2015
DOI:10.5194/essd-12-1217-2020 URL [本文引用: 1]
Significant effect of topographic normalization of airborne LiDAR data on the retrieval of plant area index profile in mountainous forests
DOI:10.1016/j.isprsjprs.2017.08.005 URL [本文引用: 1]
Real-time and short-term predictions of spring phenology in North America from VIIRS data
DOI:10.1016/j.rse.2017.03.009 URL [本文引用: 1]
Predicting height to crown base of Larix olgensis in northeast China using UAV-LiDAR data and nonlinear mixed effects models
DOI:10.3390/rs13091834 URL [本文引用: 1]
Neural network guided interpolation for mapping canopy height of China’s forests by integrating GEDI and ICESat-2 data
DOI:10.1016/j.rse.2021.112844 URL [本文引用: 2]
Using data from Landsat, MODIS, VIIRS and PhenoCams to monitor the phenology of California oak/grass savanna and open grassland across spatial scales
DOI:10.1016/j.agrformet.2017.02.026 URL [本文引用: 1]
Inferring plant functional diversity from space: The potential of Sentinel-2
DOI:10.1016/j.rse.2019.111368 URL
Monitoring plant functional diversity using the reflectance and echo from space
Remote sensing of species diversity using Landsat 8 spectral variables
DOI:10.1016/j.isprsjprs.2017.10.008 URL [本文引用: 1]
Spatial and temporal patterns of Landsat-based detection of tree mortality caused by a mountain pine beetle outbreak in Colorado, USA
DOI:10.1016/j.foreco.2014.02.037 URL [本文引用: 1]
Review: Development of an in situ observation network for terrestrial ecological remote sensing: The Phenological Eyes Network (PEN)
DOI:10.1007/s11284-014-1239-x URL [本文引用: 1]
Estimating ground elevation and vegetation characteristicsin coastal salt marshes using UAV-based LiDAR and digital aerial photogrammetry
DOI:10.3390/rs13224506 URL [本文引用: 1]
Mapping global forest canopy height through integration of GEDI and Landsat data
DOI:10.1016/j.rse.2020.112165 URL [本文引用: 1]
Global biodiversity monitoring: From data sources to Essential Biodiversity Variables
DOI:10.1016/j.biocon.2016.07.014 URL [本文引用: 1]
Measuring phenological variability from satellite imagery
DOI:10.2307/3235884 URL [本文引用: 1]
Remotely sensed spatial heterogeneity as an exploratory tool for taxonomic and functional diversity study
DOI:10.1016/j.ecolind.2017.09.055 URL [本文引用: 1]
Satellite remote sensing to monitor species diversity: Potential and pitfalls
DOI:10.1002/rse2.9 URL [本文引用: 1]
From local spectral species to global spectral communities: A benchmark for ecosystem diversity estimate by remote sensing
DOI:10.1016/j.ecoinf.2020.101195 URL [本文引用: 1]
From local to regional: Functional diversity in differently managed alpine grasslands
DOI:10.1016/j.rse.2019.111415 URL [本文引用: 1]
Spatial resolution, spectral metrics and biomass are key aspects in estimating plant species richness from spectral diversity in species-rich grasslands
DOI:10.1002/rse2.244 URL [本文引用: 1]
Determining stingray movement patterns in a wave-swept coastal zone using a blimp for continuous aerial video surveillance
DOI:10.3390/fishes5040031 URL [本文引用: 1]
Priority list of biodiversity metrics to observe from space
UAV laser scans allow detection of morphological changes in tree canopy
DOI:10.3390/rs12223829 URL [本文引用: 1]
Using an unmanned aerial vehicle (UAV) to study wild yak in the highest desert in the world
DOI:10.1080/01431161.2018.1441570 URL [本文引用: 1]
An updated vegetation map of China (1:1000000)
DOI:10.1016/j.scib.2020.04.004 URL [本文引用: 1]
Spatial distribution of forest aboveground biomass in China: Estimation through combination of spaceborne lidar, optical imagery, and forest inventory data
DOI:10.1016/j.rse.2015.12.002 URL
RSPD: A novel remote sensing index of plant biodiversity combining spectral variation hypothesis and productivity hypothesis
DOI:10.3390/rs13153007 URL [本文引用: 1]
Satellite imaging reveals increased proportion of population exposed to floods
DOI:10.1038/s41586-021-03695-w URL [本文引用: 1]
A global, remote sensing-based characterization of terrestrial habitat heterogeneity for biodiversity and ecosystem modelling
DOI:10.1111/geb.12365 URL [本文引用: 1]
Vegetation phenology from Sentinel-2 and field cameras for a Dutch barrier island
DOI:10.1016/j.rse.2018.03.014 URL [本文引用: 1]
Remote sensing of terrestrial plant biodiversity
DOI:10.1016/j.rse.2019.111218 URL [本文引用: 1]
Remote sensing of the terrestrial carbon cycle: A review of advances over 50 years
DOI:10.1016/j.rse.2019.111383 URL [本文引用: 1]
A crown morphology-based approach to individual tree detection in subtropical mixed broadleaf urban forests using UAV LiDAR data
DOI:10.3390/rs13071278 URL [本文引用: 1]
Remote estimation of nitrogen vertical distribution by consideration of maize geometry characteristics
DOI:10.3390/rs10121995 URL [本文引用: 1]
Estimation of global vegetation productivity from Global LAnd Surface Satellite data
DOI:10.3390/rs10020327 URL [本文引用: 1]
Leaf area index estimation model for UAV image hyperspectral data based on wavelength variable selection and machine learning methods
DOI:10.1186/s13007-021-00750-5
PMID:33941211
[本文引用: 1]
To accurately estimate winter wheat leaf area index (LAI) using unmanned aerial vehicle (UAV) hyperspectral imagery is crucial for crop growth monitoring, fertilization management, and development of precision agriculture.The UAV hyperspectral imaging data, Analytical Spectral Devices (ASD) data, and LAI were simultaneously obtained at main growth stages (jointing stage, booting stage, and filling stage) of various winter wheat varieties under various nitrogen fertilizer treatments. The characteristic bands related to LAI were extracted from UAV hyperspectral data with different algorithms including first derivative (FD), successive projections algorithm (SPA), competitive adaptive reweighed sampling (CARS), and competitive adaptive reweighed sampling combined with successive projections algorithm (CARS_SPA). Furthermore, three modeling machine learning methods including partial least squares regression (PLSR), support vector machine regression (SVR), and extreme gradient boosting (Xgboost) were used to build LAI estimation models.The results show that the correlation coefficient between UAV and ASD hyperspectral data is greater than 0.99, indicating the UAV data can be used for estimation of wheat growth information. The LAI bands selected by using different algorithms were slightly different among the 15 models built in this study. The Xgboost model using nine consecutive characteristic bands selected by CARS_SPA algorithm as input was proved to have the best performance. This model yielded identical results of coefficient of determination (0.89) for both calibration set and validation set, indicating a high accuracy of this model.The Xgboost modeling method in combine with CARS_SPA algorithm can reduce input variables and improve the efficiency of model operation. The results provide reference and technical support for nondestructive and rapid estimation of winter wheat LAI by using UAV.
GLC_FCS30: Global land-cover product with fine classification system at 30 m using time-series Landsat imagery
DOI:10.5194/essd-13-2753-2021 URL [本文引用: 1]
Using digital cameras for comparative phenological monitoring in an evergreen broad-leaved forest and a seasonal rain forest
DOI:10.1016/j.ecoinf.2012.03.001 URL [本文引用: 1]
The potential of mapping grassland plant diversity with the links among spectral diversity, functional trait diversity, and species diversity
DOI:10.3390/rs13153034 URL [本文引用: 1]
Forest species diversity mapping using airborne LiDAR and hyperspectral data in a subtropical forest in China
DOI:10.1016/j.rse.2018.05.014 URL [本文引用: 1]
