


物种多样性的空间分布格局一直是生态学和生物地理学研究的一个热点问题, 也是保护生物学确定多样性热点和保护重点的重要依据之一。物种多样性的分布格局是指在一定地域中物种多样性在三维空间的分布状态, 即在经度、纬度和海拔高度(水下深度)的分异情况(吴永杰和雷富民, 2013)。鉴于海拔梯度综合了温度、降雨量、气压等多种环境因子的影响, 温度在海拔梯度上的变化速率又是纬度梯度的1,000倍(Barry, 2008), 因此成为生态学家研究物种多样性分布规律的重要关注点(郑智等, 2014c)。而在相对较小的空间尺度上, 山地生态系统的海拔梯度落差大, 成为研究物种多样性空间分布格局的理想场所(McCain, 2005; Rowe et al, 2015)。
对于物种多样性空间分布格局的形成与维持机制, 研究者们提出了多种假说和解释, 包括面积假说(Rosenzweig & Ziv, 1999)、气候稳定性假说(Stevens, 1989)、能量假说(Hawkins et al, 2003)、生境异质性假说(Heaney, 2010)和中域效应假说(Colwell & Lees, 2000)等。其中中域效应假说重点探讨几何边界对物种多样性空间分布格局的影响, 预测在几何边界的中心区域将出现物种多样性的峰值, 是解释物种多样性空间分布格局的重要理论, 得到了广泛关注(吴永杰和雷富民, 2013; 郑智等, 2014b; 胡一鸣等, 2018)。
秦岭是我国亚热带和暖温带的分界线, 也是中国动物地理区划中古北界和东洋界的分界线(张荣祖, 2011)。秦岭为我国重要的生态过渡带, 加之山体高大, 地形复杂, 物种多样性极其丰富, 是我国生物多样性分布的中心地区之一; 《中国生物多样性保护战略与行动计划》(2011-2030)已将秦岭列为生物多样性保护优先区域之一。目前秦岭地区物种多样性空间分布格局和相关机制的研究仍十分有限, 多数研究仅限于局部地区的单个生物类群, 且主要集中在植物类群(如唐志尧等, 2004; 唐志尧和柯金虎, 2004; 刘金虎等, 2011; 王宇超和王得祥, 2013)、鸟类①( 田凯 (2017) 鄂西北野生脊椎动物物种多样性及地理分布格局研究.硕士学位论文, 湖北大学, 武汉.)、两栖爬行类(郑智等, 2014a, b, c)和哺乳类(李晟等, 2014; Shuai et al, 2017)。陕西省洋县辖区位于秦岭中段南坡, 海拔跨度从389 m至3,071 m, 境内有长青国家级自然保护区和朱鹮国家级自然保护区, 哺乳动物物种多样性丰富(何百锁, 2001; 何百锁等, 2016)。洋县辖区内人口密度和人为干扰比较大, 因而动物多样性的空间分布受到较大影响。本研究分析了秦岭地区人为干扰下的物种多样性空间分布格局, 为探讨大尺度范围物种多样性空间分布格局的普遍模式、环境影响因素和演化机制等宏生态学研究提供数据支撑。
1 材料与方法
1.1 研究区域
图1
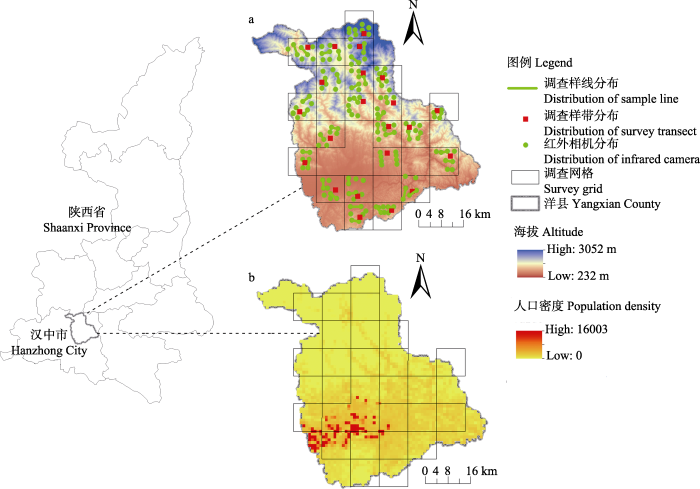
图1
研究地区的位置及调查设置(a)和人口分布(b)情况。数据来源于中国科学院资源环境科学数据中心(http://www.resdc.cn)。
Fig. 1
Location of study area, the status of survey settings (a) and population distribution (b). The data set is provided by Data Center for Resources and Environmental Sciences, Chinese Academy of Sciences (RESDC) (http://www.resdc.cn).
洋县境内除低海拔地区分布有农作物如水稻(Oryza sativa)、小麦(Triticum aestivum)和油菜(Brassica campestris)外, 随海拔从低到高还分布有常绿阔叶林、阔叶混交林、针阔混交林、针叶林、亚高山草甸5种植被类型, 共有乔木树种72科152属321种。其中国家重点保护植物有铁杉(Tsuga chinensis)、秦岭冷杉(Abies chensiensis)、巴山冷杉(A. fargesii)、红豆杉(Taxus chinensis)、银杏(Ginkgo biloba)、香樟(Cinnamomum camphora)等。根据洋县县志记载, 境内有兽类60多种, 鸟类250余种, 两栖爬行动物20多种, 鱼类18种。被称为秦岭四宝的国家一级重点保护野生动物大熊猫(Ailuropoda melanoleuca)、川金丝猴(Rhinopithecus roxellana)、秦岭羚牛(Budorcas bedfordi)和朱鹮(Nipponia nippon)在这里均有分布。
1.2 物种调查方法
根据生态环境部对全国10 km × 10 km网格划分规则, 本研究区域包括42个网格, 我们根据分层取样的原则选择其中的22个作为调查网格(图1)。在每个调查网格内分别采用样线法、红外相机法和样带法调查哺乳动物物种多样性。
(1)样线法: 每个调查网格内设置长2-3 km、宽6 m的调查样线2条。2个人一组, 观测时行进速度为1 km/h, 记录样线上遇到的大中型哺乳动物的实体、足迹链、粪便、食迹、卧迹等, 并判断动物的种类和个体数量。2016年11-12月、2017年3-4月、7月和11月共进行了4次调查, 样线的总长度为464.58 km。
(2)红外相机法: 将每个调查网格划分成25个2 km × 2 km的小网格, 根据分层取样的原则选择小网格布设相机, 每个小网格中布设1台, 每个调查网格内共2台。将红外相机设置在动物痕迹(粪便、足迹和遗落物等)较多的地点(如兽径、水源点等处), 相机固定于离地面50-80 cm的树干上, 镜头基本与地面平行。记录相机放置的日期、GPS位点、海拔、坡度、坡向、动物痕迹以及人为干扰等信息。红外相机数据每3个月读取1次, 然后将相机移动到其他的小网格内。红外相机的有效位点数为141个, 总工作时长为13,871相机日。
(3)样带法: 在每个调查网格内设置1条样带, 样带上每隔5 m布设1个捕鼠笼或鼠夹, 共布设100个, 连续调查3天, 每天检查上夹动物, 总计用300个笼(夹)捕日; 同时在样带上每隔5 m布设1个陷阱(桶), 共15个, 连续3天调查食虫类小型哺乳动物。在2016年秋季(10-11月)及2017年夏秋季(8-10月), 分两次共对22个网格进行了13,320个笼(夹)捕日及530个陷阱日的调查。
1.3 数据分析
1.3.1 物种多样性空间分布格局图的构建
在ArcGIS 10.1软件中, 根据22个调查网格的物种丰富度和多样性指数数据, 采用Kriging插值方法构建研究地区物种丰富度和多样性指数的空间分布格局图。物种丰富度采用物种的数目。物种多样性采用Shannon-Wiener多样性指数, 计算公式如下:
式中, S为调查到的物种数; Pi为物种i的个体数占所有物种个体数的比例。
1.3.2 物种多样性垂直分布模式的检验
在ArcGIS 10.1软件中, 计算每个调查网格的平均海拔。将每个调查网格的平均海拔作为自变量, 物种丰富度和多样性指数作为因变量, 构建多项式回归模型, 并根据校正赤池信息准则AICc (the corrected Akaike information criterion)的最小值, 从一阶和二阶的多项式(分别代表线性和单峰曲线)中选出最优模型来确定物种丰富度和多样性指数的垂直分布格局模式。海拔数据来源于https://earthexplorer. usgs.gov/网站, 空间分辨率是30 m × 30 m。
1.3.3 物种多样性与环境因子的关系检验
在R 3.5.0 (R Development Core Team, 2018)中,使用scatterplotMatrix函数分析环境因子与物种丰富度和多样性指数的拟合曲线。根据拟合曲线分析结果, 对每个环境因子变量增加二次项提高预测精度。然后使用regsubsets函数进行全子集回归, 以校正后的模型拟合优度(adjusted R2)为依据, 分别在物种丰富度和多样性指数与环境因子的多元线性回归模型中, 筛选出拟合优度最大的最优线性模型。再使用lm函数拟合物种丰富度和多样性指数与环境因子的多元线性回归模型, 并通过t检验值比较环境因子对模型的相对贡献大小。
本研究采用以下环境因子: 增强植被指数(enhanced vegetation index, EVI)、年均温(annual mean temperature, Tmean)、年降水量(mean annual precipitation, AP)、植被类型数(vegetation number, Vegn)。EVI数据选用2016年10月至2017年10月的MODIS数据, 空间分辨率是250 m × 250 m, 来源于https:// earthexplorer.usgs.gov/网站。Tmean、AP和Vegn数据的空间分辨率是1,000 m × 1,000 m, 来源于中国科学院资源环境科学数据中心(http://www.resdc.cn)。在ArcGIS 10.1软件中, 计算每个调查网格的EVI、Tmean和AP的平均值, 以及Vegn的数值。
2 结果
本次调查共鉴定哺乳动物48种(附录1), 隶属8目21科42属, 其中啮齿类动物6科17属22种, 占哺乳动物总种数的45.83%。
2.1 哺乳动物物种多样性的空间分布格局
图2
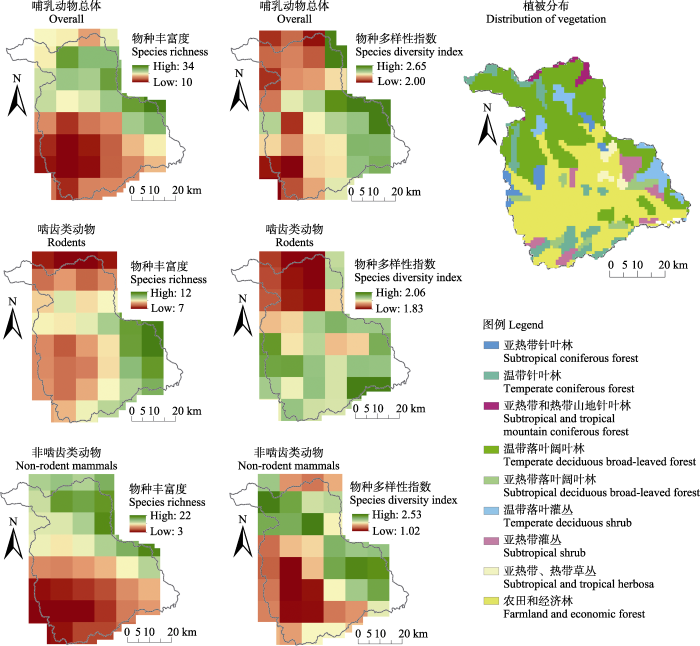
图2
秦岭南坡洋县辖区哺乳动物物种多样性的空间分布格局
Fig. 2
Spatial distribution patterns of mammal species diversity in Yangxian County on the southern slope of the Qinling Mountains
2.2 哺乳动物物种多样性的垂直分布格局
图3
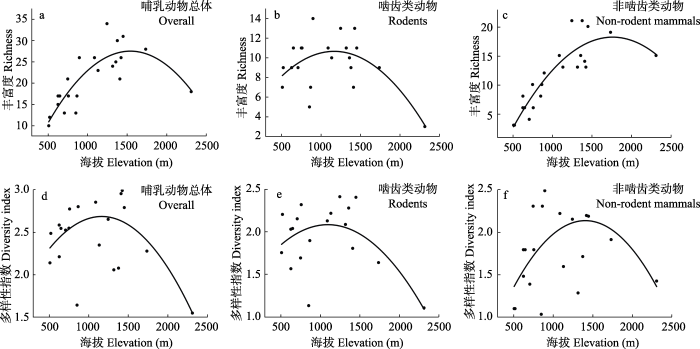
图3
秦岭南坡洋县辖区哺乳动物物种多样性的垂直分布格局
Fig. 3
Elevational distribution patterns of mammal species diversity in Yangxian County on the southern slope of the Qinling Mountains
根据AICc最小值选出的最优多项式回归模型都为二次方模型(表1), 即秦岭南坡洋县辖区哺乳动物的物种多样性垂直分布格局都是单峰模式。
表1 秦岭南坡洋县辖区哺乳动物物种多样性垂直分布的多项式回归
Table 1
| 物种分组 Species groups | 多样性 Diversity | 校正赤池信息准则模型差值(一阶) Corrected Akaike information criterion (Order 1) | 校正赤池信息准则模型差值(二阶) Corrected Akaike information criterion (Order 2) |
|---|---|---|---|
| 哺乳动物总体 Overall | 丰富度 Richness | 16.82 | 0 |
| 多样性指数 Diversity index | 5.06 | 0 | |
| 啮齿类动物 Rodents | 丰富度 Richness | 7.82 | 0 |
| 多样性指数 Diversity index | 1.66 | 0 | |
| 非啮齿类动物 Non-rodent mammals | 丰富度 Richness | 14.46 | 0 |
| 多样性指数 Diversity index | 5.13 | 0 |
2.3 影响哺乳动物物种多样性空间分布格局的环境因子
最优线性模型筛选结果显示由环境因子Tmean、T2mean、Vegn、Vegn2、EVI和EVI2的组合模型对研究地区哺乳动物总体物种丰富度空间分布格局的解释率最高, 其中T2mean、EVI和EVI2具有显著影响(表2)。T2mean为负相关, 表明年均温对物种丰富度格局的影响效果为倒钟型, 在中域温度区域具有最高的物种丰富度。EVI2为正相关, 表明增强植被指数对物种丰富度格局的影响效果为钟型, 在中域增强植被指数的区域具有较低的物种丰富度。EVI2对模型解释率的贡献最大, 表明增强植被指数对哺乳动物总体物种丰富度空间分布格局起主导作用。由Tmean、T2mean、AP、AP2和Vegn2组成的模型对哺乳动物总体多样性指数空间分布格局的解释率最高(表2)。T2mean是负相关, 而AP2和Vegn2是正相关, 表明年平均降水量和植被类型复杂性对物种多样性指数格局的影响效果是钟型, 在中域年平均降水量和植被类型复杂区域具有最低的物种多样性指数。AP2对模型解释率的贡献最大, 表明年平均降水量对哺乳动物总体物种多样性指数空间分布格局起主导作用。
表2 秦岭南坡洋县辖区哺乳动物物种多样性与环境因子最优线性模型
Table 2
| 多样性 Diversity | 环境因子 Environment variables | 因子系数 Coefficient | t | P |
|---|---|---|---|---|
| 哺乳动物总体 Overall | ||||
| 丰富度 Richness | Tmean | 5.71 | 1.63 | 0.12 |
| T2mean | -0.32 | -2.14 | < 0.05 | |
| Vegn | 8.96 | 2.09 | 0.05 | |
| Vegn2 | -0.99 | -1.71 | 0.11 | |
| EVI | -2.38e+03 | -2.17 | < 0.05 | |
| EVI2 | 3.62e+03 | 2.25 | < 0.05 | |
| 多样性指数 Diversity index | Tmean | 1.02 | 2.55 | < 0.05 |
| T2mean | -4.73e-02 | -2.21 | < 0.05 | |
| AP | -0.16 | -2.31 | < 0.05 | |
| AP2 | 9.05e-05 | 2.34 | < 0.05 | |
| Vegn2 | 2.59e-02 | 2.28 | < 0.05 | |
| 啮齿类动物 Rodents | ||||
| 丰富度 Richness | Tmean | 7.11 | 3.12 | < 0.01 |
| T2mean | -0.33 | -3.10 | < 0.01 | |
| AP2 | 2.60e-05 | 2.36 | < 0.05 | |
| Vegn | 1.04 | 2.73 | < 0.05 | |
| EVI | -1.45e+03 | -2.68 | < 0.05 | |
| EVI2 | 2.10e+03 | 2.70 | < 0.05 | |
| 多样性指数 Diversity index | Tmean | 1.43 | 2.13 | < 0.05 |
| T2mean | -6.41e-02 | -2.06 | 0.06 | |
| AP2 | 3.79e-06 | 1.19 | 0.25 | |
| Vegn2 | 1.85e-02 | 1.24 | 0.24 | |
| EVI | -2.62e+02 | -1.66 | 0.12 | |
| EVI2 | 3.66e+02 | 1.61 | 0.13 | |
| 非啮齿类动物 Non-rodent mammals | ||||
| 丰富度 Richness | T2mean | -0.09 | -5.81 | < 0.01 |
| Vegn | 5.97 | 1.92 | 0.07 | |
| Vegn2 | -0.74 | -1.79 | 0.09 | |
| EVI2 | 1.84e+02 | 3.22 | < 0.01 | |
| 多样性指数 Diversity index | Tmean | 0.94 | 2.35 | < 0.05 |
| T2mean | -0.04 | -2.47 | < 0.05 | |
| Vegn2 | 0.04 | 3.19 | < 0.01 | |
| EVI2 | -16.74 | -1.49 | 0.16 | |
EVI: 增强植被指数; Tmean: 年均温; AP: 年降水量; Vegn: 植被类型数。
EVI, Enhanced vegetation index; Tmean, Annual mean temperature; AP, Mean annual precipitation; Vegn, Vegetation number.
最优线性模型筛选结果显示, Tmean、T2mean、AP2、Vegn、EVI和EVI2的组合对啮齿类动物的物种丰富度空间分布格局解释率最高(表2)。T2mean为负相关, 而AP2和EVI2是正相关。物种丰富度与植被类型数显示为正相关关系。Tmean对模型解释率的贡献最大, 表明年均温对啮齿类动物的物种丰富度空间分布
格局起主导作用。由Tmean、T2mean、AP2、Vegn2、EVI和EVI2组成的模型对啮齿类动物的物种多样性指数空间分布格局解释率最高, 但仅Tmean具有显著影响(表2), 且呈正相关关系。
3 讨论
由于取样困难、数据难于获得等原因, 目前关于哺乳动物物种多样性空间分布格局的研究主要集中于物种丰富度方面(McCain, 2005; 王新建等, 2007; 林鑫等, 2009; Hu et al, 2017), 而关于物种多样性指数的研究相对较少(吴永杰和雷富民, 2013)。本研究综合采用了样线法、红外相机法和笼捕/夹捕法, 不仅获得哺乳动物的物种数, 还调查到每物种的数量, 因而不仅能探讨哺乳动物物种丰富度的空间分布格局, 也能研究其物种多样性指数状况。本次调查共确认分布48种哺乳动物, 其中20种为大中型哺乳动物(包括灵长类、食肉类和有蹄类; 曾治高等, 2006)。何百锁(2001)经1997-2000年的野外调查确认长青国家级自然保护区内分布52种哺乳动物。何百锁等(2016)基于红外相机确定长青国家级自然保护区内分布17种大中型哺乳动物。可见, 本调查结果基本反映了研究地区的哺乳动物群落组成。
人类活动干扰对研究地区哺乳动物物种多样性的空间分布格局具有较大影响。在人口密度最高的中南部地区, 哺乳动物总体物种丰富度和多样性指数都最低(图1, 2)。物种丰富度和多样性指数的空间分布格局在啮齿类动物和非啮齿类动物之间存在差异。啮齿类动物在人口密度较小的东部地区丰富度最高, 而非啮齿类动物则在人口密度最小的北部地区高。由于边缘效应, 适度人类干扰生境中小型啮齿类动物的物种多样性可能最高(肖治术等, 2002)。据此推测, 可能是近年来的天然林保护工程和移民搬迁工程, 使洋县东部地区的次生林和灌木林受到的干扰减弱, 且出现了大量的弃耕地, 隐蔽条件较好, 导致森林型鼠类和农田型鼠类多在此处出没, 前者如大林姬鼠(Apodemus peninsulae)、齐氏姬鼠(A. chevrieri)和白腹巨鼠(Leopoldamys edwardsi), 后者如大仓鼠(Tscheskia triton)、北社鼠(Niviventer confucianus)。因此, 适度人类干扰的东部地区啮齿类动物的物种丰富度和多样性指数最高。而大中型野生动物对人类活动干扰敏感(张跃等, 2012), 其物种丰富度和多样性指数在人口密度最高的中南部地区最低, 而在人口密度最小的北部地区最高。
秦岭南坡洋县辖区不同生物类群的物种丰富度垂直分布格局不同: 哺乳动物总体符合正中峰模式, 啮齿类动物符合左偏倚的中峰模式, 非啮齿类动物符合右偏倚的中峰模式。这一结果与秦岭太白山南坡啮齿类动物物种丰富度随海拔升高而呈现单调递减模式存在一定的差异(Shuai et al, 2017), 其原因可能是本研究的海拔跨度从389 m至3,071 m, 啮齿类动物物种丰富度在海拔1,000 m左右最高, 而Shuai等(2017)研究的秦岭南坡最低起始海拔是1,200 m, 可能不足以展示出中峰模式。李晟等(2014)的研究显示洋县辖区长青国家级自然保护区内有蹄类动物物种丰富度的垂直分布格局呈现中峰模式, 本研究结果与之相似。不同物种类群分布格局的差异受各自格局潜在环境因素的影响(Wu et al, 2013)。本研究中啮齿类动物的空间分布格局受到年均温、降水量、增强植被指数和植被类型数等环境因子的显著影响, 而非啮齿类动物只受到年均温和增强植被指数的显著影响。
秦岭南坡洋县辖区哺乳动物的物种多样性与丰富度的垂直分布格局存在差异。Shannon-Wiener多样性指数相比物种丰富度更能解释物种分布的均匀度(Spellerberg, 2008)。因此, Shannon-Wiener多样性指数对常见种敏感, 而物种丰富度对稀有种敏感(马克平和刘玉明, 1994)。野猪(Sus scrofa)和小麂(Muntiacus reevesi)等常见种在本研究地区主要分布在中低海拔, 而大熊猫、川金丝猴和秦岭羚牛等稀有种主要分布在较高海拔。所以, 哺乳动物总体和非啮齿类动物的物种多样性指数垂直分布格局相比物种丰富度表现出向低海拔偏倚的模式。影响物种多样性指数空间分布格局的环境因子与物种丰富度也存在明显差异。
秦岭南坡洋县辖区哺乳动物物种多样性的空间分布格局受到多种环境因素的共同影响。其中, 年均温与物种多样性的相关性最强, 在6个最优线性模型中贡献最大。根据物种多样性地理格局的环境热量假说, 温度越高, 越有利于促进物种分化并提高物种多样性(Currie, 1991)。但是, 本研究结果显示温度对物种多样性的影响呈现中峰模式, 这与环境热量假说存在差异。这种差异可能是由于高山生态系统虽然随海拔变化形成的环境差异与纬度相似, 但是还是存在一定的差异, 而环境热量假说是基于纬度的地理差异提出的(Currie, 1991)。
综上, 秦岭南坡洋县辖区哺乳动物物种多样性的空间分布格局受到人为干扰、海拔、温度等多种因素的影响。北部和东部的中高海拔地区具有较高的物种多样性, 为此, 应加强对洋县辖区中高海拔地区的保护, 以维系该区域较高的生物多样性。
致谢: 感谢参与野外动物调查工作的巩会生、段延、刘红红、王子星、李冬森、杜晨、李凯亮、王江涛、李林宇等多位人员, 特别感谢巩会生帮助制作哺乳动物标本。
附录 Supplementary Material
附录1 秦岭南坡陕西洋县辖区的哺乳动物名录
Appendix 1 List of mammal species in Yangxian County of Shaanxi Province on the southern slope of the Qinling Mountains
参考文献
The mid-domain effect: Geometric constraints on the geography of species richness
Energy and large-scale patterns of animal- and plant-species richness
DOI:10.1086/285144
URL
[本文引用: 2]

Many hypotheses have been proposed to explain the great variation among regions in species richness. These were tested by first examining patterns of species richness of birds, mammals, amphibians, and reptiles in 336 quadrats covering North America. These patterns were then compared with the regional variation of 21 descriptors of the environment suggested by the hypotheses. I found that, in the four vertebrate classes studied, 80%-93% of the variability in species richness could be statistically explained by a monotonically increasing function of a single variable: annual potential evapotranspiration (PET). In contrast, tree richness is more closely related to actual evapotranspiration (AET). Both AET and PET appear to be measures of available environmental energy. The relationships between tree and vertebrate richness are strikingly poor. Species richness in particular orders and families of the Vertebrata is also closely related to PET, but not always monotonically, often resembling a replacement series along an environmental gradient. The present results are consistent with the hypothesis that environmentally available energy limits regional species richness. However, my observations are not completely consistent with earlier species-energy theory. The energy-richness relationship appears to depend on scale, and it is affected differently by variations in area and in areal energy flux.
Energy, water, and broad-scale geographic patterns of species richness
DOI:10.1890/03-8006 URL [本文引用: 1]
Animal resources in Changqing Nature Reserve
DOI:10.3969/j.issn.1000-7083.2001.03.005
URL
[本文引用: 2]
对长青国家级自然保护区的兽类资源进行了为期三年多的调查。结果表明保护区内已知兽类52种,隶属于7目23科46属。其中,国家Ⅰ级保护动物5种,Ⅱ级保护动物9种。
长青自然保护区的兽类资源
DOI:10.3969/j.issn.1000-7083.2001.03.005
URL
[本文引用: 2]
对长青国家级自然保护区的兽类资源进行了为期三年多的调查。结果表明保护区内已知兽类52种,隶属于7目23科46属。其中,国家Ⅰ级保护动物5种,Ⅱ级保护动物9种。
Baseline survey of mammal and bird diversity using camera-trapping in the Changqing National Nature Reserve of Shaanxi Province
DOI:10.16829/j.slxb.201603011
URL
[本文引用: 2]
野生动物多样性的有效保护与管理,需要大范围、长时间的系统监测网络支持。红外相机调查技术近年来已成为自然保护区鸟兽调查的最有效工具之一,为了解和掌握区域性乃至全国性的生物多样性现状,提供了最直接和最基础的数据。长青国家级自然保护区位于秦岭南坡,地处秦岭自然保护区群的核心地带。自2008年至2011年,使用被动式红外触发相机技术调查大中型兽类与鸟类的本底。共完成有效调查位点435个,相机工作日15 767 d。获得兽类有效拍摄3 282次,记录到分属5目12科的21种野生兽类和1种家畜,其中国家Ⅰ级和Ⅱ级重点保护野生动物各有5种,被IUCN物种红色名录评估为濒危(EN)、易危(VU)、近危(NT)的物种分别有2、3、4种。食肉目和偶蹄目是本次调查兽类记录中物种数量(分别有9种和7种)和有效拍摄数(分别占兽类有效拍摄数的13.5%和84.0%)最高的两个类群,食肉目中相对多度指数最高的物种是大熊猫(Ailuropoda melanoleuca,12.30),偶蹄目中最高的物种是羚牛(Budorcas taxicolor,114.04)。保护区内大型兽类(食肉目和偶蹄目)物种多样性沿海拔梯度,大体呈现中部高、两侧低的单峰模式,海拔1 600-2 200 m的中等海拔段是大型兽类多样性最高的区域。鸟类有效拍摄191次,记录到分属4目8科的17种鸟类,其中国家Ⅱ级重点保护野生动物物种8种。鸡形目雉科鸟类是有效拍摄数最高的类群,占全部鸟类拍摄数的79.8%。调查中记录到的林猬(Mesechinus hughi)和鹰雕(Spizaetus nipalensis)为长青自然保护区的新记录种。调查结果提供了较为全面的区内大中型兽类和鸟类群落的本底信息,为后续的保护管理规划和长期监测提供了数据支持和指导。
基于红外相机技术调查长青国家级自然保护区兽类和鸟类多样性
DOI:10.16829/j.slxb.201603011
URL
[本文引用: 2]
野生动物多样性的有效保护与管理,需要大范围、长时间的系统监测网络支持。红外相机调查技术近年来已成为自然保护区鸟兽调查的最有效工具之一,为了解和掌握区域性乃至全国性的生物多样性现状,提供了最直接和最基础的数据。长青国家级自然保护区位于秦岭南坡,地处秦岭自然保护区群的核心地带。自2008年至2011年,使用被动式红外触发相机技术调查大中型兽类与鸟类的本底。共完成有效调查位点435个,相机工作日15 767 d。获得兽类有效拍摄3 282次,记录到分属5目12科的21种野生兽类和1种家畜,其中国家Ⅰ级和Ⅱ级重点保护野生动物各有5种,被IUCN物种红色名录评估为濒危(EN)、易危(VU)、近危(NT)的物种分别有2、3、4种。食肉目和偶蹄目是本次调查兽类记录中物种数量(分别有9种和7种)和有效拍摄数(分别占兽类有效拍摄数的13.5%和84.0%)最高的两个类群,食肉目中相对多度指数最高的物种是大熊猫(Ailuropoda melanoleuca,12.30),偶蹄目中最高的物种是羚牛(Budorcas taxicolor,114.04)。保护区内大型兽类(食肉目和偶蹄目)物种多样性沿海拔梯度,大体呈现中部高、两侧低的单峰模式,海拔1 600-2 200 m的中等海拔段是大型兽类多样性最高的区域。鸟类有效拍摄191次,记录到分属4目8科的17种鸟类,其中国家Ⅱ级重点保护野生动物物种8种。鸡形目雉科鸟类是有效拍摄数最高的类群,占全部鸟类拍摄数的79.8%。调查中记录到的林猬(Mesechinus hughi)和鹰雕(Spizaetus nipalensis)为长青自然保护区的新记录种。调查结果提供了较为全面的区内大中型兽类和鸟类群落的本底信息,为后续的保护管理规划和长期监测提供了数据支持和指导。
Small mammal diversity along elevational gradients in the Philippines: An assessment of patterns and hypotheses
Elevational patterns of non-volant small mammal species richness in Gyirong Valley, Central Himalaya: Evaluating multiple spatial and environmental drivers
DOI:10.1111/jbi.13102
URL
[本文引用: 1]
react-text: 345 The species richness pattern along spatial scales (latitudinal or elevational) forms useful tools in understanding diversity gradients and their underlying mechanisms. Understanding elevational diversity patterns of biodiversity have strong conservation implications. Himalayas are unique systems in exploring such gradients as they harbor tallest mountains in the world. Here, we explored the... /react-text react-text: 346 /react-text [Show full abstract]
The elevational patterns of mammalian richness in the Himalayas
生物多样性的空间分布及其相关机制一直是生态学、生物地理学和保护生物学研究的热点问题。山地生态系统生境异质性和生物多样性高, 适合研究生物多样性空间分布及其相关机制。喜马拉雅山脉位于青藏高原南缘, 是全球生态热点区域。其地形复杂, 海拔落差大(100–8,844 m), 具有明显的垂直气候带。本研究通过整合野外调查和文献资料, 系统地分析了10目23科160属313种喜马拉雅山地区哺乳动物物种多样性的垂直分布格局, 发现该区域哺乳动物总体及其子集的物种多样性垂直分布格局都为左偏倚的中峰格局, 物种多样性在海拔900–1,400 m 之间最高, 不同物种子集的物种多样性垂直分布格局的模式有所不同。UPGMA聚类分析表明, 喜马拉雅山地区哺乳动物群落沿海拔梯度可以划分为5个聚类簇(海拔100–1,500 m、1,500–2,000 m、2,000–3,000 m、3,000–4,200 m以及4,200–6,000 m的地区), 大致与该地区植被的垂直带分布相吻合。喜马拉雅山地区哺乳动物物种多样性在中低海拔最为丰富, 可能跟东洋界与古北界生物群扩散后的交汇地带相关。喜马拉雅山区贯通南北的沟谷是生物扩散和迁移的通道, 沟谷内水热资源较好, 气候稳定性高, 为高山生态系统内各种生物创造了栖息条件。综上, 喜马拉雅山沟谷地区是生物多样性热点地区, 也是生物扩散和交流关键的“生态走廊”, 应加强对喜马拉雅山沟谷地区的保护, 以维系该区域较高的生物多样性。
喜马拉雅山哺乳动物物种多样性垂直分布格局
生物多样性的空间分布及其相关机制一直是生态学、生物地理学和保护生物学研究的热点问题。山地生态系统生境异质性和生物多样性高, 适合研究生物多样性空间分布及其相关机制。喜马拉雅山脉位于青藏高原南缘, 是全球生态热点区域。其地形复杂, 海拔落差大(100–8,844 m), 具有明显的垂直气候带。本研究通过整合野外调查和文献资料, 系统地分析了10目23科160属313种喜马拉雅山地区哺乳动物物种多样性的垂直分布格局, 发现该区域哺乳动物总体及其子集的物种多样性垂直分布格局都为左偏倚的中峰格局, 物种多样性在海拔900–1,400 m 之间最高, 不同物种子集的物种多样性垂直分布格局的模式有所不同。UPGMA聚类分析表明, 喜马拉雅山地区哺乳动物群落沿海拔梯度可以划分为5个聚类簇(海拔100–1,500 m、1,500–2,000 m、2,000–3,000 m、3,000–4,200 m以及4,200–6,000 m的地区), 大致与该地区植被的垂直带分布相吻合。喜马拉雅山地区哺乳动物物种多样性在中低海拔最为丰富, 可能跟东洋界与古北界生物群扩散后的交汇地带相关。喜马拉雅山区贯通南北的沟谷是生物扩散和迁移的通道, 沟谷内水热资源较好, 气候稳定性高, 为高山生态系统内各种生物创造了栖息条件。综上, 喜马拉雅山沟谷地区是生物多样性热点地区, 也是生物扩散和交流关键的“生态走廊”, 应加强对喜马拉雅山沟谷地区的保护, 以维系该区域较高的生物多样性。
The community structure and elevational patterns of forest ungulates at the southern slope of the Qinling Mountains, China
DOI:10.13859/j.cjz.201405001
URL
[本文引用: 2]
The elevational patterns of wildlife population and community attract broad interests in ecology research, wherever our knowledge on the patterns of large mammal fauna is poor. To determine the elevational pattern of ungulates in temperate mountainous forest of the southern slope of the Qinling Mountains, China, we conducted a camera-trapping survey on large terrestrial mammals in Changqing National Nature Reserve with systematic sampling. The reserve was divided into 500 m 500 m grids and one passive infrared-triggered camera was set in each sampling block for a survey duration of 4-6 weeks. We calculated the Relative Abundance Index (RAI) and species richness of detected forest ungulates at 300 m elevational intervals throughout the study area (elevation range 1 400-3 000 m). We surveyed 123 camera locations from March to December, 2008, and detected seven ungulate species with a sampling effort of 4 307 trap-days. Takin (Budorcas taxicolor) was the most abundant ungulate species (mean RAI = 110.66), followed by wild boar (Sus scrofa, RAI = 28.25) and Chinese goral (Naemorhedus goral, RAI = 25.10), whereas forest musk deer (Moschus berezovskii) was the least (RAI = 1.33). We detected a unimodal elevational pattern in the populations of takin and forest musk deer, a liner pattern for Chinese goral (R2 = 0.84), Reeve muntjac (Muntiacus reevesi, R2 = 0.94) and serow (Capricornis sumatraensis, R2 = 0.79), and a multiplex pattern for wild boar and tufted deer (Elaphodus cephalophus). The species richness of this ungulate community represented a unimodal pattern along an elevational gradient, with a mid-elevation peak at 1 700-2 300 m, which consisted with the prediction of mid-domain effect hypothesis.
秦岭南坡森林有蹄类群落组成与垂直分布特征
DOI:10.13859/j.cjz.201405001
URL
[本文引用: 2]
The elevational patterns of wildlife population and community attract broad interests in ecology research, wherever our knowledge on the patterns of large mammal fauna is poor. To determine the elevational pattern of ungulates in temperate mountainous forest of the southern slope of the Qinling Mountains, China, we conducted a camera-trapping survey on large terrestrial mammals in Changqing National Nature Reserve with systematic sampling. The reserve was divided into 500 m 500 m grids and one passive infrared-triggered camera was set in each sampling block for a survey duration of 4-6 weeks. We calculated the Relative Abundance Index (RAI) and species richness of detected forest ungulates at 300 m elevational intervals throughout the study area (elevation range 1 400-3 000 m). We surveyed 123 camera locations from March to December, 2008, and detected seven ungulate species with a sampling effort of 4 307 trap-days. Takin (Budorcas taxicolor) was the most abundant ungulate species (mean RAI = 110.66), followed by wild boar (Sus scrofa, RAI = 28.25) and Chinese goral (Naemorhedus goral, RAI = 25.10), whereas forest musk deer (Moschus berezovskii) was the least (RAI = 1.33). We detected a unimodal elevational pattern in the populations of takin and forest musk deer, a liner pattern for Chinese goral (R2 = 0.84), Reeve muntjac (Muntiacus reevesi, R2 = 0.94) and serow (Capricornis sumatraensis, R2 = 0.79), and a multiplex pattern for wild boar and tufted deer (Elaphodus cephalophus). The species richness of this ungulate community represented a unimodal pattern along an elevational gradient, with a mid-elevation peak at 1 700-2 300 m, which consisted with the prediction of mid-domain effect hypothesis.
Geographic patterns and environmental correlates of terrestrial mammal species richness in China
DOI:10.3724/SP.J.1003.2009.09065
URL
[本文引用: 1]
物种丰富度的大尺度地理格局及其成因是宏观生态学和生物地理学的中心议题之一。本文利用中国陆栖哺乳动物分布数据,结合高分辨率的气候、地形、植被等环境信息,探讨了中国陆栖哺乳动物及主要类群的物种丰富度格局及其影响因素。结果显示,中国陆栖哺乳动物物种丰富度具有显著的纬度梯度格局,总体上呈现出由低纬度向高纬度逐渐减少的趋势,并与宏观地形具有良好的对应关系;其中,亚热带、热带西部山区的物种丰富度最高,而东部平原地区、西北干旱区和青藏高原腹地则是丰富度的低值区。各主要类群的物种丰富度格局既有相似性,又存在差异。最优线性模型的分析结果显示,由归一化植被指数(NDVI)、生态系统类型数和气温年较差构成的回归模型对哺乳动物物种丰富度格局的解释率最高,其中NDVI对模型解释率的贡献最大,这表明中国陆栖哺乳动物物种丰富度的地理分异受多种环境因素的共同影响,其中植被生产力起主导作用。各主要类群的最优线性模型显示,影响物种丰富度格局的主要环境因子因类群而异,这可能反映了各类群进化历史及生理适应的差异。
中国陆栖哺乳动物物种丰富度的地理格局及其与环境因子的关系
DOI:10.3724/SP.J.1003.2009.09065
URL
[本文引用: 1]
物种丰富度的大尺度地理格局及其成因是宏观生态学和生物地理学的中心议题之一。本文利用中国陆栖哺乳动物分布数据,结合高分辨率的气候、地形、植被等环境信息,探讨了中国陆栖哺乳动物及主要类群的物种丰富度格局及其影响因素。结果显示,中国陆栖哺乳动物物种丰富度具有显著的纬度梯度格局,总体上呈现出由低纬度向高纬度逐渐减少的趋势,并与宏观地形具有良好的对应关系;其中,亚热带、热带西部山区的物种丰富度最高,而东部平原地区、西北干旱区和青藏高原腹地则是丰富度的低值区。各主要类群的物种丰富度格局既有相似性,又存在差异。最优线性模型的分析结果显示,由归一化植被指数(NDVI)、生态系统类型数和气温年较差构成的回归模型对哺乳动物物种丰富度格局的解释率最高,其中NDVI对模型解释率的贡献最大,这表明中国陆栖哺乳动物物种丰富度的地理分异受多种环境因素的共同影响,其中植被生产力起主导作用。各主要类群的最优线性模型显示,影响物种丰富度格局的主要环境因子因类群而异,这可能反映了各类群进化历史及生理适应的差异。
Changes in plant species diversity of natural coniferous forests along the altitudinal gradient in the Youshui River, Qinling Mountains
基于群落样地的物种重要值矩阵信息,运用双向聚类法对秦岭酉水河流域的主要天然针叶林群落进 行了数量分类,并采用物种丰富度、α-多样性和β-多样性等指数,进一步研究了该地区天然针叶林植物多样性随海拔梯度的变化。结果表明:酉水河流域14个 天然针叶林样地被划分为6个群系类型;随着海拔的升高,物种丰富度、Shannon—Wiener指数及Pielou均匀度指数呈现先上升后下降的分布格 局;6种天然针叶林群系类型的丰富度指数和α-多样性指数表现为铁杉林〉华山松林〉油松林〉太白红杉林〉巴山冷杉林〉巴山冷杉+红桦林;β-多样性 (Cody指数)随海拔的升高逐渐降低。
秦岭酉水河天然针叶林物种多样性的垂直格局
基于群落样地的物种重要值矩阵信息,运用双向聚类法对秦岭酉水河流域的主要天然针叶林群落进 行了数量分类,并采用物种丰富度、α-多样性和β-多样性等指数,进一步研究了该地区天然针叶林植物多样性随海拔梯度的变化。结果表明:酉水河流域14个 天然针叶林样地被划分为6个群系类型;随着海拔的升高,物种丰富度、Shannon—Wiener指数及Pielou均匀度指数呈现先上升后下降的分布格 局;6种天然针叶林群系类型的丰富度指数和α-多样性指数表现为铁杉林〉华山松林〉油松林〉太白红杉林〉巴山冷杉林〉巴山冷杉+红桦林;β-多样性 (Cody指数)随海拔的升高逐渐降低。
Measurement of biotic community diversity. I. α diversity (Part 2)
生物群落多样性的测度方法Ⅰα多样性的测度方法(上)马克平(中国科学院植物研究所,北京100044)1引言生物群落是在一定地理区域内,生活在同一环境下的不同种群的集合体,其内部存在着极为复杂的相互联系。由于功能整合原理,即系统的加合性或突生性(emer...
生物群落多样性的测度方法. I. α多样性的测度方法(下)
生物群落多样性的测度方法Ⅰα多样性的测度方法(上)马克平(中国科学院植物研究所,北京100044)1引言生物群落是在一定地理区域内,生活在同一环境下的不同种群的集合体,其内部存在着极为复杂的相互联系。由于功能整合原理,即系统的加合性或突生性(emer...
Elevational gradients in diversity of small mammals
DOI:10.1890/03-3147
URL
[本文引用: 2]
A global analysis of elevational diversity trends for nonvolant small mammals revealed a clear pattern of mid-elevational peaks in species richness. Fifty-six data sets were used to test the predictions of a null model (the mid-domain effect) and climatic hypotheses. Very few data sets fit entirely within the predictions of the null model, and the average predictive power of the null model was low. Regional (gamma) diversity fit the null model better than did local (alpha) diversity. Diversity peaked at higher elevations on taller mountains, consistent with climatic factors producing elevationally correlated habitat bands (Massenerhebung effect). This positive, linear relationship was documented for all data sets but was particularly pronounced for alpha diversity. Gamma diversity, which is generally highly influenced by area, exhibited a trend of highest diversity shifting toward lower elevations, and higher elevational peaks in species diversity at higher latitudes. The elevation of temperate diversity peaks exhibited a negative association with latitude. These results are evidence for the importance of a suite of interacting climatic, area, and geometric factors on elevational diversity patterns, apparent in spite of noise associated with different sampling techniques, localities, and historical pressures.
The echo pattern of species diversity: Pattern and processes
DOI:10.1111/j.1600-0587.1999.tb00510.x
URL
[本文引用: 1]
Ecologists need not despair ot discovering the mechanisms that lead to large scale patterns. The search for process at higher scales has already led to enhanced confidence in the patterns and to improvements in their description. For example, species-area relationships turn out to form not one. but three patterns. Each is controlled by gain-loss dynamics at its own scale. At the macroscale, origination and global extinction reign. At the archipelagic scale, immigration and island extinction determine the results. At the local scale, metapopulation processes do. The three scales exhibit species-area curves with systematically different slopes in logarithmic space. We use the three scales of species-area to illuminate the relationship between local and regional diversity. Algebra shows that the latter pattern is an echo of species-area curves, and that those echoes ought to be nearly linear. So. we call the relationship of local and regional diversity, the Echo pattern. Ecology has long known that species-area curves within a region reflect the accumulation of habitat variety. Thus, their connection to Echo patterns argues against concluding that local diversity has little or nothing to do with population interactions. To obtain a pure Echo pattern, one should draw data from independent regions rather than separate islands. The independence allows natural selection to adjust the fundamental niches of species to diversity. Theory suggests that higher diversity should shrink niches, allowing the coexistence of more species locally. Hence, independence should tend to produce the straightest Echoes. However, archipelagic species-area curves predict that even when different islands are used as the regions, the Echoes should show only very gentle curvatures. Flouting theory, some archipelagic Echoes approach an asymptote as regional diversity increases. These must have logarithmic slopes that increase with regional pool size. We do not understand why.
Scale effects on the pattern and predictors of small mammal diversity along a local elevational gradient in the Great Basin
DOI:10.1111/jbi.12554
URL
[本文引用: 1]
Abstract Aim Evaluation of the generality of the diversity levation relationship has highlighted effects of scale (spatial extent and grain size) on pattern perception. In contrast, the effects of scale on the attribution of drivers of diversity along elevational gradients remain largely unexplored. This is important because many causal factors have been proposed, and remotely sensed data about abiotic factors are available at increasingly fine grain sizes. Here, we evaluate the effects both of the resolution of the species diversity estimate on the pattern perceived, and of environmental predictor grain size on the potential contribution to each pattern. Location Ruby Mountains, Nevada, western North America. Methods For the small mammal fauna along one local elevational gradient, we compared patterns among estimates of richness derived from site-based occurrences rarefied by survey effort and those inferred from interpolation across species elevational ranges. Using an information-theoretic approach, we evaluated the relative importance of spatial and environmental factors in structuring each richness distribution. Climate and habitat were assessed at coarse and fine grain sizes. Comparisons were based on model fit and relative variable importance. Results We find general congruence in the diversity levation relationship, with peak diversity near the midpoint of the sampled gradient. Despite this commonality in pattern, we find the attribution of underlying drivers is substantially influenced by the type of richness estimate and by the grain size of the predictor variables. Main conclusions Our results illustrate that the factors identified as predictors of diversity can be sensitive to grain size, and that this sensitivity is not equally apparent under different measures of richness obtained from the same survey data. We call for broader discussion of scale effects and resolution appropriateness for elevational diversity gradients. This is particularly important because mismatches in scale may result in misguided conservation or management initiatives.
Different elevational patterns of rodent species richness between the southern and northern slopes of a mountain
DOI:10.1038/s41598-017-09274-2
URL
PMID:28821828
[本文引用: 3]
Studies on elevational gradients in biodiversity have accumulated in recent decades. However, few studies have compared the elevational patterns of diversity between the different slopes of a single mountain. We investigated the elevational distribution of rodent diversity (alpha and beta diversity) and its underlying mechanisms along the southern and northern slopes of Mt. Taibai, the highest mountain in the Qinling Mountains, China. The species richness of rodents on the two slopes showed distinct distribution patterns, with a monotonically decreasing pattern found along the southern slope and a hump-shaped elevational pattern evident along the northern slope. Multi-model inference suggested that temperature was an important explanatory factor for the richness pattern along the southern slope, and the mid-domain effect (MDE) was important in explaining the richness pattern along the northern slope. The two slopes also greatly differed in the elevational patterns of species turnover, with the southern slope demonstrating a U-shaped curve and the northern slope possessing a roughly hump-shaped pattern. Our results suggest that even within the same mountain, organisms inhabiting different slopes may possess distinct diversity patterns, and the underlying mechanisms may also differ. The potential role of the factors associated with slope aspect in shaping diversity, therefore, cannot be ignored.
Shannon-Wiener index. In: Encyclopedia of Ecology (eds Jørgensen SE, Fath BD)
pp.
The latitudinal gradient in geographical range: How so many species coexist in the tropics
DOI:10.1086/284913
URL
[本文引用: 1]
The latitudinal gradient in species richness is paralleled by a latitudinal gradient in geographical-range size called Rapoport''s rule. It is suggested that the greater annual range of climatic conditions to which individuals in high-latitude environments are exposed relative to what low-latitude organisms face has favored the evolution of broad climatic tolerances in high-latitude species. This broad tolerance of individuals from high latitudes has led to wider latitudinal extent in the geographical range of high-latitude species than of lower-latitude species. The existence of Rapoport''s rule suggests yet another way of looking at the latitudinal gradient in species richness. If low-latitude species typically have narrower environmental tolerances than high-latitude species, then equal dispersal abilities in the two groups would place more tropical organisms out of their preferred habitat than higher-latitude species out of their preferred habitat. It is hypothesized that a larger number of "accidentals" (i.e., species that are poorly suited for the habitat) occur in tropical assemblages. The constant input of these accidentals artificially inflates species numbers and inhibits competitive exclusion.
Patterns of woody plant species diversity along environmental gradients on Mt. Taibai, Qinling Mountains
DOI:10.3321/j.issn:1005-0094.2004.01.014
URL
[本文引用: 1]
物种多样性沿环境梯度的分布格局是生物多样性研究的重要议题 ,而海拔梯度包含了各种环境因子的综合影响 ,因此对于探讨物种多样性沿环境梯度的分布格局具有重要意义。秦岭山脉地处我国暖温带向亚热带的过渡带 ,其植被垂直带和物种多样性分布格局对于研究我国南北部植被分异特征具有重要意义。基于对秦岭山脉太白山南北坡海拔 12 0 0 - 375 0m之间的垂直样带调查的 83个样方 ,本文利用植被数量分析方法 (DCA和TWINSPAN)和Shannon Wiener多样性指数、Pielou指数以及Jaccard相异性系数对太白山木本植物物种多样性在南北坡沿海拔梯度分布格局进行了初步研究。结果表明 :太白山的木本植物群落具有明显的环境梯度格局 ,海拔是决定太白山植物群落分布的主要因素 ,而坡向起到次要作用。植物群落类型与坡向的关系不大 ,当考虑群落的环境梯度格局时 ,DCA第一轴主要与年均温密切相关 ,而第二轴则取决于年平均相对湿度。乔木层和灌木层的物种具有相似的海拔梯度格局 ,植物群落中木本植物物种丰富度和多样性随着海拔的升高单调下降 ;群落均匀度随着海拔变化的规律不明显 ;灌木层的物种多样性比乔木层更为丰富 ,而南坡具有比北坡更多的物种数和更高的多样性。相邻海拔之间群落的相异性在南北坡具有不同的分布格局 ,在
秦岭太白山木本植物物种多样性的梯度格局及环境解释
DOI:10.3321/j.issn:1005-0094.2004.01.014
URL
[本文引用: 1]
物种多样性沿环境梯度的分布格局是生物多样性研究的重要议题 ,而海拔梯度包含了各种环境因子的综合影响 ,因此对于探讨物种多样性沿环境梯度的分布格局具有重要意义。秦岭山脉地处我国暖温带向亚热带的过渡带 ,其植被垂直带和物种多样性分布格局对于研究我国南北部植被分异特征具有重要意义。基于对秦岭山脉太白山南北坡海拔 12 0 0 - 375 0m之间的垂直样带调查的 83个样方 ,本文利用植被数量分析方法 (DCA和TWINSPAN)和Shannon Wiener多样性指数、Pielou指数以及Jaccard相异性系数对太白山木本植物物种多样性在南北坡沿海拔梯度分布格局进行了初步研究。结果表明 :太白山的木本植物群落具有明显的环境梯度格局 ,海拔是决定太白山植物群落分布的主要因素 ,而坡向起到次要作用。植物群落类型与坡向的关系不大 ,当考虑群落的环境梯度格局时 ,DCA第一轴主要与年均温密切相关 ,而第二轴则取决于年平均相对湿度。乔木层和灌木层的物种具有相似的海拔梯度格局 ,植物群落中木本植物物种丰富度和多样性随着海拔的升高单调下降 ;群落均匀度随着海拔变化的规律不明显 ;灌木层的物种多样性比乔木层更为丰富 ,而南坡具有比北坡更多的物种数和更高的多样性。相邻海拔之间群落的相异性在南北坡具有不同的分布格局 ,在
Altitudinal patterns of plant species diversity in Mt. Niubeiliang, Qinling Mountains
DOI:10.3321/j.issn:1005-0094.2004.01.013
URL
[本文引用: 1]
Using quantitative analysis (DCA and TWINSPAN), the vegetation and plant species diversity patterns along the elevation gradient in Mt. Niubeiliang, Qinling Mountains were studied based on 51 plots along two altitudinal transects between 1500 m and 2800 m on northern and southern slopes. Plant communities varied continuously along the elevation gradient. From low to high elevation, mountain oak forest, mountain birch forest, subalpine fir forests and subalpine shrub occurred on both slopes. Relationship between communities and topographic variables were analyzed by detrended correspondence analysis (DCA). Elevation was the primary determinant of floristic composition in Mt. Niubeiliang, and followed by exposure. In terms of species diversity, different patterns existed among total number of species, woody species richness and herbaceous species richness, and also between southern and northern slopes. The total number of species changed unimodally with elevation on the southern slope, peaking at middle elevations. No significant relationship between total number of species and elevation was detected on the northern slope. Woody species richness changed similarly on both southern and northern slopes, keeping stable at low elevations and decreasing monotonically with the increasing elevation at high elevations. In contrast, no significant pattern of herbaceous plant richness existed along the elevation gradient. diversity was higher at lower and higher elevations than in the mid-altitudinal zone, indicating a more homogeneous habitat at middle elevation than upper and lower elevations. Human disturbance at lower elevation and the timberline ecotone at higher elevations may contribute to the increase of diversity in these areas.
秦岭牛背梁植物物种多样性垂直分布格局
DOI:10.3321/j.issn:1005-0094.2004.01.013
URL
[本文引用: 1]
Using quantitative analysis (DCA and TWINSPAN), the vegetation and plant species diversity patterns along the elevation gradient in Mt. Niubeiliang, Qinling Mountains were studied based on 51 plots along two altitudinal transects between 1500 m and 2800 m on northern and southern slopes. Plant communities varied continuously along the elevation gradient. From low to high elevation, mountain oak forest, mountain birch forest, subalpine fir forests and subalpine shrub occurred on both slopes. Relationship between communities and topographic variables were analyzed by detrended correspondence analysis (DCA). Elevation was the primary determinant of floristic composition in Mt. Niubeiliang, and followed by exposure. In terms of species diversity, different patterns existed among total number of species, woody species richness and herbaceous species richness, and also between southern and northern slopes. The total number of species changed unimodally with elevation on the southern slope, peaking at middle elevations. No significant relationship between total number of species and elevation was detected on the northern slope. Woody species richness changed similarly on both southern and northern slopes, keeping stable at low elevations and decreasing monotonically with the increasing elevation at high elevations. In contrast, no significant pattern of herbaceous plant richness existed along the elevation gradient. diversity was higher at lower and higher elevations than in the mid-altitudinal zone, indicating a more homogeneous habitat at middle elevation than upper and lower elevations. Human disturbance at lower elevation and the timberline ecotone at higher elevations may contribute to the increase of diversity in these areas.
Distribution patterns and species diversity of mammals in Anhui Province
DOI:10.3969/j.issn.1000-1050.2007.02.012
URL
[本文引用: 1]
Geographical distribution patterns of mammal species in Anhui Province were studied using cluster analysis in this paper 425 equal-area quadrangle grids that each had an area of 404. 685 km were used as geographical units to collect the distribution data,and based on species range and range types of mammals,all geographical units were designated into groups by hierarchical cluster analysis according to Jaccard similarity and Chi-square. The results of species richness patterns showed that there was higher species richness of mammals in the mountainous regions than plain regions,that is species richness in the mountainous region of southern Anhui was higher than in Dabieshan,western Anhui,and species richness in the hilly region between Yangtze River and Huaihe River is higher than the plain region of northern Huaihe River. Cluster analysis of distribution units by species showed that the 425 units could be designated into 9,5,3 and 2 groups,where Jaccard similarity was 0.647,0.570,0.461 and 0.399. The result indicated the distribution of mammal species were relative to human activities and landform. Cluster analysis of distribution units by range types showed that the 425 units could be designated into 9,5,3 and 2 groups,when Chisquare was 1.561,1.759,2.521 and 3.509. In order to study the boundary between the Palearctic and Indomalayan (or Oriental) Regions in Anhui,we sorted all mammals species into 4 range types according to their ranges and origin. These range types were identified as: (1) Palearctic (species with ranges or major ranges in Palearctic),(2) Indomalayan (species with ranges or major ranges in Indomalayan),(3) Southeast-Asian (species with ranges extending to both sides of the boundary between the Palearctic and Indomalayan regions and that only in Southeast China,Korea,and Japan),and (4)Widely Distributed (species with wild ranges both in Palearctic and Indomalayan). All species of the 4 range types were analyzed into 9 groups. The approximate fauna boundary could be drawn along Yangtze River,and there was an evid nt tr nsit onal one, ith t e nor hern orde alon the orth rn sl pe of Dabieshan Mountain - Lu'an City - Shucheng County - Hefei City - Dingyuan County - Lai'an County, and southern border along the north of Dongzhi County - Guichi City - Qingyang County -Nanling County - the northern of Xuanzhou City - Guangde County.
安徽省兽类物种多样性及其分布格局
DOI:10.3969/j.issn.1000-1050.2007.02.012
URL
[本文引用: 1]
Geographical distribution patterns of mammal species in Anhui Province were studied using cluster analysis in this paper 425 equal-area quadrangle grids that each had an area of 404. 685 km were used as geographical units to collect the distribution data,and based on species range and range types of mammals,all geographical units were designated into groups by hierarchical cluster analysis according to Jaccard similarity and Chi-square. The results of species richness patterns showed that there was higher species richness of mammals in the mountainous regions than plain regions,that is species richness in the mountainous region of southern Anhui was higher than in Dabieshan,western Anhui,and species richness in the hilly region between Yangtze River and Huaihe River is higher than the plain region of northern Huaihe River. Cluster analysis of distribution units by species showed that the 425 units could be designated into 9,5,3 and 2 groups,where Jaccard similarity was 0.647,0.570,0.461 and 0.399. The result indicated the distribution of mammal species were relative to human activities and landform. Cluster analysis of distribution units by range types showed that the 425 units could be designated into 9,5,3 and 2 groups,when Chisquare was 1.561,1.759,2.521 and 3.509. In order to study the boundary between the Palearctic and Indomalayan (or Oriental) Regions in Anhui,we sorted all mammals species into 4 range types according to their ranges and origin. These range types were identified as: (1) Palearctic (species with ranges or major ranges in Palearctic),(2) Indomalayan (species with ranges or major ranges in Indomalayan),(3) Southeast-Asian (species with ranges extending to both sides of the boundary between the Palearctic and Indomalayan regions and that only in Southeast China,Korea,and Japan),and (4)Widely Distributed (species with wild ranges both in Palearctic and Indomalayan). All species of the 4 range types were analyzed into 9 groups. The approximate fauna boundary could be drawn along Yangtze River,and there was an evid nt tr nsit onal one, ith t e nor hern orde alon the orth rn sl pe of Dabieshan Mountain - Lu'an City - Shucheng County - Hefei City - Dingyuan County - Lai'an County, and southern border along the north of Dongzhi County - Guichi City - Qingyang County -Nanling County - the northern of Xuanzhou City - Guangde County.
Study on elevational patterns of plant species diversity and community complexity in Foping Natural Reserve. Acta Botanica Boreali-Occidentalia Sinica
DOI:10.3969/j.issn.1000-4025.2013.01.026
URL
[本文引用: 1]
The plant communities in Foping Natural Reserve were explored in this study.The diversity index and Huffman coding were used to examine the diversity and complexity of plant communities,as well as the relationship between complexity and species diversity.The results showed that:(1)The species diversity and complexity of plant communities presented a “low-high-low” pattern of skewed normal distribution as the altitude increased.The largest region of total complexity and diversity of plant community was concentrated from 1 300 to 1 500 m.The change pattern of total complexity and disorder complexity with altitude was similar to species diversity of communities (“low-high-low” pattern).However,the structure complexity had no regularity while the altitude increased.(2)Plant species diversity in the natural reserve was not only related with the altitude change,but also had close relationship with density of Bashania fargesii and Fargesia qinlingensis.The species diversity and species number significantly increased in the intersection of two bamboo groves.(3)The total complexity and disorder complexity of plant community had significant linear relations with the each index of species diversity,respectively.The variation of species diversity can totally express the changes of plant community complexity but can not be used to measure the structure complexity,because there is no significant correlation between species diversity and structure complexity.
佛坪自然保护区植物群落物种多样性和复杂性的海拔格局研究
DOI:10.3969/j.issn.1000-4025.2013.01.026
URL
[本文引用: 1]
The plant communities in Foping Natural Reserve were explored in this study.The diversity index and Huffman coding were used to examine the diversity and complexity of plant communities,as well as the relationship between complexity and species diversity.The results showed that:(1)The species diversity and complexity of plant communities presented a “low-high-low” pattern of skewed normal distribution as the altitude increased.The largest region of total complexity and diversity of plant community was concentrated from 1 300 to 1 500 m.The change pattern of total complexity and disorder complexity with altitude was similar to species diversity of communities (“low-high-low” pattern).However,the structure complexity had no regularity while the altitude increased.(2)Plant species diversity in the natural reserve was not only related with the altitude change,but also had close relationship with density of Bashania fargesii and Fargesia qinlingensis.The species diversity and species number significantly increased in the intersection of two bamboo groves.(3)The total complexity and disorder complexity of plant community had significant linear relations with the each index of species diversity,respectively.The variation of species diversity can totally express the changes of plant community complexity but can not be used to measure the structure complexity,because there is no significant correlation between species diversity and structure complexity.
Species richness patterns and mechanisms along the elevational gradients
物种丰富度垂直分布格局及影响机制
What drives the species richness patterns of non-volant small mammals along a subtropical elevational gradient?
DOI:10.1111/j.1600-0587.2011.07132.x
URL
The biodiversity of non-volant small mammals along an extensive subtropical elevational gradient was studied for the first time on Gongga Mountain, the highest mountain in Hengduan Mountain ranges in China, located in one of the 25 global biodiversity hotspots. Non-volant small mammals were replicate sampled in two seasons at eight sampling sites between 1000 and 4200 m elevation on the eastern slope of Gongga Mountain. In all, 726 individual small mammals representing 25 species were documented in 28 800 trap nights. The species richness pattern for non-volant small mammals along the elevational gradients was hump-shaped with highest richness at mid-elevations. However, different richness patterns emerged between endemic and non-endemic species, between larger-ranged and smaller-ranged species and between rodents and insectivores. Temperature, precipitation, plant species richness and geometric constraints (mid- domain effect) were most significant in explaining species richness patterns. Based on the analysis of simple ordinary least squares (OLS) and stepwise multiple regressions, the overall richness pattern, as well as the pattern of insectivores, endemic species and larger-ranged species showed strong correlation with geometric constraint predictions. However, non-endemic species richness was more strongly correlated with temperature, while rodent richness was correlated with plant species richness. Our study shows that no single key factor can explain all richness patterns of non-volant small mammals. We need to be cautious in summarizing a general richness pattern of large species groups (e.g. small mammals or mammals) from species in smaller groups having different ecological distributions and life histories. Elevational richness patterns and their driving factors for small mammals are more likely dependent on what kind of species we study.
Preliminary studies on the relationships between communities of small mammals and habitat types in Dujiangyan Region, Sichuan
DOI:10.3321/j.issn:1005-0094.2002.02.005
URL
[本文引用: 1]
于2000年10月底至11月初,对都江堰地区中亚热带常绿阔叶林带不同生境类型中小型哺乳动物群落的多 样性变化进行了初步研究.共捕获小型哺乳动物12种,其中啮齿目(Rodentia)鼠科(Muridae)10种,食虫目(Insectivora)鼩 鼱科(Soricidae)2种.总捕获率为10.67%.在所调查的7个生境中,以干扰较轻的次生林中小型哺乳动物物种多样性指数(1.8438)和均 匀度(0.9475)最高,灌丛、次生林1、原生林和弃耕地均有较高的多样性指数;农田受人类的干扰最严重,物种单一,优势度(0.5703)明显;柳杉 林中的多样性指数(1.3380)和均匀度(0.8313)均较低.但原生林的物种多样性指数(1.4305)略低于次生林(1.8475和 1.4610)、灌丛(1.6398)和弃耕地(1.6566).根据不同生境内群落相似性指数进行系统聚类,7个生境在相似性指数0.0952处全部聚 合在一起.灌丛、原生林和次生林中主要分布有森林型小型哺乳动物,聚为一类,为森林群落型;柳杉林和农田以大足鼠(Rattus nitidus)为优势种,聚为一类,为农田群落型;弃耕地一方面由于群落多样性指数较高(1.6566),另一方面其农田型小型哺乳动物仍占较高比例 (46.67%),所以在聚类图中另成一类,为农林交错型.结果表明,人类活动过度干扰的生境(如农田、柳杉林)多样性指数最低;适度干扰的生境(如次生 林、灌丛、弃耕地)多样性指数最高;干扰较少的生境(如原生林)多样性指数略低.
都江堰地区小型哺乳动物群落与生境类型关系的初步研究
DOI:10.3321/j.issn:1005-0094.2002.02.005
URL
[本文引用: 1]
于2000年10月底至11月初,对都江堰地区中亚热带常绿阔叶林带不同生境类型中小型哺乳动物群落的多 样性变化进行了初步研究.共捕获小型哺乳动物12种,其中啮齿目(Rodentia)鼠科(Muridae)10种,食虫目(Insectivora)鼩 鼱科(Soricidae)2种.总捕获率为10.67%.在所调查的7个生境中,以干扰较轻的次生林中小型哺乳动物物种多样性指数(1.8438)和均 匀度(0.9475)最高,灌丛、次生林1、原生林和弃耕地均有较高的多样性指数;农田受人类的干扰最严重,物种单一,优势度(0.5703)明显;柳杉 林中的多样性指数(1.3380)和均匀度(0.8313)均较低.但原生林的物种多样性指数(1.4305)略低于次生林(1.8475和 1.4610)、灌丛(1.6398)和弃耕地(1.6566).根据不同生境内群落相似性指数进行系统聚类,7个生境在相似性指数0.0952处全部聚 合在一起.灌丛、原生林和次生林中主要分布有森林型小型哺乳动物,聚为一类,为森林群落型;柳杉林和农田以大足鼠(Rattus nitidus)为优势种,聚为一类,为农田群落型;弃耕地一方面由于群落多样性指数较高(1.6566),另一方面其农田型小型哺乳动物仍占较高比例 (46.67%),所以在聚类图中另成一类,为农林交错型.结果表明,人类活动过度干扰的生境(如农田、柳杉林)多样性指数最低;适度干扰的生境(如次生 林、灌丛、弃耕地)多样性指数最高;干扰较少的生境(如原生林)多样性指数略低.
Resource, fauna and ecological distribution of large- and medium-sized mammals in Majiashan Nature Reserve, Shaanxi
DOI:10.3969/j.issn.1000-7083.2006.01.020
URL
[本文引用: 1]
马家山自然保护区(105°28′~105°40′E,32°50′~32°56′N)属秦岭西段的南坡山地。采用样线调查法和访问调查法,于2004年10~11月,对该保护区大中型兽类(包括灵长类、食肉动物和偶蹄动物)的资源、区系和生态分布进行了研究。该保护区共有23种大中型兽类,其中属我国Ⅰ级、Ⅱ级重点保护动物的兽类分别有5种和9种。它是秦岭物种多样性保护的关键地区之一。金丝猴和猕猴在此同域分布,大熊猫和羚牛四川亚种也分布于此地,该保护区是这4个珍稀濒危物种的一个新分布区。区内的23种兽类中没有古北界的区系成分,而属于东洋界成分的兽类有17种,占73.9%;其余6种为广布种,占26.1%。分析该区域23种兽类的生态分布发现,常绿落叶阔叶混交林、落叶阔叶林和针阔叶混交林中分别有16种、20种和12种动物活动。这些物种的垂直分布幅度有很大的差异。垂直分布幅度在海拔高差1000 m以上、500~1000 m、500 m以下的物种分别有5种、13种和5种。区内不同海拔带的兽类物种数随海拔升高的变化比较平稳,没有表现出明显上升或下降的规律性变化。
陕西马家山自然保护区大中型兽类的资源及区系与生态分布
DOI:10.3969/j.issn.1000-7083.2006.01.020
URL
[本文引用: 1]
马家山自然保护区(105°28′~105°40′E,32°50′~32°56′N)属秦岭西段的南坡山地。采用样线调查法和访问调查法,于2004年10~11月,对该保护区大中型兽类(包括灵长类、食肉动物和偶蹄动物)的资源、区系和生态分布进行了研究。该保护区共有23种大中型兽类,其中属我国Ⅰ级、Ⅱ级重点保护动物的兽类分别有5种和9种。它是秦岭物种多样性保护的关键地区之一。金丝猴和猕猴在此同域分布,大熊猫和羚牛四川亚种也分布于此地,该保护区是这4个珍稀濒危物种的一个新分布区。区内的23种兽类中没有古北界的区系成分,而属于东洋界成分的兽类有17种,占73.9%;其余6种为广布种,占26.1%。分析该区域23种兽类的生态分布发现,常绿落叶阔叶混交林、落叶阔叶林和针阔叶混交林中分别有16种、20种和12种动物活动。这些物种的垂直分布幅度有很大的差异。垂直分布幅度在海拔高差1000 m以上、500~1000 m、500 m以下的物种分别有5种、13种和5种。区内不同海拔带的兽类物种数随海拔升高的变化比较平稳,没有表现出明显上升或下降的规律性变化。
Effects of vegetation, elevation and human disturbance on the distribution of large- and medium-sized wildlife: A case study in Jiuzhaigou Nature Reserve
植被、海拔、人为干扰对大中型野生动物分布的影响——以九寨沟自然保护区为例
a) Elevational pattern of species richness and species range size of herpetofauna in Baishuijiang Nature Reserve: A test of Rapoport’s rule
物种丰富度和种域宽度沿海拔梯度分布格局及其形成机制一直是生物 地理学和生物多样性讨论的重要议题之一.海拔Rapoport法则认为,物种丰富度随海拔升高而逐渐变低,种域宽度逐渐变宽.本文基于白水江保护区两栖爬 行动物物种的海拔分布数据,分析了白水江保护区两栖爬行动物物种丰富度及其种域宽度的海拔梯度格局;采用常用的4种验证方法,验证了不同类群、不同区系物 种丰富度和不同阶元丰富度与其分布中点间的关系,并检验了Rapoport法则的适应性.结果表明:(1)白水江保护区两栖爬行动物物种丰富度随海拔升高 呈逐渐下降趋势,大体符合单调递减模式,水分可能是决定两栖动物物种分布格局的主要环境因子,而决定爬行动物物种分布的环境因子主要是温度,这可能由这两 种类群动物不同的生理需求所致.(2)两栖爬行动物物种(特别是狭域种)主要分布在低海拔,因此保护两栖爬行动物应该把重点放在低海拔段.(3) Stevens方法、Pagel法和逐中法验证结果支持海拔Rapoport法则,中点法由于受中域效应的影响,物种种域与海拔梯度呈先升后降的单峰分布 模型.因此,验证方法对Rapopon法则的验证结果具有重要的影响.Rapoport法则验证的研究方法亟待改进,物种丰富度和种域的海拔梯度格局及其 形成机理需要更多的案例比较研究,以形成普遍性的认识.
白水江自然保护区两栖爬行动物物种丰富度和种域海拔梯度格局及对Rapoport法则的验证
物种丰富度和种域宽度沿海拔梯度分布格局及其形成机制一直是生物 地理学和生物多样性讨论的重要议题之一.海拔Rapoport法则认为,物种丰富度随海拔升高而逐渐变低,种域宽度逐渐变宽.本文基于白水江保护区两栖爬 行动物物种的海拔分布数据,分析了白水江保护区两栖爬行动物物种丰富度及其种域宽度的海拔梯度格局;采用常用的4种验证方法,验证了不同类群、不同区系物 种丰富度和不同阶元丰富度与其分布中点间的关系,并检验了Rapoport法则的适应性.结果表明:(1)白水江保护区两栖爬行动物物种丰富度随海拔升高 呈逐渐下降趋势,大体符合单调递减模式,水分可能是决定两栖动物物种分布格局的主要环境因子,而决定爬行动物物种分布的环境因子主要是温度,这可能由这两 种类群动物不同的生理需求所致.(2)两栖爬行动物物种(特别是狭域种)主要分布在低海拔,因此保护两栖爬行动物应该把重点放在低海拔段.(3) Stevens方法、Pagel法和逐中法验证结果支持海拔Rapoport法则,中点法由于受中域效应的影响,物种种域与海拔梯度呈先升后降的单峰分布 模型.因此,验证方法对Rapopon法则的验证结果具有重要的影响.Rapoport法则验证的研究方法亟待改进,物种丰富度和种域的海拔梯度格局及其 形成机理需要更多的案例比较研究,以形成普遍性的认识.
b) Elevational pattern of amphibian and reptile diversity in Qinling range and explanation
DOI:10.3724/SP.J.1003.2014.14005
URL
[本文引用: 2]
物种多样性和种域宽度沿环境梯度的分布格局及其成因机制一直是生物地理学和生态学讨论的重要议题。本研究采用多元回归模型和方差分离的方法判断面积、水分和能量、边界限制对秦岭两栖、爬行动物及其不同区系成分的物种丰富度海拔梯度分布格局的影响。结果表明,秦岭两栖爬行动物及其不同区系成分的物种丰富度均呈单峰分布格局,但峰值分布的海拔段有所差异。形成这种格局是各种因素相互作用的结果,3种假设的独立解释力较低。水分能量动态假设对两栖、爬行动物物种的丰富度格局有很强的解释能力,但水分和能量的解释力中有很大一部分属于边界限制、面积的协同作用,在解释两栖动物的海拔分布格局时,边界限制与水分和能量之间存在较强的共线性,而在解释爬行动物的海拔分布格局时,面积与水分和能量之间存在较强的共线性。同时,本研究采用Stevens法和逐种法对Rapoport法则进行了验证。结果表明,爬行动物物种种域的海拔梯度格局基本上支持Rapoport法则,两栖动物很难判断是否支持Rapoport法则。
秦岭两栖、爬行动物物种多样性海拔分布格局及其解释
DOI:10.3724/SP.J.1003.2014.14005
URL
[本文引用: 2]
物种多样性和种域宽度沿环境梯度的分布格局及其成因机制一直是生物地理学和生态学讨论的重要议题。本研究采用多元回归模型和方差分离的方法判断面积、水分和能量、边界限制对秦岭两栖、爬行动物及其不同区系成分的物种丰富度海拔梯度分布格局的影响。结果表明,秦岭两栖爬行动物及其不同区系成分的物种丰富度均呈单峰分布格局,但峰值分布的海拔段有所差异。形成这种格局是各种因素相互作用的结果,3种假设的独立解释力较低。水分能量动态假设对两栖、爬行动物物种的丰富度格局有很强的解释能力,但水分和能量的解释力中有很大一部分属于边界限制、面积的协同作用,在解释两栖动物的海拔分布格局时,边界限制与水分和能量之间存在较强的共线性,而在解释爬行动物的海拔分布格局时,面积与水分和能量之间存在较强的共线性。同时,本研究采用Stevens法和逐种法对Rapoport法则进行了验证。结果表明,爬行动物物种种域的海拔梯度格局基本上支持Rapoport法则,两栖动物很难判断是否支持Rapoport法则。
Explanation of elevational patterns of amphibian and reptile species richness in the Baishuijiang Nature Reserve: Water-energy dynamic hypothesis and habitat heterogeneity hypothesis
白水江自然保护区两栖、爬行动物物种丰富度的海拔梯度格局的解释: 水分能量动态假设和生境异质性假设
