


自亚历山大·冯·洪堡(Alexander Von Humboldt) 1802年首次开创性、系统性地开展南美洲厄瓜多尔钦博拉索山的动植物分布研究以来(Von Humboldt & Bonpland, 2009; 张健和黄晓磊, 2019), 生物多样性的海拔格局、变化规律、成因一直是生态学和生物地理学的重要研究领域, 也是保护生物学中确定生物多样性热点和保护重点的重要依据(Körner, 2007; Quintero & Jetz, 2018; Peters et al, 2019)。与空间分布中的大尺度纬度梯度相比, 作为地理梯度的山地海拔梯度同样包含了温度、水分、面积等地理和环境因素的变化, 同时具有各种环境因素沿海拔梯度变化速率更快、所需地理范围更小、多个山系对比可重复性强等研究优势(Lomolino, 2001; McCain & Grytnes, 2010; Sanders & Rahbek, 2012; Graham et al, 2014)。
传统观点认为, 物种丰富度沿从低到高的海拔梯度呈递减格局(Stevens, 1992), 即物种丰富度的垂直分布是纬度分布规律的一个镜像。但Rahbek (1997)以及McCain和Grytnes (2010)总结之前的研究案例后发现物种丰富度的垂直分布格局大致可概括为以下4种主要模式: (1)单调递减格局; (2)中峰格局; (3)低海拔持续高峰格局; (4)低海拔持续高峰-中峰格局, 且随着生物类群、区域位置、气候条件和研究尺度的不同而呈不同的垂直分布格局。近年来多个研究分析验证了生物多样性海拔格局的形成机制, 尝试从多个环境因子筛选出最相关因子, 并提出一种广泛适用的理论假说。代表性的包括: 气候稳定性假说、能量假说、生境异质性和干扰假说、面积假说、中域效应假说、种间相互作用假说、进化时间和物种多样化速率假说、生态位保守性假说等(吴永杰和雷富民, 2013)。但由于研究类群和研究尺度的差异, 单一环境因子或者假说往往缺乏广泛解释力, 结论也不一致, 原因在于缺乏详尽的基础调查与物种分布数据(特别是各动物类群), 以及缺少复杂环境因子与人为干扰程度的影响、群落水平物种进化扩散历史、种间相互作用和生态功能适应能力的交互作用等背景资料(Zhang et al, 2020a, b; Shen et al, 2022)。
中国是典型的山地国家, 山地、丘陵和高原面积占全国土地总面积的69%, 多样的山地生态系统成为我国生物多样性的“摇篮”与“博物馆” (Xing & Ree, 2017; Lu et al, 2018; Ding et al, 2020)。南岭是华南地区最高山脉, 特殊的地理位置孕育了许多以南岭为起源中心和分化中心的特有动植物种类, 被评价为中国具有国际意义的14个陆地生物多样性关键地区之一(Tang et al, 2006; 周国逸等, 2018)。该区域森林原生植被覆盖率高, 保存着完整的山地森林生态系统和原生植被垂直带。从山脚到山顶, 植被类型依次为亚热带沟谷常绿阔叶林、山地常绿阔叶林(地带性植被)、常绿落叶阔叶混交林、常绿针阔叶混交林、山顶阔叶矮林和针阔混交山顶矮林。完整的山地森林垂直生态系统也为野生动物的栖息提供了良好的生境, 南岭不仅特有种、受胁种多(庞雄飞, 2003; 邹发生等, 2018), 而且是我国画眉科鸟类的三大分布中心之一(张强等, 2010)。以往由于技术手段的限制, 对于南岭山地森林生态系统中的大中型兽类、地栖性鸟类等活动隐秘、种群数量稀少的物种, 长期监测面临极大困难(张倩雯等, 2018)。近年来随着红外相机技术(camera trapping)的广泛推广与应用, 使得监测上述类群野生动物的空间分布、种群动态成为现实; 且通过红外监测数据, 还可生成兽类和鸟类的个体、种群至群落的多层次量化评估指标, 进一步评估兽类和鸟类的活动节律、繁殖生活史、栖息地选择等, 对生物多样性监测指标体系的构建和野生动物保护管理策略的制定具有重要参考价值(李晟等, 2014; 肖治术等, 2014; 朱淑怡等, 2017)。
本研究基于2012-2021年116个红外相机位点的连续监测数据, 建立了南岭南坡完整海拔垂直带谱(500-1,900 m)的红外相机监测网络。通过系统分层抽样与长期监测数据分析了南岭兽类和鸟类的海拔梯度格局, 研究结果不仅有助于完善物种多样性空间分布格局普遍模式、形成假说和演化机制等宏生态学理论知识, 对于支撑区域生态安全战略格局、建设南岭国家公园, 以及维护山地生物多样性与生态系统功能稳定性也具有现实意义。
1 材料与方法
1.1 研究地点
广东南岭国家级自然保护区(以下简称南岭保护区, 112°40′-113°07′ E, 24°39′-24°59′ N)地处南岭山脉中段南坡, 是珠江支流北江的发源地。保护区东邻乳源县, 南接阳山县岭背镇, 西靠连州市, 北部与湖南莽山国家级自然保护区接壤(图1)。保护区分乳阳、大顶山、秤架、大东山4个片区, 总面积58,368.4 ha, 是广东省陆地森林面积最大的自然保护区(庞雄飞, 2003)。地貌以中山山地为主, 山脉多为西北-东南走向, 海拔1,000 m以上的山峰有30多座, 广东第一峰石坑崆(1,902 m)坐落其间。该区属于亚热带季风气候区, 年平均气温17.4℃, 年均降水量2,108.4 mm。
图1
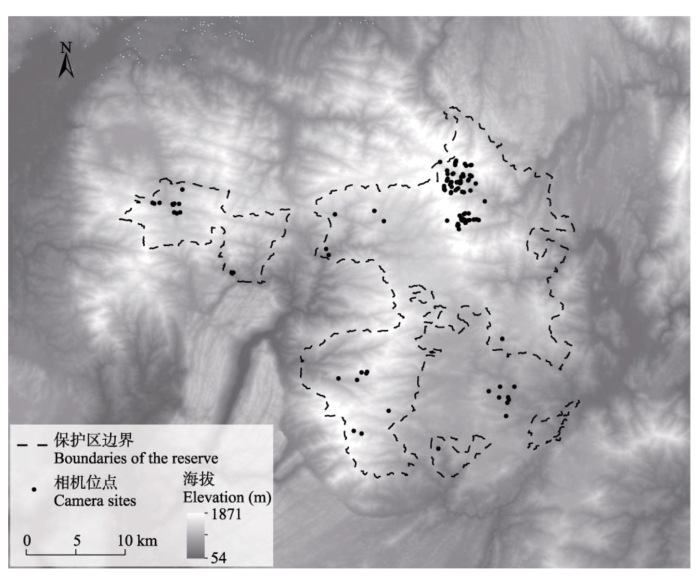
图1
广东南岭国家级自然保护区的红外相机布设位点
Fig. 1
Infrared camera deployment sites in Guangdong Nanling National Nature Reserve, China
该保护区位于我国亚热带常绿阔叶林的中心地带, 优越的地理条件和气候环境孕育了丰富的野生动物资源。截至2020年保护区共记录陆栖脊椎动物579种, 其中鸟类316种、兽类121种、两栖类44种、爬行类98种, 占广东省陆栖脊椎动物种数的62.4% (邹发生和叶冠锋, 2016; 邹发生等, 2018)。另据笔者个人统计, 保护区有国家一级重点保护野生动物10种, 国家二级重点保护野生动物92种; 中国物种红色名录受胁种(极危、濒危、易危等级) 74种; IUCN红色名录受胁种(极危、濒危、易危等级) 30种; 列入CITES附录的有75种。这反映出南岭不仅是中国华南地区动物物种丰富的区域, 也是具有世界意义的物种多样性区域。
1.2 红外相机布设
在南岭保护区完整垂直海拔带500-1,900 m的范围内, 划分为每隔100 m的分层抽样带, 共计14个抽样带; 每个抽样带分别布设3-16个红外相机拍摄位点, 共计116个, 其中500-1,000 m为南岭保护区的低海拔区域, 1,000-1,400 m为中海拔区域, 1,400-1,900 m为高海拔区域。红外相机布设位点选择在兽类和鸟类容易出没的位置(如兽径和倒木等), 尽量避开人类活动区域, 相邻位点间隔大于500 m。调查采用的相机型号主要为Ltl Acorn 5210, 布设时将相机捆绑在距地面高度约0.5 m的树干上, 相机镜头朝向避免阳光直射, 设置为拍照 + 录像模式(连拍3张 + 10 s视频), 时间间隔1 s, 灵敏度设为“中” (肖治术等, 2019; 余建平等, 2019)。相机连续调查时间为59-2,965 d。记录每个相机位点的GPS信息(经度、纬度和海拔)。
1.3 数据分析
用Bio-photo V2.1软件导出采集的红外相机数据和相机位置信息, 生成Excel表格进行下一步数据分析。人工鉴定影像中动物的种类、数量和类别, 备注所拍摄兽类和鸟类的特殊行为。兽类分类系统参考《中国兽类名录(2021版)》(魏辅文等, 2021), 鸟类分类系统参考《中国鸟类分类与分布名录(第三版)》(郑光美, 2017)。鸟兽的濒危等级参照IUCN红色名录(
对红外相机监测所获得兽类和鸟类数据, 使用相对多度指数(relative abundance index, RAI)评价不同物种的相对种群大小(陈立军等, 2019)。为确保拍摄照片的样本独立性, 从拍摄到此物种的第1张照片开始, 之后30 min内这个位点上连续拍摄到的相同物种(不管是否相同个体)的照片和视频都只算作1张独立有效照片, 某一物种的相对多度指数 = (该物种独立有效照片数/相机总工作日) × 1,000。
在α多样性水平, 首先采用物种累积曲线分析红外相机记录的物种数随红外相机布设数量以及布设年份增长的趋势。然后以海拔为自变量, 将各海拔区间记录到的物种丰富度(species richness, SR)以及Chao 1物种丰富度估计值作为因变量, 采用广义加性模型(generalized additive models, GAM)分析物种数量与海拔之间的关系(Peters et al, 2016)。
在β多样性水平, 动物群落沿海拔梯度的变化能够反映环境对群落的塑造。我们合并了所有年份各个物种在各个海拔的有效照片数, 然后用各海拔段各物种的RAI代表相对种群大小, 用Bray-Curtis相异性指数计算全部年份全部海拔段动物群落的总体β多样性(βmBC), 并将其分解成多度平衡变化(βmbal)和多度梯度(βmgra) (Baselga, 2013, 2017)。多度平衡变化和多度梯度分别反映了不同海拔之间物种数量的此消彼长以及数量的共同变化趋势。同时计算每两个海拔段之间的Bray-Curtis指数(βpBC)、它们的分解(βpbal和βpgra)以及βpgra对βpBC的比值(Rgra/BC)——用于衡量两种加性成分对总β多样性的贡献。比值为1时表示群落差异完全是由各物种多度在各海拔段之间的共同增减趋势造成的。Bray-Curtis相异性指数及其分解的取值为[0,1], 接近1时表示群落间差异极大。我们用Jaccard相异性指数和物种二元分布数据重复了上述计算(Baselga, 2012), 得到总体β多样性(βmJac)及其分解——物种替换(βmtu)和物种嵌套(βmne), 以及每两个海拔段之间的Jaccard指数(βpJac)、分解(βptu和βpne)和βpne对βpJac的比值(Rne/Jac)。此外还采用Jaccard指数计算了各年份的全部海拔段总体β多样性(βmy)以及相同海拔段不同年份之间的总体变化(βby)。
我们使用最大熵(maximum entropy, MaxEnt)模型预测了兽类和鸟类在保护区及周边区域的分布(Phillips & Dudík, 2008)。动物分布记录为记录到该物种的红外相机位点。我们首先将2013-2019年中国每月气温和降水的栅格数据(数据分辨率为30) (Gong et al, 2022)相同月份的数据平均后, 根据Fick和Hijmans (2017)的公式计算了19种生物气候数据(bioclimatic variables)。计算时, 6、7和8月为每年的最热和最湿季度, 12、1、2月为每年的最冷和最干季度。此外我们下载了海拔(elevation, ELE) (Fick & Hijmans, 2017)、2010年林冠覆盖率(percent tree canopy cover, TCC) (Hansen et al, 2013)、2019年森林高度(forest height, FHT) (Potapov et al, 2021)以及土地利用类型(land use type, LUT) (Li et al, 2022)和人类活动足迹(human footprint, FP) (Mu et al, 2022)的数据图层, 与生物气候数据一起作为MaxEnt的环境图层。ELE、TCC、FHT、LUT和FP重采样至与生物气候数据的边界、坐标系和分辨率一致。我们计算了环境图层之间的相关性, 并排除了相关性大于0.8的变量(Beaumont et al, 2005; Heikkinen et al, 2006; Gastón & García-Viñas, 2011), 最终保留年均温(annual mean temperature, AMT)、年降水量(annual precipitation, AP)、等温性(isothermality, IST)、最干月降水量(precipitation of driest month, PDM)、最冷季降水量(precipitation of coldest quarter, PCQ)、降水季节性(precipitation seasonality, PS)、TCC、FHT、LUT和FP共计10种环境变量。其次, 将动物分布记录导入MaxEnt 3.4.1软件中, 每个物种选取75%的分布点数据用于模型训练, 剩余25%的点用于模型验证, 验证方法为自举法(bootstrap)。选择受试者工作特征曲线(receiver operating characteristic curve, ROC)与横坐标围成的面积, 即AUC (area under the curve)值来评价模型预测结果的精准度, 模型每次随机生成1,000个点作为理论假设分布点, 最终模型为30次重复的平均模型。模型输出栖息地适宜度指数为连续的0-1之间的栅格, 并选取最大训练灵敏度与特异度之和为分布阈值, 将大于分布阈值的地点和物种转化为二元分布(0/1模型)。最后, 我们将每个物种的二元分布区叠加, 最终得到保护区及周边区域在30″ × 30″ (约1 km × 1 km)空间尺度上的物种丰富度地理分布格局(王波等, 2018; 陈道剑, 2019( 陈道剑 (2019) 广东省森林鸟类的样线有效宽度与分布格局. 硕士学位论文, 广西师范大学, 广西桂林. ))。
本研究物种累积曲线分析、广义加性模型分析、β多样性指数计算利用R 4.2.2软件的vegan、betapart等程序包完成。物种分布区模拟在MaxEnt 3.4.1软件中完成。12种主要在树冠层及树冠层以上活动的鸟类不用作α和β多样性以及物种分布区模拟的相关分析和计算。
2 结果
2.1 物种组成与相对多度
2012年12月至2021年2月间安放在116个位点的红外相机累计拍摄85,164个工作日, 获得可识别独立有效照片21,194张, 其中兽类14,556张, 鸟类6,638张。各海拔段调查相机布设与工作概况详见附录1。共记录到兽类24种, 隶属于4目13科; 记录到鸟类50种, 隶属于9目17科。其中国家一级重点保护野生动物1种, 即黄腹角雉(Tragopan caboti); 国家二级重点保护野生动物22种, 详见附录2。被IUCN列为易危(VU)级别的有5种, 包括亚洲黑熊(Ursus thibetanus)、猪獾(Arctonyx collaris)、水鹿(Rusa unicolor)、中华鬣羚(Capricornis milneedwardsii)和黄腹角雉。其中黄腹角雉被《中国脊椎动物红色名录》列为濒危(EN), 另有10种被列为易危(VU), 包括藏酋猴(Macaca thibetana)、亚洲黑熊、斑林狸(Prionodon pardicolor)、红颊獴(Herpestes javanicus)、豹猫(Prionailurus bengalensis)、毛冠鹿(Elaphodus cephalophus)、小麂(Muntiacus reevesi)、中华鬣羚、红背鼯鼠(Petaurista petaurista)和白眉山鹧鸪(Arborophila gingica)。上述数据显示, 南岭保护区的大中型兽类受威胁物种比例较高, 有11种至少在1个名录中的级别在易危以上, 占调查到兽类总数的45.83%。
RAI最高的5种兽类是赤麂(Muntiacus vaginalis, 78.78)、小麂(32.14)、红腿长吻松鼠(Dremomys pyrrhomerus, 18.39)、鼬獾(Melogale moschata, 10.27)和藏酋猴(8.01), 而红颊獴和水鹿RAI最低, 在南岭仅各拍摄到1次(附录2)。RAI最高的4种鸟类是白鹇(Lophura nycthemera, 28.92)、紫啸鸫(Myophonus caeruleus, 17.77)、黄腹角雉(8.50)和白眉山鹧鸪(7.47), 有42种鸟类的RAI指数小于1, 主要是雀形目、鴷形目和鸮形目。物种累积曲线显示, 兽类物种数随相机工作日布设抽样量快速上升, 并逐渐趋于平缓; 而鸟类物种数在长达10年的拍摄中一直处于上升趋势, 原因在于拍摄的偶见种较多。可见, 现阶段南岭南坡兽类物种数明显较少, 且红外相机拍摄的取样充分; 而鸟类物种数明显高, 红外相机拍摄取样仍需加强(附录3)。
2.2 鸟兽多样性及其垂直分布特征
广义加性模型分析结果显示, 所有记录物种、兽类和鸟类的物种丰富度及其Chao 1估计值在海拔上的分布格局均为中峰型, 中海拔区域(1,000-1,400 m)呈现出明显高的物种多样性。海拔对全部物种和兽类丰富度的解释力较强, 以Chao 1为例, 解释力(deviance explained)分别为70.5% (P = 0.001)和81.7% (P = 0.009), 鸟类虽然也随海拔呈中峰分布, 但解释力只有61.3% (P = 0.1) (图2)。
图2
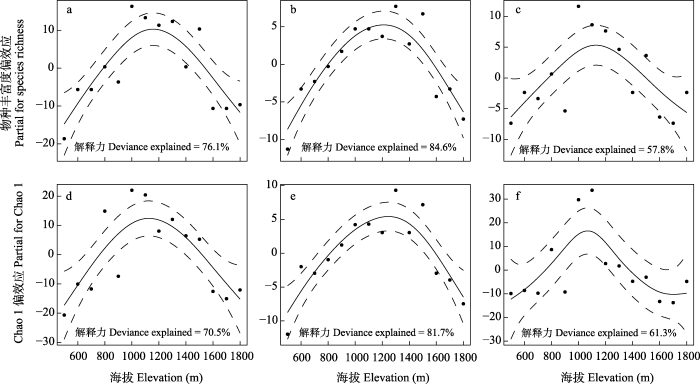
图2
广义加性模型拟合的物种丰富度和Chao 1物种丰富度估计值与海拔梯度的关系, 包括全部物种(a, d)、兽类(b, e)和鸟类(c, f)
Fig. 2
The simulated relationship between species richness and Chao 1 estimator by generalized additive models, including all species (a, d), mammals (b, e) and birds (c, f)
在β多样性水平, 兽类和鸟类所有物种的群落βmBC、βmbal和βmgra分别为0.81、0.66和0.15, βmJac、βmtu和βmne分别为0.84、0.63和0.21, 群落总体差异较大且主要源于多度平衡变化和物种替换(表1)。兽类和鸟类所有物种的群落Jaccard指数也反映出替换组分对物种构成差异的影响(附录4)。βpBC的平均值为0.52 ± 0.20, Rgra/BC的平均值为0.34 ± 0.23; βpJac的平均值为0.52 ± 0.13, Rne/Jac为0.49 ± 0.31 (表2), 结合海拔段之间的Rgra/BC和Rne/Jac格局(图3, 附录5, 附录6), 表明海拔段之间的群落差异源于多度平衡变化、物种替换以及物种嵌套。Rgra/BC的格局显示, 在中海拔段(1,000-1,400 m)内部, 各海拔段之间的多度梯度对群落差异也有相当的贡献。Rne/Jac的格局表明, 单纯的丰富度变化——即物种嵌套对中海拔段与低海拔段(800-1,000 m)和高海拔段(1,400-1,900 m)之间的物种差异贡献很大, 而各个海拔段内部则由物种替换主导物种差异。另外, 两种相异性指数格局都显示, 低海拔段和高海拔段的动物群落或其他各海拔段的群落相比都有较大的不同。鸟类群落的总体和成对β多样性格局与全部物种的β多样性格局相似, 多度平衡变化和物种替换也是鸟类群落差异的主要组分。但兽类的β多样性格局有自身特点, 兽类群落的总体Bray-Curtis指数和总体Jaccard指数都显示多度梯度和物种嵌套组分有较大比例的贡献(表1), 兽类的Rne/Jac的平均值则达到0.75 ± 0.32, 高于总体动物群落的0.49 ± 0.31和鸟类群落的0.43 ± 0.30 (表2)。另外, 全部动物群落、兽类和鸟类相同海拔段不同年份之间的物种构成也有较大变化(附录5), 物种替换同样是构成群落变化的主要组分。
表1 全海拔段总体Bray-Curtis相异性指数及其组分、总体Jaccard相异性指数及其组分。βmBC: Bray-Curtis相异性指数; βmbal: 多度平衡变化; βmgra: 多度梯度; βmJac: Jaccard相异性指数; βmtu: 物种替换; βmne: 物种嵌套。
Table 1
| 指数 Indices | 全部物种 All species | 兽类 Mammals | 鸟类 Birds |
|---|---|---|---|
| βmBC | 0.81 | 0.80 | 0.83 |
| βmbal | 0.66 | 0.53 | 0.71 |
| βmgra | 0.15 | 0.27 | 0.12 |
| βmJac | 0.84 | 0.81 | 0.86 |
| βmtu | 0.63 | 0.38 | 0.70 |
| βmne | 0.21 | 0.43 | 0.15 |
表2 成对海拔段之间Bray-Curtis相异性指数及其组分、Jaccard相异性指数及其组分的平均值和标准偏差。βpBC: Bray-Curtis相异性指数; βpbal: 多度平衡变化; βpgra: 多度梯度; Rgra/BC: βpgra对βpBC的比值; βpJac: Jaccard相异性指数; βptu: 物种替换; βpne: 物种嵌套; Rne/Jac: βpne对βpJac的比值。
Table 2
| 指数 Indices | 全部物种 All species | 兽类 Mammals | 鸟类 Birds |
|---|---|---|---|
| βpBC | 0.52 ± 0.20 | 0.54 ± 0.25 | 0.52 ± 0.16 |
| βpbal | 0.35 ± 0.20 | 0.25 ± 0.19 | 0.35 ± 0.21 |
| βpgra | 0.17 ± 0.11 | 0.29 ± 0.22 | 0.16 ± 0.13 |
| Rgra/BC | 0.34 ± 0.23 | 0.50 ± 0.29 | 0.34 ± 0.27 |
| βpJac | 0.52 ± 0.13 | 0.45 ± 0.22 | 0.56 ± 0.11 |
| βptu | 0.25 ± 0.16 | 0.10 ± 0.14 | 0.32 ± 0.19 |
| βpne | 0.27 ± 0.20 | 0.36 ± 0.26 | 0.24 ± 0.19 |
| Rne/Jac | 0.49 ± 0.31 | 0.75 ± 0.32 | 0.43 ± 0.30 |
图3
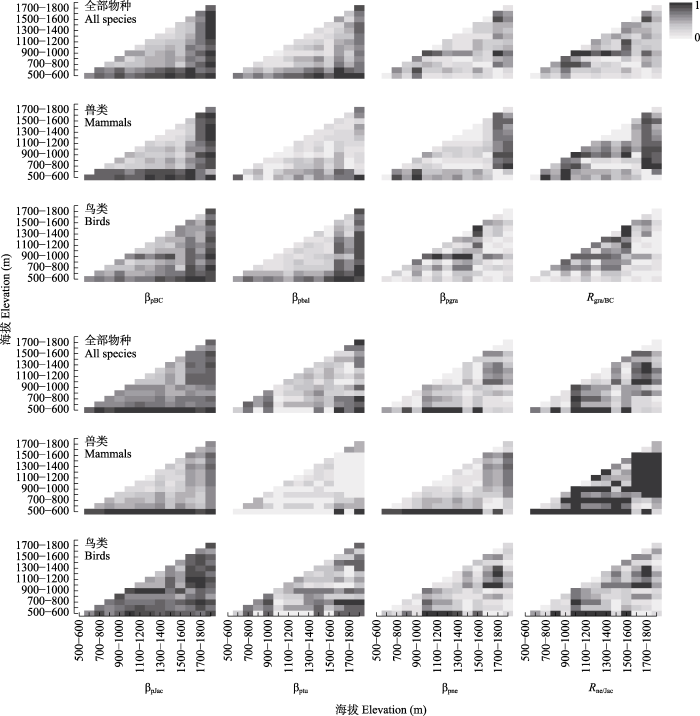
图3
成对海拔段之间Bray-Curtis相异性指数及其组分、Jaccard相异性指数及其组分的热力图。βpBC: Bray-Curtis相异性指数; βpbal: 多度平衡变化; βpgra: 多度梯度; Rgra/BC: βpgra对βpBC的比值。βpJac: Jaccard相异性指数; βptu: 物种替换; βpne: 物种嵌套; Rne/Jac: βpne对βpJac的比值。
Fig. 3
The heat maps of the Bray-Curtis dissimilarity and its components and Jaccard dissimilarity and its components between pairs of elevation ranges. βpBC, Bray-Curtis dissimilarity; βpbal, Balanced changes in species abundances; βpgra, Abundance gradients; Rgra/BC, Ratio of βpgra and βpBC; βpJac, Jaccard dissimilarity; βptu, Species turnover; βpne, Species nestedness; Rne/Jac, Ratio of βpne and βpJac.
2.3 基于生态位模型的物种水平分布预测
MaxEnt模型最终预测了18种兽类和27种鸟类在南岭保护区及其周边的水平分布。45个模型的AUC值为0.568 (赤麂)-0.999 (灰背燕尾Enicurus schistaceus), 分别有30、7、4和4个模型将AMT、AP、TCC和FP作为对模型贡献最大的环境因素。AMT、TCC和FP值越低、AP值越高的栅格, 模型预测的物种分布概率越高。将二元转化后的物种分布叠加后, 多样性热点集中在南岭保护区的东北部片区, 西北和南部的片区也可以看到比较弱的热点地带, 同时在南岭保护区范围外的东边也存在1个多样性热点区域(图4)。兽类和鸟类的多样性热点格局与总的多样性格局相似(附录7)。
图4
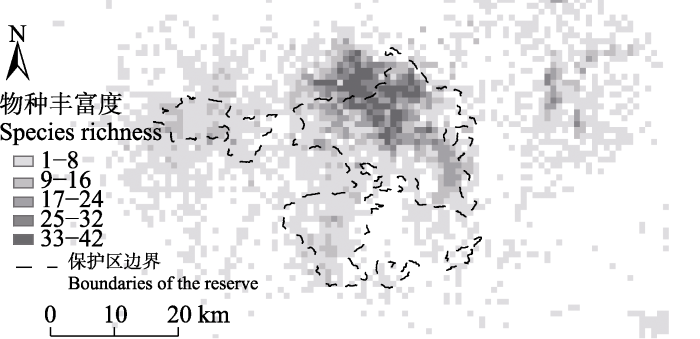
图4
基于MaxEnt模型预测的广东南岭国家级自然保护区鸟兽多样性分布格局
Fig. 4
Diversity distribution pattern of birds and mammals predicted by MaxEnt models in Guangdong Nanling National Nature Reserve
3 讨论
3.1 南岭地区兽类多样性面临较大威胁
本研究连续10年的红外相机抽样调查数据基本可以有效反映南岭保护区鸟兽物种多样性变化及其当下的海拔格局和保护热点与空缺。20世纪50年代以来, 受森林砍伐、非法盗猎等人为干扰影响, 保护区内大中型兽类、地栖鸟类等珍稀野生动物的种群数量急剧下降, 甚至出现局域灭绝的现象(庞雄飞, 2003)。据1992-1996年华南濒危动物研究所野外调查统计(陈万成等, 1993; 蔡玉生等, 2016), 区内分布有兽类85种, 而本次调查只拍摄到兽类24种(附录2, 附录8)。如重点考虑最有代表性的类群食肉目和偶蹄目, 发现15种食肉目兽类——包括赤狐(Vulpes vulpes)、貉(Nyctereutes procyonoides)、豺(Cuon alpinus)、狼(Canis lupus)、黄喉貂(Martes flavigula)、狗獾(Meles leucurus)、欧亚水獭(Lutra lutra)、小爪水獭(Aonyx cinerea)、大灵猫(Viverra zibetha)、小灵猫(V. indica)、金猫(Catopuma temminckii)、云豹(Neofelis nebulosa)、豹(Panthera pardus)、华南虎(P. tigris amoyensis), 以及5种偶蹄目——包括黑麂(Muntiacus crinifrons)、梅花鹿(Cervus nippon)、獐(Hydropotes inermis)、林麝(Moschus berezovskii)、中华斑羚(Naemorhedus griseus)——均未有记录, 暗示这些物种在该区域可能已经消失。同时刺猬(Erinaceus amurensis)、中华穿山甲(Manis pentadactyla)、亚洲黑熊、水鹿等物种的种群数量也非常稀少, 应特别注意加强保护。
与此同时, 近20年来保护区也发现了大量兽类新记录种, 如啮齿目的红腿长吻松鼠、倭花鼠(Tamiops maritimus)、北社鼠(Niviventer confucianus)、小泡巨鼠(Leopoldamys edwardsi)和猪尾鼠(Typhlomys cinereus); 劳亚食虫目的鼩猬(Neotetracus sinensis)和短尾鼩(Anourosorex squamipes); 翼手目的清迈菊头蝠(Rhinolophus siamensis)、大耳菊头蝠(R. macrotis)、大黑伏翼(Arielulus circumdatus)、大棕蝠(Eptesicus serotinus)、南蝠(Ia io)、长指鼠耳蝠(Myotis longipes)和山地鼠耳蝠(M. montivagus)等(邹发生等, 2018)。由于兽类不同类群的生活习性差别, 再加上抽样调查不系统不充分和调查技术手段有限等制约, 使得啮齿目和翼手目两大类群仍存在待发现的新记录种, 因此有必要针对这两大类群进行专项调查。
3.2 兽类和鸟类群落垂直多样性格局差异与形成机制
Myers等(2000)基于物种多样性的水平分布格局提出了全球25个生物多样性热点地区, 这些热点地区多数位于山区。环境复杂多样的山地生态系统孕育了很高的生物多样性, 物种多样性垂直分布格局的调查研究对于这些热点地区的物种保护和生态管理至关重要。南岭山地从河谷到山顶依次分布有人工植被、河滩灌丛、沟谷常绿阔叶林、山地常绿阔叶林、常绿落叶阔叶混交林、常绿针阔叶混交林以及山顶阔叶矮林和山顶灌丛, 构成了完整的气候和生物垂直带谱。本研究结果表明南岭山地大中型兽类和地栖性鸟类的物种丰富度在海拔上呈现典型的中峰格局, 这一结果与国内外很多地区的研究结果一致。如Rahbek (1997)对南美洲热带陆地鸟类垂直分布格局的研究发现, 排除面积影响之后, 物种丰富度分布呈中峰格局并体现出中域效应。Lee等(2004)对中国台湾地区繁殖鸟类的研究也表明物种丰富度垂直分布呈中峰格局, 在海拔2,000 m达到峰值。McCain (2009)分析了全球关于鸟类物种丰富度垂直分布格局的78项研究, 发现中峰格局的比例为26%。李义明等(2003)对神农架398-3,105 m海拔范围的研究发现, 中段海拔(800-1,700 m)的哺乳动物多样性最丰富。马俊等(2010)对螺髻山1,040-4,359 m范围的研究也发现哺乳动物多样性在中段海拔(2,600 m)最高。吴永杰等(2012)对贡嘎山东坡1,000-4,000 m海拔范围的小型兽类进行了调查, 统计后发现中段海拔(2,000-2,800 m)的物种多样性最丰富。此次在南岭山地海拔500-1,900 m的研究区域内, 鸟兽多样性的中峰格局集中在900-1,400 m的中海拔段, 该海拔段正好是南岭地带性植被——亚热带山地常绿阔叶林集中分布的片区, 并且在历史上受人类干扰较小。
南岭南坡鸟兽群落组成沿海拔梯度的差异较大。大部分物种, 特别是个体数量较多的物种主要分布在中海拔段, 如藏酋猴、鼬獾、食蟹獴(Herpestes urva)、野猪(Sus scrofa)、赤麂、小麂、水鹿、赤腹松鼠(Callosciurus erythraeus)、红腿长吻松鼠、白眉山鹧鸪、白鹇、黄腹角雉、紫啸鸫等。高、低海拔的物种数相对较少, 比如像猪獾、红颊獴、豪猪(Hystrix brachyura)等兽类主要分布于高海拔, 中低海拔无分布; 像白颊噪鹛(Pterorhinus sannio)、绿翅金鸠(Chalcophaps indica)、白眉鹀(Emberiza tristrami)等一些喜好人工林或林缘的物种则主要分布在低海拔区域, 因此南岭南坡高、低海拔段与中海拔段动物个体数量的此消彼长以及物种替换主导了海拔上群落间的差异。鸟类和兽类群落多样性格局的形成机制有区别, 高海拔和低海拔之间鸟类群落的差异主要来自物种替换, 说明中海拔段的高多样性可能来自于“中域效应”, 即有着不同海拔分布范围的物种在区域中间, 也就是中海拔段物种重叠分布的概率最大, 而在区域边界上, 即高低海拔段物种重叠的概率最小(Colwell & Lees, 2000)。兽类群落的物种和多度在中海拔段最高, 但各海拔段间的群落差异不大, 差异主要来自多度梯度和物种嵌套, 说明各海拔段物种构成相似、优势物种相似, 推测中海拔兽类物种和个体向高低海拔扩散形成了当前南岭的兽类群落格局, 高海拔乔木林向灌丛的渐变以及低海拔人类干扰的加剧, 可能是造成这一格局的环境胁迫因素。因此, 虽然兽类群落与鸟类群落的β多样性分布格局相似, 但背后的生态学过程差异还需要进一步验证。
3.3 南岭保护区及其周边区域鸟兽多样性保护热点分布
整合水平与垂直分布的多样性空间格局热点分析表明, 当下南岭保护区范围内的兽类和鸟类主要集中分布在3个热点地区, 且全部分布于中高海拔, 包括: (1)广东乳阳五指山与湖南莽山交界的东北片区(如石韭坑-石坑崆-五指山-八宝山一线); (2)南北走向的广东大顶山、龙潭角和秤架片区(如亚婆庙-怡坑河-十山坑一线); (3)广东大东山片区的茅坪-龙孔坑-平安岭一线。特别是广东乳阳五指山片区到湖南莽山片区一带是动物的分布热点, 尽管相机位点都集中在南岭保护区内, 但湖南莽山国家级自然保护区同样被本研究物种分布模型识别为高多样性区域。同时, 拍到亚洲黑熊活动的相机也集中在这一带, 说明该区域森林生态系统较完整, 脊椎动物多样性高, 食物链复杂。我们还发现广东省乐昌市西南方向的水井岭一带也被模型判别为鸟兽多样性较高的区域, 然而该区域的本底资料少, 缺乏保护区和保护地, 同时又被京港澳高速和乐广高速分割, 是潜在的保护空缺和动物生境斑块, 今后应联合多部门加强沟通, 整合资源, 扩大南岭山地保护地范围。总之, 在保证南岭南麓生物垂直带谱完整性的基础上, 中高海拔区域对于兽类和鸟类物种多样性有着明显较高的保护价值。
综合看来, 南岭保护区在动植物调查方面有较好的工作基础, 但缺少系统设计的长期监测网络与数据支撑, 缺乏有代表性的科学理论创新成果。针对野生动物保护管理, 保护区管理局也面临着面积过大、片区分散、巡护及科研监测人员急缺、生态保护与社区发展矛盾突出等难点。特别是保护区及周边的大中型兽类仍面临极为严峻的生存压力, 在南岭国家公园建设的大背景下, 笔者建议: (1)以物种、甚至以个体为单位制定保护管理对策, 加强珍稀濒危兽类和鸟类的种群及栖息地的研究与保护; (2)充分重视中高海拔地段的生境管理, 维持保护区内完整的气候与生物垂直带谱, 以及加强景观尺度异质性斑块之间的连通性, 是今后南岭山地野生动物保护的关键; (3)本研究仅涉及南岭兽类、鸟类物种编目与多样性海拔格局的探索, 对于格局机制的深入阐明, 需要持续关注环境因子(气温、降水、生境异质性、人为干扰)、功能特征(如扩散、适应度、繁殖策略、觅食行为)、种间作用关系(竞争、捕食、合作)、物种进化历史、其他生物类群等的影响, 并以此建立一个规范化、智能化和网格化的多类群生物多样性监测网络与保护管理体系。
附录 Supplementary Material
附录1 广东南岭国家级自然保护区各海拔段红外相机数量、工作时长和鸟兽拍摄情况
Appendix 1 Number of cameras, working days and photography of birds and mammals in each elevation section of the Guangdong Nanling National Nature Reserve
附录2 广东南岭国家级自然保护区红外相机监测所拍摄的兽类和鸟类名录
Appendix 2 List of mammal and bird species recorded by infrared cameras in Guangdong Nanling National Nature Reserve
附录3 全部物种、兽类和鸟类随红外相机位点布设数量以及工作年份的物种累积稀疏曲线
Appendix 3 Estimated species rarefaction curves with increased camera sites or years, including all species, mammals and birds
附录4 各年份动物群落总体Jaccard相异性指数及其分解组分
Appendix 4 The Jaccard dissimilarity index and partition components of total animal communities in different years
附录5 各海拔段动物群落总体Jaccard相异性指数及其分解组分
Appendix 5 The Jaccard dissimilarity index and partition components of total animal communities in different elevational site
附录6 成对海拔段之间Bray-Curtis相异性指数及其组分、Jaccard相异性指数及其组分的提琴图
Appendix 6 The violin plots of the Bray-Curtis dissimilarity and its components and Jaccard dissimilarity and its components between pairs of elevation ranges
附录7 基于MaxEnt模型预测的广东南岭国家级自然保护区兽类、鸟类丰富度分布格局
Appendix 7 Species richness patterns of mammals and birds predicted by MaxEnt model in Guangdong Nanling National Nature Reserve
附录8 广东南岭国家级自然保护区红外相机拍摄的主要兽类和鸟类照片
Appendix 8 Photographs of mammals and birds recorded by infrared cameras in Guangdong Nanling National Nature Reserve
参考文献
The relationship between species replacement, dissimilarity derived from nestedness, and nestedness
DOI:10.1111/j.1466-8238.2011.00756.x URL [本文引用: 1]
Separating the two components of abundance-based dissimilarity: Balanced changes in abundance vs. abundance gradients
DOI:10.1111/2041-210X.12029 URL [本文引用: 1]
Partitioning abundance-based multiple-site dissimilarity into components: Balanced variation in abundance and abundance gradients
DOI:10.1111/mee3.2017.8.issue-7 URL [本文引用: 1]
Predicting species distributions: Use of climatic parameters in BIOCLIM and its impact on predictions of species’ current and future distributions
DOI:10.1016/j.ecolmodel.2005.01.030 URL [本文引用: 1]
Camera trap survey of mammal diversity in Nanling forests
南岭森林哺乳动物多样性的红外相机监测
Limitations of relative abundance indices calculated from camera-trapping data
DOI:10.17520/biods.2018327
[本文引用: 1]

Abundance is an important parameter used to estimate the population size of various wildlife species. With the growing application of camera-traps (movement or heat activated) to monitoring wildlife, the relative abundance index (RAI) has become one of the most popular indicators of population abundance for inventories and assessment. Despite a simple and convenient indicator of population size, RAI obtained from camera-trapping data can be greatly affected by many factors such as species traits, detection rates and environmental factors. Therefore, we need verify the correlation between RAI and population density prior to its general application. So far, several types of RAIs have been developed based on camera-trapping data, and it is critical to compare these RAI indices and their applications. In this paper, we summarized the methods calculating RAI with camera-trapping data and reviewed their applications in wildlife monitoring and inventories in China. Four main types of RAIs were identified including (1) the number of days when one animal is photographed, (2) the number of photographs of focal species per 100 trap days, (3) the number of photographs of focal species per trap day, and (4) the proportion of photos from the focal species compared to all photos of all animals. Among them, the second RAI type is the most widely used (72.5%) in wildlife monitoring and inventories in China, and the fourth RAI type is used to compare species components in communities. Consequently, we recommend the second RAI type for estimating population abundance in particular when camera-trapping data are used for broad-scale comparisons over different spatial and temporal scales.
物种相对多度指数在红外相机数据分析中的应用及局限
DOI:10.17520/biods.2018327
[本文引用: 1]
多度是衡量物种种群数量的参数之一, 多度的动态及其影响因素是种群生态学研究的经典问题。物种相对多度指数(relative abundance index, RAI)作为一种简单、便利的指标, 广泛应用于动物本底清查中。但RAI易受物种自身特征、探测率和环境因素的影响, 需要结合其他物种数量分析方法, 以验证其与种群大小的相关性。随着红外相机技术在野生动物调查中的广泛应用, 用红外相机数据估计动物种群数量的研究越来越多。目前, 基于红外相机数据计算RAI的方法有多种, 不同计算方法和应用范围存在差异, 亟需对现有方法和应用进行梳理。本文综述了根据红外相机数据计算物种相对多度的4种主要方法: (1)拍摄一张有效照片所需要的天数; (2)基于单位调查强度的物种拍摄率; (3)每个位点每天的物种拍摄率; (4)某一物种的照片数占所有物种的比例。总结了我国野生动物监测调查中采用红外相机方法计算RAI的应用现状。国内的研究主要采用第2种和第4种计算方法, 其中约72.5%的研究论文应用第2种计算方法, 而第4种方法一般适用于群落中的物种组成比较。我们建议根据红外相机数据计算RAI时尽量使用第2种计算方法, 这有助于研究或管理人员对不同研究中的物种RAI进行比较分析。
A research of land vertebrata in Ruyang Babaoshan Nature Reserve of Ruyuan County, Guangdong Province
乳阳八宝山自然保护区一带的陆栖脊椎动物调查初报
The mid-domain effect: Geometric constraints on the geography of species richness
DOI:10.1016/S0169-5347(99)01767-X URL [本文引用: 1]
Ancient orogenic and monsoon-driven assembly of the world’s richest temperate alpine flora
DOI:10.1126/science.abb4484
URL
[本文引用: 1]
\n The evolution of high mountain floras is strongly influenced by tectonic and climatic history. Ding\n et al.\n document the timing, tempo, and mode by which the world's most species-rich alpine flora, that of the Tibet-Himalaya-Hengduan region, was assembled. Alpine assemblages in the region are older than previously thought, with lineages tracing their alpine ancestry to the early Oligocene—older than any other modern alpine system. Alpine species diversified faster during periods of orogeny and intensification of the Asian monsoon, and the Hengduan Mountains—the most species-rich area in this region—played a key biogeographic role as the location of the earliest pulse of alpine diversification in the Oligocene.\n
WorldClim 2: New 1-km spatial resolution climate surfaces for global land areas
DOI:10.1002/joc.2017.37.issue-12 URL [本文引用: 2]
Modelling species distributions with penalised logistic regressions: A comparison with maximum entropy models
DOI:10.1016/j.ecolmodel.2011.04.015 URL [本文引用: 1]
1 km Monthly Precipitation and Temperatures Dataset for China from 1952 to 2019 based on a Brand-New and High-Quality Baseline Climatology Surface
The origin and maintenance of montane diversity: Integrating evolutionary and ecological processes
DOI:10.1111/ecog.2014.v37.i8 URL [本文引用: 1]
High-resolution global maps of 21st-century forest cover change
DOI:10.1126/science.1244693
PMID:24233722
[本文引用: 1]
Quantification of global forest change has been lacking despite the recognized importance of forest ecosystem services. In this study, Earth observation satellite data were used to map global forest loss (2.3 million square kilometers) and gain (0.8 million square kilometers) from 2000 to 2012 at a spatial resolution of 30 meters. The tropics were the only climate domain to exhibit a trend, with forest loss increasing by 2101 square kilometers per year. Brazil's well-documented reduction in deforestation was offset by increasing forest loss in Indonesia, Malaysia, Paraguay, Bolivia, Zambia, Angola, and elsewhere. Intensive forestry practiced within subtropical forests resulted in the highest rates of forest change globally. Boreal forest loss due largely to fire and forestry was second to that in the tropics in absolute and proportional terms. These results depict a globally consistent and locally relevant record of forest change.
Methods and uncertainties in bioclimatic envelope modelling under climate change
DOI:10.1177/0309133306071957
URL
[本文引用: 1]
Potential impacts of projected climate change on biodiversity are often assessed using single-species bioclimatic ‘envelope’models. Such models are a special case of species distribution models in which the current geographical distribution of species is related to climatic variables so to enable projections of distributions under future climate change scenarios. This work reviews a number of critical methodological issues that may lead to uncertainty in predictions from bioclimatic modelling. Particular attention is paid to recent developments of bioclimatic modelling that address some of these issues as well as to the topics where more progress needs to be made. Developing and applying bioclimatic models in a informative way requires good understanding of a wide range of methodologies, including the choice of modelling technique, model validation, collinearity, autocorrelation, biased sampling of explanatory variables, scaling and impacts of non-climatic factors. A key challenge for future research is integrating factors such as land cover, direct CO2 effects, biotic interactions and dispersal mechanisms into species-climate models. We conclude that, although bioclimatic envelope models have a number of important advantages, they need to be applied only when users of models have a thorough understanding of their limitations and uncertainties.
Red List of China’s Vertebrates
中国脊椎动物红色名录
The use of ‘altitude’ in ecological research
DOI:10.1016/j.tree.2007.09.006 URL [本文引用: 1]
Breeding bird species richness in Taiwan: Distribution on gradients of elevation, primary productivity and urbanization
DOI:10.1046/j.0305-0270.2003.00988.x URL [本文引用: 1]
30 m resolution (GLC- 2015) based on a multi-source product fusion approach
Camera-trapping in wildlife research and conservation in China: Review and outlook
DOI:10.3724/SP.J.1003.2014.14203
[本文引用: 1]
During the last two decades, infrared-triggered camera-trapping has been widely used in wildlife and biodiversity research and conservation. In the areas of wildlife ecology research, animal species inventory, biodiversity monitoring and protected area management in China, considerable outputs have been produced by scientific research and conservation applications based on camera-trapping. This technique has been successfully used to detect rare or elusive species, conduct biodiversity inventory, study animal behavior, estimate population parameters, and evaluate the effectiveness of protected area management. Along with the rapid development of modern ecological analysis and modeling tools, camera-trapping will play a more important role in wildlife research at various levels. Meanwhile, along with improvements in techniques, decreasing cost and increasing application interests, camera-trapping will be adopted by more researchers, wildlife managers and protected areas, and can be used for systematic wildlife monitoring using standard protocols. Efforts devoted to its future development and applications should focus on establishing systematically-designed monitoring networks and data-sharing protocols, and developing new analytical approaches and statistical models specifically based on camera-trapping data.
红外相机技术在我国野生动物研究与保护中的应用与前景
DOI:10.3724/SP.J.1003.2014.14203
[本文引用: 1]
20年来, 红外相机技术在国内外野生动物研究、监测与保护中得到了广泛应用。基于红外相机技术, 我国在野生动物生态学研究、动物行为学研究、稀有物种的探测与记录、动物本底资源调查、生物多样性监测及保护地管理与保护评价等领域取得了众多成果。目前, 数学模型、统计分析方法和新的概念正在促进红外相机技术在野生动物监测研究与保护管理中的发展和推广应用。同时, 随着红外相机技术的成熟、成本降低和应用普及, 这一技术也将会被更多的野生动物研究人员、管理人员和自然保护区管理者所采用, 并成为全国各级保护地和区域生物多样性监测研究的关键技术和方法。今后, 建立并完善系统化的监测网络和数据共享平台、开发新一代的数据分析方法与模型, 将是此项技术进一步发展和应用的主要方向。
The species richness of nonvolant mammals in Shennongjia Nature Reserve, Hubei Province, China: Distribution patterns along elevational gradient
DOI:10.17520/biods.2003001 URL [本文引用: 1]
神农架自然保护区非飞行哺乳动物的物种丰富度: 沿海拔梯度的分布格局
DOI:10.17520/biods.2003001
[本文引用: 1]
于1999~2001年调查了神农架自然保护区6个地点不同栖息地的非飞行哺乳动物的物种丰富度。栖息地分为8类:原始林、择伐林(采伐枯立木)、次生林、灌木林、草地、常年性河流水溪、农田和人居住区。小型非飞行哺乳动物调查用捕鼠夹;大型非飞行哺乳动物调查主要根据皮张收购资料以及样线法和痕迹法;用10 m×10 m的样方调查林地树种丰富度。调查发现,神农架自然保护区有非飞行哺乳动物59种[不包括引进种梅花鹿(Cervus nippon)]。在同一海拔高度,原始林通常比择伐林和次生林的物种丰富度高,说明采伐严重降低了物种丰富度。对比同一栖息地不同海拔高度的物种丰富度,我们发现,在中海拔地段(800~1700 m)物种丰富度最高:如在原始林和次生林,海拔1700 m的东溪物种丰富度最高;在择伐林,海拔800 m的九冲物种丰富度最高。聚类分析显示,6个地点的哺乳动物物种组成可以分为两组:高海拔组(2100 m以上)和中低海拔组(1700 m以下)。各地点的哺乳动物物种组成与植被的垂直分布是一致的。各地点的物种丰富度与单位面积(100 m<sup>2</sup>)树种平均丰富度、栖息地类型数和海拔高度相关。3个环境变量间也是相关的:海拔高度对单位面积树种平均丰富度和栖息地类型数有重要影响。根据研究结果提出两点保护建议:第一,保护区的移民迁出和退耕还林工程应首先在物种丰富度最高的九冲进行,而后是东溪和下谷;第二,为了增加个体流和基因流,保护区东西两片相间的非保护区地带应划入保护区,建立栖息地廊道。
Elevation gradients of species-density: Historical and prospective views
DOI:10.1046/j.1466-822x.2001.00229.x URL [本文引用: 1]
Evolutionary history of the angiosperm flora of China
DOI:10.1038/nature25485 URL [本文引用: 1]
Elevational diversity of small mammals in Luoji Mt. Nature Reserve, Sichuan Province
螺髻山自然保护区非飞行小型哺乳动物垂直多样性调查
2009 年4 ~8 月利用铗日法对螺髻山自然保护区非飞行小型哺乳动物的多样性进行了调查。调查于海拔1 800 ~4 150 m间按梯度设置7 个采集样地,每个采集样地内设3 个样带并置铗,有效布铗10 500铗次,捕获非飞行小型哺乳动物5 科8 属15 种,共491 个个体。调查结果表明,调查区域内非飞行小型哺乳动物群落的相对丰富度、丰富度和多样性指数均与海拔存在显著的相关性。统计分析显示:位于阴坡且与水源地相距较近的样地的物种相对丰富度明显高于位于阳坡、距离水源地远的样地;植被类型丰富、降水量充分的中海拔地区(2 200 ~ 2 600 m) 相对丰富度、丰富度和多样性达到最高;而在高海拔(> 3 800 m) 和低海拔区域(< 2 000 m)则较低。非飞行小型哺乳动物的多样性以中低山阔叶灌丛林与亚热带针阔混交林中最高,而在高山流石滩、高山草甸与河谷灌草丛中较低。在本研究的调查区域内,中海拔地区多样性和丰富度最大可能是非飞行小型哺乳动物垂直多样性分布的一个重要特点。
Global analysis of bird elevational diversity
DOI:10.1111/geb.2009.18.issue-3 URL [本文引用: 1]
Elevational gradients in species richness
In: Encyclopedia of Life Sciences, pp. 1-10.
A global record of annual terrestrial Human Footprint dataset from 2000 to 2018
DOI:10.1038/s41597-022-01284-8
PMID:35440581
[本文引用: 1]
Human Footprint, the pressure imposed on the eco-environment by changing ecological processes and natural landscapes, is raising worldwide concerns on biodiversity and ecological conservation. Due to the lack of spatiotemporally consistent datasets of Human Footprint over a long temporal span, many relevant studies on this topic have been limited. Here, we mapped the annual dynamics of the global Human Footprint from 2000 to 2018 using eight variables that reflect different aspects of human pressures. The accuracy assessment revealed a good agreement between our mapped results and the previously developed datasets in different years. We found more than two million km of wilderness (i.e., regions with Human Footprint values below one) were lost over the past two decades. The biome dominated by mangroves experienced the most significant loss (i.e., above 5%) of wilderness, likely attributed to intensified human activities in coastal areas. The derived annual and spatiotemporally consistent global Human Footprint can be a fundamental dataset for many relevant studies about human activities and natural resources.© 2022. The Author(s).
Biodiversity hotspots for conservation priorities
DOI:10.1038/35002501 [本文引用: 1]
Climate-land-use interactions shape tropical mountain biodiversity and ecosystem functions
DOI:10.1038/s41586-019-1048-z [本文引用: 1]
Predictors of elevational biodiversity gradients change from single taxa to the multi- taxa community level
DOI:10.1038/ncomms13736
[本文引用: 1]
The factors determining gradients of biodiversity are a fundamental yet unresolved topic in ecology. While diversity gradients have been analysed for numerous single taxa, progress towards general explanatory models has been hampered by limitations in the phylogenetic coverage of past studies. By parallel sampling of 25 major plant and animal taxa along a 3.7 km elevational gradient on Mt. Kilimanjaro, we quantify cross-taxon consensus in diversity gradients and evaluate predictors of diversity from single taxa to a multi-taxa community level. While single taxa show complex distribution patterns and respond to different environmental factors, scaling up diversity to the community level leads to an unambiguous support for temperature as the main predictor of species richness in both plants and animals. Our findings illuminate the influence of taxonomic coverage for models of diversity gradients and point to the importance of temperature for diversification and species coexistence in plant and animal communities.
Modeling of species distributions with MaxEnt: New extensions and a comprehensive evaluation
DOI:10.1111/j.0906-7590.2008.5203.x URL [本文引用: 1]
Mapping global forest canopy height through integration of GEDI and Landsat data
DOI:10.1016/j.rse.2020.112165 URL [本文引用: 1]
Global elevational diversity and diversification of birds
DOI:10.1038/nature25794 URL [本文引用: 1]
The relationship among area, elevation, and regional species richness in neotropical birds
DOI:10.1086/286028 URL [本文引用: 2]
The patterns and causes of elevational diversity gradients
DOI:10.1111/j.1600-0587.2011.07338.x URL [本文引用: 1]
The elevational gradient in altitudinal range: An extension of Rapoport’s latitudinal rule to altitude
DOI:10.1086/285447 URL [本文引用: 1]
Biodiversity in China’s mountains
DOI:10.1890/1540-9295(2006)004[0347:BICM]2.0.CO;2 URL [本文引用: 1]
Amphibian species richness patterns in karst regions in Southwest China and its environmental associations
DOI:10.17520/biods.2018125
[本文引用: 1]
Patterns in the distribution of species richness have always been a central theme in macroecology. The karst landforms in Southwest China (mainly Guangxi, Yunnan and Guizhou provinces) are among the largest of the global biodiversity hotspots. In this study, we sought to understand spatial patterns of amphibian species richness and its relationship with environmental factors. We compiled a large dataset of 18,246 records of point location data for 219 amphibian species occurring in China. We retrieved this data from published literature, Herpetology museums of Chengdu Institute of Biology and Kunming Institute of Zoology, Chinese Academy of Sciences, Guangxi Zhuang Autonomous Region Museum of Nature and the Central South University of Forestry and Technology, and published sources. We used this data to generate the potential distributions of each species using ecological niche modeling. We combined the potential distributions maps of all species into a composite map to describe species richness patterns on the grid cell of 10 km × 10 km, and then conducted multivariate regression and model selection. Our results showed that 12 species were distributed only in karst area, accounting for 5.48% of the total species pool, 104 species were found in non-karst area (47.49% of total species), and 103 species were found in both karst area and non-karst area (47.03% of total species). Based on the raw data of museum collections data and MaxEnt species distribution modeling, we found that amphibian species richness in the study area decreased at higher latitudes. Karst landforms and non-karst landforms differed in their distribution patterns of amphibian species richness (χ2 = 36.47, P < 0.0001), but the model was a poor fit to the data (McFadden’s Rho square = 0.0037). The most significant environmental predictors of species richness were mean annual rainfall (R2 = 0.232, P < 0.001) and precipitation of driest Month (R2 = 0.221, P < 0.001). The results based on model selection showed that underlying mechanisms related to landforms and different ecological hypotheses might simultaneously explain patterns of amphibian species richness in the study area. Future research should examine other biological factors such as interference, predation, and competition to understand the mechanisms controlling patterns of amphibian species richness.
西南喀斯特地貌区两栖动物丰富度分布格局与环境因子的关系
DOI:10.17520/biods.2018125
[本文引用: 1]
物种丰富度分布格局的成因机制一直是宏观生态学研究的热点问题之一。中国西南地区喀斯特地貌区(以广西、云南和贵州为主)是世界上面积最大的喀斯特地貌区, 也是全球范围内34个生物多样性热点地区之一。为了解该区域两栖动物物种丰富度分布格局及其与环境因子之间的关系, 本研究根据中国科学院成都生物研究所标本馆、中国科学院昆明动物研究所标本馆、广西壮族自治区自然博物馆和中南林业科技大学动物标本室收藏的标本数据, 以及公开发表的文献数据, 共获得18,246条两栖动物记录(219个物种), 然后运用生态位模型估测每个物种的潜在分布区, 并把每个物种的潜在分布区叠加起来, 最终得到该区域在10 km ´10 km生态位模型空间尺度上的两栖物种丰富度地理分布格局图, 最后进行多元回归和模型选择分析。结果表明: 有12种两栖动物仅在喀斯特地貌区分布, 占物种总数的5.48%; 有104种两栖动物仅在非喀斯特地貌区分布, 占物种总数的47.49%; 有103种两栖动物在喀斯特地貌区和非喀斯特地貌区均有分布, 占物种总数的47.03%; 两栖动物物种丰富度随纬度的增高而降低; 地貌类型(喀斯特地貌和非喀斯特地貌)对两栖动物物种丰富度的分布格局有显著影响(χ<sup>2</sup> = 36.47, P < 0.0001), 但模型拟合效果差(McFadden’s Rho square = 0.0037)。影响该区域两栖动物物种丰富度分布格局最大的环境因子是年均降雨量(R<sup>2 </sup>= 0.232, P < 0.001), 其次是最干月平均降雨量(R<sup>2 </sup>= 0.221, P < 0.001)。该区域两栖动物物种丰富度的格局主要是由地貌和不同的环境因子共同相互作用的结果, 不过仍有相当一部分物种丰富度的分布格局未被解释。因此, 要更全面地认识该区域两栖动物物种丰富度格局的形成机制, 有必要加强干扰、捕食、竞争等其他生物因子的影响研究。
Catalogue of mammals in China (2021)
中国兽类名录(2021版)
DOI:10.16829/j.slxb.150595
[本文引用: 1]
中国是全球兽类物种多样性最高的国家之一,掌握我国兽类物种多样性和分类地位是兽类学研究的基础前提,也是科学保护野生种群的前提。为厘清中国兽类的物种数量及分类地位等关键分类学信息,中国动物学会兽类学分会组织国内长期致力于兽类各类群分类的科学研究人员,在总结前人研究的基础上,根据最新的形态学和分子遗传学证据,综合现代兽类分类学家意见,经编委会充分讨论,形成了最新的中国兽类名录,包括我国现阶段兽类12目59科254属686种。该中国兽类名录使用基于系统发生关系的分类系统,并对物种有效性进行了充分慎重的确认和讨论。
Species richness patterns and mechanisms along the elevational gradients
物种丰富度垂直分布格局及影响机制
Species diversity and distribution pattern of non-volant small mammals along the elevational gradient on eastern slope of Gongga Mountain
DOI:10.5846/stxb URL [本文引用: 1]
贡嘎山东坡非飞行小型兽类物种多样性的垂直分布格局
Species inventory and assessment of large- and medium-size mammals and pheasants using camera trapping in the Chebaling National Nature Reserve, Guangdong Province
DOI:10.17520/biods.2019008
[本文引用: 1]
Infrared-camera technology (i.e. camera trapping) has been widely used recently for species inventories and related assessment of terrestrial vertebrates in protected areas across the world. In this study, we provide a case study for how to assess species inventory data of terrestrial birds and mammals based on camera trapping in the Chebaling National Nature Reserve, Guangdong Province. Using camera trapping data from 2017 across the whole area with 80 grids (grid size, 1 km 2) in the reserve, we recorded 15 medium and large mammal species and three pheasant species. Based on species accumulation curves as a function of grids and camera days when 90% of expected species richness was recorded in the reserve, the minimum grids with fixed camera days and the minimum camera days with fixed grids were less during the wet season (June-August) than during the dry season (October-December). Moreover, the minimum grids with fixed camera days and the minimum camera days with fixed grids during the dry season were less than during the wet season. Based the camera trapping data, the species inventory assessment in the reserve can cover species lists and species richness of terrestrial birds and mammals, as well as relative abundance, distribution and voucher images of each species. Therefore, the Chebaling case based on the whole-area species inventory and assessment can provide technical references for China’s natural protected areas.
基于红外相机技术对广东车八岭国家级自然保护区大中型兽类与雉类的编目清查与评估
Applications of camera trapping to wildlife surveys in China
DOI:10.3724/SP.J.1003.2014.14244 [本文引用: 1]
红外相机技术在我国野生动物监测研究中的应用
DOI:10.3724/SP.J.1003.2014.14244 [本文引用: 1]
Uplift-driven diversification in the Hengduan Mountains, a temperate biodiversity hotspot
Camera-trapping survey of mammalian and avian biodiversity in Qianjiangyuan National Park, Zhejiang Province
DOI:10.17520/biods.2019345
[本文引用: 1]
From May 2014 to April 2019, we conducted camera-trapping surveys in the Qianjiangyuan National Park, Zhejiang Province. We divided the park into a grid containing 267 1 km × 1 km plots, with 3 fixed survey stations (> 300 m apart from each other) in each plot. One camera trap was set up in each plot and rotated among the stations within the plot every four months. In the Gutianshan section of the park, the cameras were running for 14 rotations from 2014-2019. The survey started in Hetian, Qixi and Changhong in 2018, and the cameras were rotated once in Qixi and twice in Hetian and Changhong. With a survey effort of 140,413 camera-days from 741 stations in 253 grids, we obtained 268,833 pictures/videos resulting in 74,368 independent detections. The survey recorded 21 wild mammalian and 72 avian species, as well as 5 domestic animal species. Among the species, two (black muntjac Muntiacus crinifrons and Elliot’s pheasant Syrmaticus ellioti) are Class I, and seventeen are Class II national protected animals, accounting for 20.4% of total recorded wild species. Five species are red-listed by the IUCN as Vulnerable and four as Near Threatened, accounting for 9.7% of the total recorded wild species. One species is red-listed as Endangered, nine as Vulnerable and ten as Near Threatened by Red list of China’s vertebrates, accounting for 21.5% of the total recorded wild species. The most detected mammal species was Reeve’s muntjac Muntiacus reevesi, and the most detected bird species was silver pheasant Lophura nycthemera. Our results provide reliable baseline information on the species composition, their spatial distribution, and relative abundance of mammals and birds in the Qianjiangyuan National Park.
利用红外相机公里网格调查钱江源国家公园的兽类及鸟类多样性
DOI:10.17520/biods.2019345
[本文引用: 1]
2014年5月至2019年4月, 作者采用红外相机技术调查了浙江省钱江源国家公园的兽类及鸟类多样性。将整个国家公园划分为267个1 km × 1 km的调查网格, 每个网格内设置3个固定调查位点, 使用1台红外相机定期在同一网格内的位点之间进行轮换。其中, 古田山片区在5年内共完成14轮次调查, 古田山以外的区域自2018年7月纳入调查范围, 何田、长虹片区完成2次轮换, 齐溪片区完成1次轮换。在253个网格内的741个有效位点上共获得140,413个相机工作日的数据, 采集兽类和鸟类的照片和视频268,833份, 有效探测数74,368次, 鉴定出21种野生兽类, 72种野生鸟类, 5种家畜及家禽。包括国家一级重点保护野生动物2种, 即黑麂(Muntiacus crinifrons)、白颈长尾雉(Syrmaticus ellioti); 国家二级重点保护野生动物17种, 合计占野生物种总数的20.4%。被IUCN物种红色名录评估为易危(VU)的5种, 近危(NT)的4种, 合计占物种总数的9.7%。被中国脊椎动物红色名录评估为濒危(EN)的1种, 易危(VU)的9种, 近危(NT)的10种, 合计占物种总数的21.5%。相对多度指数最高的大中型兽类为小麂(Muntiacus reevesi), 鸟类为白鹇(Lophura nycthemera)。本次调查获得了国家公园内兽类和鸟类的多样性组成、空间分布和相对多度, 为长期科研监测和科学管理提供了基础数据。
Biodiversity along elevational gradients: The commemoration of the 250th birthday of Alexander von Humboldt
生物多样性的海拔梯度格局——纪念亚历山大·冯·洪堡诞辰250周年
Trait-mediated filtering drives contrasting patterns of species richness and functional diversity across montane bird assemblages
DOI:10.1111/jbi.v47.1 URL [本文引用: 1]
Trait-environment relationships differ between mixed-species flocking and nonflocking bird assemblages
The distribution pattern of the babblers (Timaliidae) in China
中国画眉科鸟类分布格局探讨
Comparing the effectiveness of camera trapping to traditional methods for biodiversity surveys of forest birds
DOI:10.17520/biods.2017275
[本文引用: 1]
To compare the effectiveness of camera trapping to more common mist netting, fixed-distance line transect, and fixed-radius point count methods of forest birds, we surveyed bird species diversity at Nanling National Nature Reserve and Chebaling National Nature Reserve, Guangdong, China from 2011 to 2016. At Nanling, 222 bird species were recorded by fixed-distance line transect and fixed-radius point count methods, 43 bird species were captured by mist netting and 47 bird species were trapped by cameras. One species was captured only by mist netting, six species only by camera-trapping, and 164 species only by fixed-distance line transect and fixed-radius point count methods. At Chebaling, 109 bird species were recorded by fixed-distance line transect and fixed-radius point count methods, 42 by mist nets and 27 by cameras. Nine species were recorded only by mist netting, three only by camera-trapping, and 97 only by fixed-distance line transect and fixed-radius point count methods. At both sites, the number of birds captured by mist netting was negatively correlated with increasing body size, whether measured as body weight, body length, wing length, or tarsus length. By contrast, the number of birds photographed by camera traps was positively correlated with the same measures of body size. These results show that bird surveys using different methods may yield different results and that method should be selected to suit the body size of the target bird species. In surveying bird diversity of a wide range of body sizes, mist netting and camera trapping together would be complimentary methods. Our results suggest that a combination of research methods may be necessary to obtain reliable avian diversity estimates.
红外相机技术与其他几种森林鸟类多样性调查方法的比较
DOI:10.17520/biods.2017275
[本文引用: 1]
为了探讨红外相机技术、网捕法、固定距离样线法和固定半径样点法对森林鸟类多样性调查的有效性和实用性, 我们于2011-2016年, 用这几种方法调查了广东南岭国家级自然保护区和车八岭国家级自然保护区的鸟类多样性。在南岭, 固定距离样线法和固定半径样点法记录鸟类222种, 网捕鸟类43种, 红外相机拍到鸟类47种; 其中1种鸟仅网捕到, 6种鸟仅被红外相机拍到, 164种鸟仅被固定距离样线法和固定半径样点法记录到。在车八岭, 固定距离样线法和固定半径样点法记录鸟类109种, 网捕鸟类42种, 红外相机拍到鸟类27种, 其中9种鸟仅网捕到, 3种鸟仅被红外相机拍到, 97种鸟仅被固定距离样线法和固定半径样点法记录到。随着鸟类的体重、体长、翅长和跗蹠增加, 网捕到的鸟类个体数量减少, 鸟类身体大小与网捕到的鸟类数量呈显著负相关; 而红外相机拍到的鸟类数量随鸟类的身体大小增大而增加, 并且呈显著的正相关。本文的结果显示, 网捕法和红外相机技术针对不同类群的鸟类调查效力不同, 但都是固定距离样线法和固定半径样点法的有效补充。建议今后开展森林鸟类多样性调查与监测时, 尽量采用多种研究方法相结合, 以求达到最优的效果。
Multi-disciplinary research values of the Nanling Mountains
DOI:10.13284/j.cnki.rddl.003054
[本文引用: 1]
The Nanling Mountains contain one of the most important subtropical evergreen broad-leaved forests on earth, as compared with other regions at the same latitudes.The region forms an important ecological barrier in southern China and is the source of several significant rivers, including the Xiangjiang, Ganjiang and Beijiang Rivers.The unique Danxia landform led to international recognition of the importance of the Nanling Mountains in the 20th century.Over the past 90 years, research in the Nanling Mountains area has included geological structure, granite mineralization, Danxia landform, climate change, biodiversity, flora, large fungi and the monitoring of birds, mammals and butterflies.There has also been research into evergreen broad-leaved forests, the Nanling Corridors, nature reserves, landscape patterns and ecological tourism.We found that the Nanling region was of great significance not only in relation to studies of its physical and human geography, geosciences and life sciences, such as biodiversity, flora and ecosystems, but also for inter-disciplinary and multi-disciplinary research.We suggest that the region could be used as a long-term research base with high potential values for comprehensive, inter-disciplinary and multi-disciplinary research.
南岭山地的多学科综合研究价值
Promoting diversity inventory and monitoring of birds through the camera-trapping network in China: Status, challenges and future outlook
DOI:10.17520/biods.2017057
[本文引用: 1]
During the past two decades, camera-trapping has been widely used in biodiversity monitoring and wildlife research across China. Most of the existing camera-trapping projects focus on mammals, and birds are frequently considered in by-catch records. We analyzed 230 wildlife camera-trapping research projects in China since 1992, on the basis of an exhaustive review of Chinese and English literature, including published articles, conference reports, public news, and additional unpublished datasets. Results showed that at least 393 wild bird species, belonging to 17 orders and 56 families and accounting for 28.67% of the total number of bird species in China, have been documented using camera-trapping since 1992. The order with the most recorded species was Passeriformes (268). On the family level, Turdidae had the highest number of recorded species (58), followed by Timaliidae (50) and Phasianidae (42). There were 23 families that each only had one recorded species. Ground- and understory-dwelling forest birds accounted for the majority of all birds recorded, in terms of either species richness or camera detections. Published bird records were characterized by regional imbalances. Sichuan and Yunnan provinces were the most surveyed provinces, with 16 and 14 sites, respectively. The highest species richness was recorded in Sichuan (160), followed by Yunnan (91) and Zhejiang (66). A total of 104 new regionally recorded species were reported. Given the fact that there is still an abundance of camera-trapping data that has not been published, we speculated that the actual recorded bird species should be higher. These results indicated that camera-trapping can produce considerable bird distribution data of high accuracy, high quality and large amounts, which may provide a significant contribution to biodiversity monitoring and regional inventories of birds in China. Terrestrial birds, including Galliformes, Turdidae and Timaliidae, should be included as one of the target groups in current and future monitoring networks using standardized camera-trapping techniques, and such networks could also complement data and support the inventory and diversity monitoring of other taxa.
基于红外相机网络促进我国鸟类多样性监测: 现状、问题与前景
DOI:10.17520/biods.2017057
[本文引用: 1]
近20年来, 红外相机调查技术在我国生物多样性监测与野生动物研究中得到了广泛应用。已有的红外相机调查不仅关注哺乳动物类群, 而且也记录到了大量鸟类物种, 但大多被作为兽类监测中的兼捕(by-catch)记录。我们系统检索并收集了1992年以来, 在我国使用红外相机技术的野生动物监测与研究所发表的学术文献、会议报告、新闻报道和部分未发表数据集共230篇(份), 从中提取并汇总鸟类物种与分布记录。结果显示, 全国通过红外相机技术共记录到至少393个鸟种, 分属17目56科, 占全国鸟类物种总数的28.67%, 其中雀形目物种数最多(268种)。在科的水平上, 记录到物种数最多的分别是鸫科(58种)、画眉科(50种)与雉科(42种); 另有23科各仅记录到1个物种。在物种数及探测数方面, 地面及林下层活动的森林鸟类均是红外相机记录到的绝对优势类群。已发表的红外相机鸟类记录具有区域性不均衡的特征, 四川(16个)和云南(14个)是红外相机调查点最多的省区, 而四川(160种)、云南(91种)和浙江(66种)则是记录到鸟类物种数最多的省区。据不完全统计, 红外相机共记录到区域性鸟类物种新记录104种(次)。考虑到仍有大量红外相机调查中的鸟类记录被忽视或未及发表报道, 我国红外相机所记录到的实际鸟类物种多样性应该更高。这些结果表明, 红外相机技术在我国鸟类多样性监测和区域性编目工作中具有重要的作用, 可以提供高精度、高质量和大数据量的鸟类物种分布数据。对于以鸡形目为代表的地栖鸟类, 可以作为目标类群之一纳入现有的基于红外相机技术的标准化长期监测体系, 而这样的监测体系也可以为其他鸟类类群的多样性编目和监测提供数据补充和支持。
