


中国是海洋大国, 对海洋资源的开发利用是国家重要的发展战略。海岛作为海洋生态系统的重要组成部分, 是实施海洋开发的重要依托①(①李洋 (2017) 基于多要素的海岛型城市生态状况评价. 硕士学位论文, 福州大学, 福州.)。由于特殊的地理区位, 海岛具有地貌类型和地域结构简单、生态系统的多样性指数小和稳定性弱等特点, 加上稀缺的淡水资源造成海岛稀薄的土壤和不良的植被覆盖(赖华燕等, 2017; Zheng et al, 2020)。因此, 海岛生态系统有限的自我调节能力使其更容易受到外来入侵物种的影响(Luo et al, 2022)。随着我国沿海地区经济高速发展, 海岛城市化建设不断加速, 人员、货物往来日益密切, 外来有害生物入侵的风险正在加剧。此外, 海岛比内陆地区拥有更多可入侵的途径, 例如数量众多的港口, 为入侵种提供了更多的便利(Seebens et al, 2017)。
红火蚁(Solenopsis invicta)作为最具破坏力的外来入侵物种之一, 由于其极具侵略性的特性, 能够对生态环境造成严重威胁(陆永跃和曾玲, 2015)。2003年, 我国台湾地区最早发现红火蚁危害。台湾岛温暖湿润的气候为红火蚁提供了非常适合的栖息条件, 红火蚁灾害在此能够全年发生。同时, 海风的携带也扩大了红火蚁自然扩散的范围, 加大了防控难度。自入侵以来, 红火蚁不仅危及台湾岛生态平衡, 而且还破坏各种设施, 并对人类健康和农业生产构成重大威胁(Liu et al, 2021)。由于与台湾岛拥有相似的地理环境和气候条件, 我国其他位于长江口以南海域的海岛型城市, 大部分都已发生红火蚁危害(陈宜雪, 2020; 韦丽逢等, 2021)。其中, 位于福建省东部的海坛岛自2010年以来先后被确立为国际旅游岛、自由贸易试验区, 城市建设热潮方兴未艾。与此同时, 红火蚁对其危害也越发严重。2016年原农业部印发的《全国农业植物检疫性有害生物分布行政区名录(2016)》首次将海坛岛所属行政区列入红火蚁分布区(
目前, 国内外学者就红火蚁在各类生境及不同空间尺度下的适生分布、空间格局和种群扩散的分析、预测方法大致分为: 回归模型、生态位模型和空间分析模型。回归模型是运用非线性回归模型(generalized additive model, GAM)、Iwaom*-m回归分析法和Taylord幂模型等方法分析红火蚁分布范围及差异性(李宁东等, 2006; 孙印兵, 2009①(①孙印兵 (2009) 入侵红火蚁空间分布规律及监测技术研究. 硕士学位论文, 福建农林大学, 福州.); 许益镌等, 2010)。生态位模型是基于CLIMEX、GARP等理论模型, 结合气候因子, 构建红火蚁分布模型, 预测其适生区域及入侵概率(薛大勇等, 2005; 陈林等, 2006; 沈文君等, 2008; 陈晓燕等, 2015)。空间分析模型是利用空间叠加、直线距离法、最近邻体法、Kriging空间插值、地理统计等方法研究红火蚁空间分布和种群扩散规律(陈晨等, 2006; 陆永跃等, 2008; 王磊等, 2012; 张翔等, 2015)。上述方法虽然从不同角度探讨了红火蚁的发生分布规律, 但是多数模型仅以统计学、气候学或地理学等单一因子为切入点, 且缺乏对社会经济因子的分析。海岛作为相对独立且特殊的生态系统, 红火蚁的发生分布是环境因子和社会经济因子共同驱动的结果。不同因子的影响力存在差异, 各类因子之间也存在着复杂的交互作用。因此, 研究环境因子和社会经济因子对海岛型城市红火蚁发生程度空间格局的影响及交互驱动机制, 能够更加全面、系统地揭示海岛在城市化发展中红火蚁的入侵、定殖和扩散规律以及背后的成因, 为海岛红火蚁防控提供科学依据。
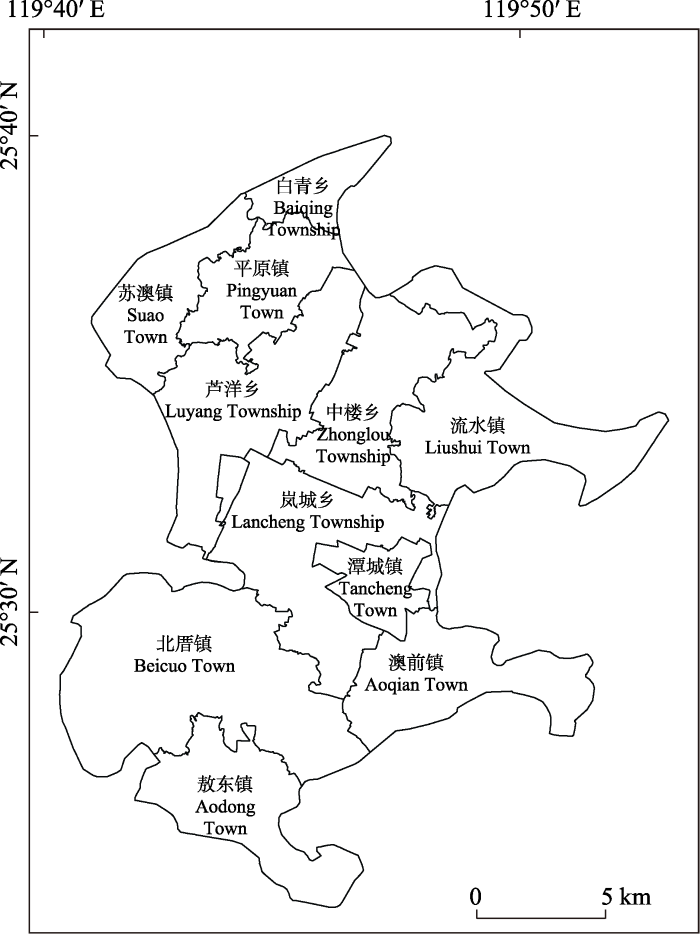
1 研究区概况
图1
2 研究方法
2.1 方法
2.1.1 红火蚁疫情调查及发生程度指标
本研究以红火蚁危害地块的蚁巢密度衡量红火蚁发生程度, 并参照国家标准《红火蚁疫情监测规程》(GB/T 23626-2009), 按蚁巢密度分级标准, 对危害地块的红火蚁发生程度进行分级(王福祥等, 2009)。研究区红火蚁疫情数据来自于作者团队曾经参与的2017年平潭综合实验区主岛红火蚁疫情调查, 该调查数据是运用GIS空间分析技术, 基于调查人员采集的蚁巢定位数据, 依据红火蚁种群生活习性划定蚁巢周边30 m内的区域作为该蚁巢危害范围(陈宜雪, 2020; 陈宏等, 2021)。根据蚁巢空间分布形态划定的危害范围可以形成单个、多个甚至是连片的危害地块。蚁巢密度是通过危害地块大小以及包含的蚁巢数量进行测算, 其公式为:
式中, ρ表示危害地块的蚁巢密度, m表示危害地块内的蚁巢数量, s表示危害地块面积。
2.1.2 核密度分析
核密度分析的理论基础是概率, 它基于地理事件可以发生在空间中的任何位置, 但发生的概率不一样(韩宗伟, 2017)。具体表现为红火蚁发生越密集的区域其周边发生红火蚁危害的概率也就越大, 红火蚁发生分布密集程度与核密度值呈正比, 其公式为:
式中, f (x, y)是位于(x, y)位置红火蚁发生分布的核密度估计值, n为红火蚁危害地块的数量, di为(x, y)位置距离第i个红火蚁危害地块质心的距离, ρi为第i个红火蚁危害地块的蚁巢密度, t为核密度测算搜索半径的平滑参数。
2.1.3 空间自相关统计
局部Moran指数Ii则表示地块i红火蚁发生程度与邻近红火蚁发生地块的聚集显著性, 其公式为:
式中, n为红火蚁危害地块的数量, ρi、ρj分别为地块i和地块j的红火蚁发生密度,
2.1.4 地理探测器分析
本研究运用地理探测器模型从空间分异性角度研究环境因子与社会经济因子对海岛型城市红火蚁发生程度空间格局的驱动机制, 其基本原理是: 假设研究区分为若干子区域, 如果子区域的红火蚁发生程度方差之和小于区域总方差, 则存在空间分异性; 如果影响因子两两之间的空间分布趋于一致, 则两者存在统计关联性(王劲峰和徐成东, 2017; 李志鹏等, 2019; 陈宽等, 2021)。本研究采用地理探测器的因子探测、生态探测和交互作用探测3种模型。模型分析所需样点是通过在红火蚁危害地块内进行200 m等间隔采样获得。影响因子的类型值均代表样点所在空间位置的属性。模型分析的因变量为样点所在危害地块的蚁巢密度, 自变量为样点所在空间位置影响因子的类型值。
因子探测用于分析各影响因子对红火蚁发生程度空间分异的解释度, 用q值度量, 其公式为:
式中, L表示被分析影响因子的分类数量或离散分级数量, Nh和σ2h分别为类别h包含的红火蚁危害地块中样点的数量和蚁巢密度方差, N和σ2分别为研究区内所有红火蚁危害地块中样点的数量和蚁巢密度方差。q的值域为[0,1], q值越大则表示影响因子对红火蚁发生程度的影响力越强, 反之则越弱。
生态探测用于比较两个因子对红火蚁发生程度的影响是否有显著差异, 以F统计量来衡量, 其公式为:
式中, Nx1和Nx2分别表示因子x1和x2红火蚁危害地块中样点的数量, L1和L2分别表示因子x1和x2分类数量或离散分级数量,
交互作用探测可以识别不同影响因子之间的交互驱动作用, 即影响因子x1和x2共同驱动时是否会增加或减弱对红火蚁发生程度的影响力, 或这些因子对红火蚁发生程度的影响是否相互独立。两个影响因子之间的关系如表1所示。
表1 影响因子交互关系及作用
Table 1
| 交互关系 Interaction relationship | 交互作用 Interaction effect |
|---|---|
| q(x1∩x2) < Min(q(x1), q(x2)) | 非线性减弱 Nonlinear attenuation |
| Min(q(x1), q(x2)) < q(x1∩x2) < Max(q(x1), q(x2)) | 单因子非线性减弱 One-factor nonlinear attenuation |
| q(x1∩x2) > Max(q(x1), q(x2)) | 双因子增强 Two-factor enhancement |
| q(x1∩x2) = q(x1) + q(x2) | 独立 Independence |
| q(x1∩x2) > q(x1) + q(x2) | 非线性增强 Nonlinear enhancement |
2.2 数据来源与处理
2.2.1 数据来源
我们综合考虑了海坛岛自然气候条件, 以及特有的社会、经济、交通等状况, 选择影响红火蚁发生程度的18种因子。8种环境因子包括: 数字高程模型(digital elevation model, DEM)、坡度、地表覆盖、归一化植被指数(normalized difference vegetation index, NDVI)、土壤类型、年均降水量、年积温和干燥度; 10种社会经济因子包括: 夜间灯光、乡镇面积、村庄数量、农村人口数量、路网密度、邻近道路距离、邻近道路类型、邻近景区距离、邻近码头距离、离跨海大桥距离。影响因子数据来自网络公开数据、研究区遥感影像解析和统计年鉴资料(国家统计局农村社会经济调查司, 2019)。为保证研究结果准确, 影响因子数据均采用与红火蚁疫情调查时间相近年份的数据集。各影响因子数据来源如表2所示。此外, 海坛岛海岸边界数据来自国家基础地理信息中心(
表2 红火蚁发生程度空间格局影响因子及数据来源
Table 2
| 类别 Category | 影响因子 Impact factors | 数据来源 Data sources |
|---|---|---|
| 环境因子 Environmental factors | 数字高程模型 Digital elevation model (DEM) (x1) | SRTM ( |
| 坡度 Slope (x2) | 通过分析DEM数据获得 Obtained by analyzing DEM data | |
| 地表覆盖 Land cover (x3) | 通过解析Landsat 8卫星影像获得 Obtained by analyzing Landsat 8 satellite images | |
| 归一化植被指数 Normalized difference vegetation index (NDVI) (x4) | ||
| 土壤类型 Soil classification (x5) | 资源环境科学与数据中心 Resource and Environment Science and Data Center (www.resdc.cn) | |
| 年均降水量 Average annual precipitation (x6) | ||
| 年积温 Annual cumulative temperature (x7) | ||
| 干燥度 Drought index (x8) | ||
| 社会经济因子 Socio-economic factors | 夜间灯光 Night light (x9) | 珞珈一号数据 Luojia-1 Data ( |
| 乡镇面积 Township area (x10) | 中国县域统计年鉴(乡镇卷): 2018 China Statistical Yearbook (Township): 2018 (国家统计局农村社会经济调查司, 2019) | |
| 村庄数量 Number of villages (x11) | ||
| 农村人口数量 Rural population size (x12) | ||
| 路网密度 Road network density (x13) | 通过分析OSM数据获得 Obtained by analyzing OSM data | |
| 邻近道路距离 Distance to nearby road (x14) | ||
| 邻近道路类型 Adjacent road type (x15) | ||
| 邻近景区距离 Distance to nearby scenic spot (x16) | ||
| 邻近码头距离 Distance to nearby wharf (x17) | ||
| 离跨海大桥距离 Distance to the cross-sea bridge (x18) |
2.2.2 数据处理
数据处理包括数据提取、数据离散化、数据采样和因子共线性检测。在数据提取中: 通过DEM地形分析生成坡度数据; 采用监督分类法对2017年4月2日的Landsat 8卫星遥感影像进行目视解译生成地表覆盖数据; 通过对2017年4月2日的Landsat 8卫星遥感影像进行定量分析生成NDVI数据; 乡镇面积、村庄数量、农村人口数量3类数据是将研究区乡镇矢量数据与统计年鉴进行属性关联, 形成空间矢量专题图层; 路网密度是通过对研究区道路矢量数据进行网格化分析, 统计每公里网格内道路长度; 邻近道路距离和类型、邻近景区距离、邻近码头距离、离跨海大桥距离是通过对研究区道路矢量数据和相关要素空间位置数据进行邻近分析, 获得与样点邻近要素的距离。由于地理探测器要求输入的自变量必须为类型量, 综合运用自然间断点法和分位数法对连续型影响因子数据进行离散化处理, 从中选择因子影响力q值最大的离散分级结果。为消除影响因子之间的共线性问题, 对采集的样点变量与自变量进行多重共线性诊断, 保证各自变量的方差膨胀因子(variance inflation factor, VIF值)小于10。
本研究涉及的核密度分析、空间自相关统计以及分析结果的地图绘制使用ArcGIS Desktop软件完成, 影响因子共线性检测使用SPSS软件完成, 地理探测器分析使用Geodetector软件完成, 影响因子分析结果制图使用ChiPlot在线制图工具(
3 结果
3.1 红火蚁发生程度空间格局
3.1.1 红火蚁发生程度空间分布
根据2017年红火蚁疫情普查结果, 海坛岛11个乡镇均有红火蚁危害发生, 调查发现红火蚁活动蚁巢69,182个, 危害面积2,826.88 ha, 形成危害地块1,178个。红火蚁发生程度以轻度(一级)和中度(二级)为主, 占总体危害面积的78%。未发现严重(五级)地块。在分布上, 中偏重(三级)和重度(四级)发生地块主要集中在中北部芦洋乡、中楼乡和岚城乡。在生境类型上, 以农田区域发生面积最大, 其次为道路周边的园林绿化用地, 居民区周边红火蚁发生面积最小, 中偏重和重度发生地块主要集中在农田区域。在分布形态上, 农田区域多呈片状分布, 道路周边的园林绿化用地多呈条带状分布, 居民区周边呈零星点状分布。海坛岛红火蚁发生分布状况如图2(a)所示。
图2
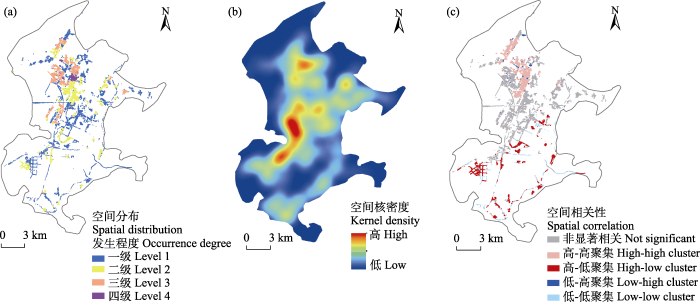
图2
海坛岛红火蚁发生程度空间格局
Fig. 2
Spatial pattern of occurrence degree of Solenopsis invicta in Haitan Island
3.1.2 红火蚁发生程度空间核密度
核密度函数预测结果表明, 海坛岛红火蚁发生程度空间密度呈现显著的不均匀聚集特征: 以岚城乡、北厝镇、芦洋乡、流水镇4个乡镇为中心呈现带状的高密度和中高密度区域, 并以此为中心向周边辐射。与上述乡镇相邻的敖东镇、澳前镇、中楼乡、平原镇、潭城镇大部分区域为中密度区, 而处于海坛岛东北部的苏澳镇和白青乡为低密度区, 如图2(b)所示。根据疫情普查结果, 高密度区为海坛岛最早发现的红火蚁入侵点。结合地表覆盖和道路数据, 高密度与中高密度区域主要集中在农田区域、新建城区和新建道路周边的新植绿化带。
3.1.3 红火蚁危害地块空间自相关性
海坛岛红火蚁危害地块全局Moran指数I为0.012376, 运用P值和z值进行统计量检验: P值为0.000086 (P < 0.001), z得分为3.92826, 统计量检验达显著水平。结果显示海坛岛红火蚁危害地块的发生程度呈现正空间自相关关系。进一步采用局部Moran指数Ii分析局部集聚特征, 结合局部空间关联指标图(local indicators of spatial association, LISA)进行空间可视化展示。如图2(c)所示, 红火蚁发生程度高-高聚集区域集中在北部中楼乡和平原镇的农田区域, 发生程度高-低聚集区域和低-低聚集区域则零散分布于北厝镇、敖东镇、澳前镇和潭城镇主干道及新建城区周边, 低-高聚集区域所占比例较少, 零星分布于北部中楼乡和平原镇的居民区。空间自相关分析同样验证了海坛岛红火蚁发生程度空间格局特征表现为农田最为严重、城镇化建设中新植园林绿化用地次之、居民地周边最轻。
3.2 红火蚁发生程度影响因子及交互作用
3.2.1 因子影响力探测
18种影响因子对红火蚁发生程度空间分异解释度的q值范围为0.014-0.278, 所有影响因子满足P < 0.05的显著验证(图3)。其中: 农村人口数量(x12) q值最高(0.278), 坡度(x2) q值最低(0.014)。社会经济因子影响力平均q值高于环境因子。影响力排名前三的因子均为社会经济因子, 且都与农业农村相关。排名4-5位的因子是与交通运输相关的邻近码头距离(x17)和邻近道路类型(x15)。在环境因子中, 土壤类型(x5)和年均降水量(x6)的影响力较强, q值大于0.1; 其余环境因子的q值均低于0.1。结果显示, 研究区社会经济因子对红火蚁发生程度的影响力水平高于环境因子。
图3
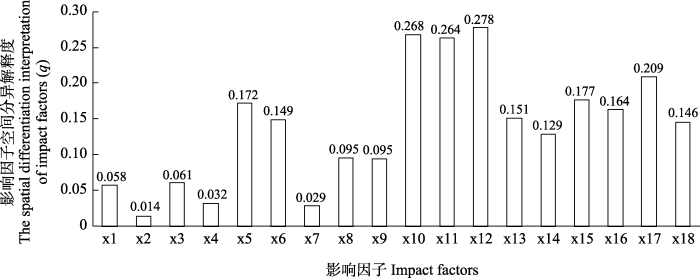
图3
红火蚁发生程度影响因子空间分异解释度探测结果。影响因子代号含义见
Fig. 3
Detection results of spatial differentiation interpretation of factors affecting the occurrence degree of Solenopsis invicta. See
3.2.2 因子生态探测
生态探测模型分析表明, 社会经济因子相互之间对红火蚁发生程度的影响不存在显著差异(图4)。在环境因子中, 土壤类型(x5)和年均降水量(x6) 2个影响力较强的因子与地形、植被相关的因子存在显著的影响力差异, 其余环境因子之间不存在显著差异。就两类因子整体而言, 环境因子与社会经济因子对红火蚁发生程度的影响力存在差异。
图4
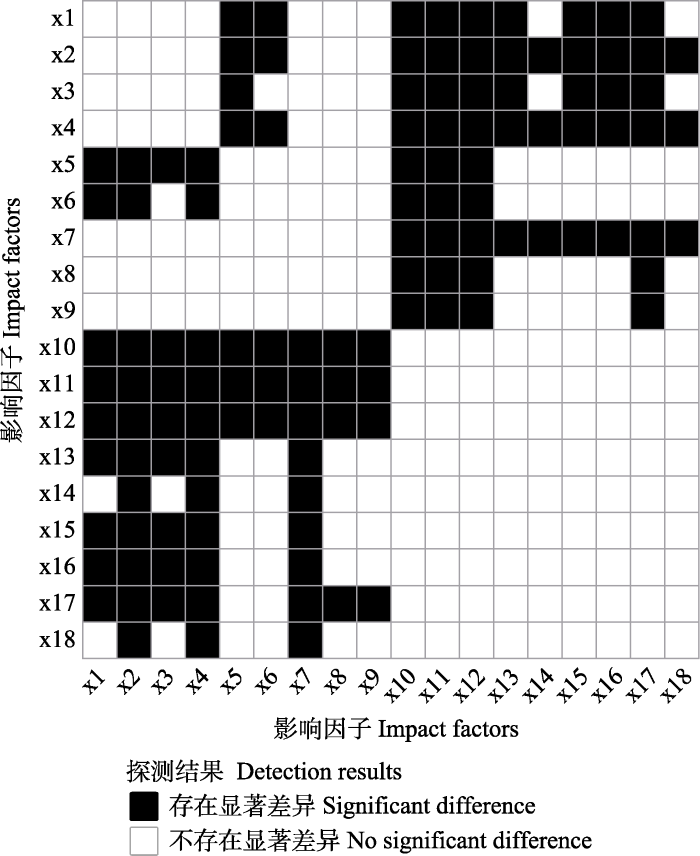
图4
红火蚁发生程度影响因子生态探测结果。影响因子代号含义见
Fig. 4
Ecological detection results of the impact factors of occurrence degree of Solenopsis invicta. See
3.2.3 因子交互作用探测
根据因子交互作用探测结果, 任意两种因子交互作用对红火蚁发生程度的影响力都大于单一因子的独立影响力, 不论是环境因子还是社会经济因子, 叠加作用都将正向增强红火蚁发生的程度(图5)。其中: 乡镇面积(x10)与邻近景区距离(x16)、年均降水量(x6)与邻近景区距离(x16)两组因子交互作用对红火蚁发生程度的影响力最大, q值为0.466。同时, 在18种因子中, 坡度(x2)、NDVI指数(x4)、邻近景区距离(x16)、邻近码头距离(x17)、离跨海大桥距离(x18)容易受到其他因子的影响, 能够分别与8种以上不同因子交互作用后表现为非线性增强。因此, 海坛岛的地形、植被、旅游资源分布、码头分布、跨海大桥等特有条件与其他环境、社会经济因子叠加作用后对红火蚁发生程度具有显著增强效果。
图5
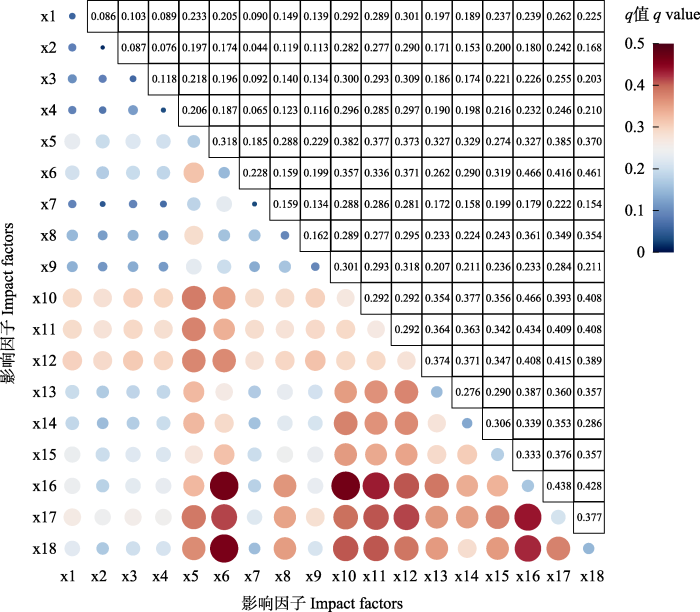
图5
红火蚁发生程度影响因子交互探测结果。影响因子代号含义见
Fig. 5
Interactive detection results of the impact factors of occurrence degree of Solenopsis invicta. See
4 讨论
本研究以海坛岛为例, 研究了红火蚁发生程度空间格局及其驱动因子的交互作用机制。研究结果显示海岛在城镇化建设过程中所引发的红火蚁发生程度空间格局呈现不均匀聚集, 社会经济因子对红火蚁发生程度的影响力水平高于环境因子, 农业耕作、城镇化建设中绿化苗木引种、道路交通运输在红火蚁入侵、定殖和扩散过程中起到关键性作用, 防控时可采取针对性措施, 提高防控效率。
4.1 海坛岛红火蚁入侵与扩散特征
在入侵后的短距离传播中, 除了依靠载体的携带运输之外, 海岛区域常年大风, 极大促进了红火蚁的自然扩散。从2013年首次发现红火蚁到2017年扩散至全岛11个乡镇, 如果以海坛岛南北长度进行测算, 红火蚁扩散速度可达到每年7.2 km, 高于华南地区非海岛区域红火蚁短距离传播的研究案例(陆永跃等, 2008)。但即使在这样的扩散速度下, 红火蚁危害并未覆盖海坛岛每个角落, 红火蚁发生程度核密度分析和空间自相关分析结果显示, 扩散趋势在区域以及生境类型上存在差异。海坛岛红火蚁扩散是以多个高密度区域为中心向四周辐射。然而在北部君山和南部敖东镇的山地, 受地形因素影响, 红火蚁扩散趋势发生改变, 出现局部小的低密度区域。
在海坛岛各类红火蚁发生生境中, 农田红火蚁发生程度最为严重, 新植园林绿化用地次之, 居民区周边最轻。这与华南地区非海岛区域典型生境中红火蚁发生状况(许益镌等, 2010)基本一致。在危害地块发生程度聚集性上, 新植园林绿化用地表现为高-低聚集, 农田表现为高-高聚集。说明城镇化建设和道路周边的新植绿化地是红火蚁早期入侵生境。与周边生境相比, 这些区域红火蚁危害地块更为集中、发生程度也更高。当红火蚁入侵农田后, 种群迅速定殖、扩散, 在农田生境内形成较为稳定的大范围聚集形态。
4.2 多因子对海坛岛红火蚁发生程度的驱动效应
红火蚁通过飞行方式的自然扩散和定殖往往受到复杂环境的影响, 扩散距离和速度非常有限。由于绿化苗木、沙土、建材等常常是红火蚁扩散的载体, 因此人为传播很大程度上影响着红火蚁的筑巢(许益镌等, 2006)。本研究结果同样印证了社会经济因子对海坛岛红火蚁发生程度的影响力大于环境因子。
在18种影响因子中, 排名前三的农村人口数量、乡镇面积和村庄数量都是与农业农村相关的因子。虽然, 绿化苗木引种是红火蚁长距离传入的主要因素, 且入侵后人为操作和经常性的绿化苗木栽植、移除能够促进红火蚁进一步传播扩散(陆永跃等, 2008)。但是, 在红火蚁进入农田后, 由于海坛岛农业用水匮乏, 农田以旱作为主, 加上适宜的气候、特有的农事耕作习惯、不规范防治处置, 导致红火蚁种群数量在短期内迅速扩大。在红火蚁疫情普查时, 有村民反映对于农田发现的红火蚁蚁巢经常采用火烧、铲除或使用触杀类农药喷洒等不规范防治措施。此外, 由于海坛岛水产资源丰富, 当地时有将海鲜壳、虾头等海鲜废料搅碎后回填农田以提升土壤肥力的耕作习惯, 这些海鲜废料为红火蚁种群提供了丰富的食物, 从而加剧了红火蚁的扩散, 促成了农田区域红火蚁种群密度的稳定, 导致海坛岛农田与田埂的红火蚁发生程度没有显著差异。另一方面, 农田区域充足的食物也降低了红火蚁对饵剂的取食性, 增加了防控难度。上述特征也表现出了海岛区域与非海岛区域农田生态系统的红火蚁发生程度空间分布特征的差异性(李宁东等, 2006)。
近年来, 城镇建设的大量投入促进海坛岛道路交通条件得到大幅度提升, 同时所引发的红火蚁危害也日益凸显。根据分析结果, 除了农业农村因子, 道路交通运输因子对海岛型城市红火蚁发生程度也有着较大的影响。有研究指出在海岛区域农业用地、交通用地和土地利用变化地区发生红火蚁的概率大于自然覆盖土地, 以及在邻近道路150-350 m区域内的红火蚁发生概率大于其他地区(Lin et al, 2022)。而海坛岛红火蚁发生程度空间格局也验证了上述结论。
4.3 多尺度红火蚁发生程度空间格局及驱动因子研究的复杂性
在区域尺度上分析外来入侵物种的空间分布格局及其影响因子对预测生物入侵的影响及入侵种控制管理具有重要意义(王国欢等, 2017)。地理探测器已被运用于区域或更大空间尺度农林有害生物空间格局驱动力的研究(李志鹏等, 2019; 吴晓春和肖桂荣, 2020; 刘德庆等, 2022)。根据《中华人民共和国生物安全法》规定, 县级以上地方人民政府有关部门根据职责分工, 负责生物安全相关工作。本研究以县域尺度为切入点, 运用地理探测器探讨在新兴海岛型城市建设过程中影响红火蚁发生程度空间格局的驱动因子, 结果表明地理探测器同样适用于县域尺度红火蚁发生程度空间格局驱动因子的分析。但是, 在县域尺度上环境因子的空间异质性较小, 而社会经济因子则有可能因地域发展的不均衡而存在较大差异, 从而导致在红火蚁发生程度的影响力水平上, 社会经济因子大于环境因子。由于我国幅员辽阔、生境多样, 在不同区域尺度以及生境类型下就社会经济因子与环境因子对红火蚁发生程度影响力水平的差异化, 值得在后续的研究中进一步探讨。
4.4 海岛型城市红火蚁防控策略
在海岛型城市的红火蚁传入、定殖、扩散过程中, 输入性的绿化苗木引种是外因, 而农业耕作、道路交通运输、城镇化建设以及自然气候条件是内因。红火蚁传入扩散的主要原因之一就是在进境检疫中忽视了对红火蚁的检查、阻截和除害处理(陆永跃和曾玲, 2015)。根据本研究结果, 海岛型城市在红火蚁疫情防控中应加强对调运苗木、货物等载体的检疫。发现新发疫情点应及时灭杀。对于已经入侵的区域, 要结合入侵地的生境类型、地形以及耕作习惯, 采取规范药剂投放、改变耕作模式、加强防效追踪等措施。同时, 加强对农田、新植绿化地等易受红火蚁入侵区域的监测, 及时发现防控薄弱环节, 避免防控遗漏。此外, 海岛型城市可以利用自身在地理区位上的封闭优势, 在码头、跨海大桥出入口设置检查关卡, 及时发现并拦截带有红火蚁的货物, 从源头上控制红火蚁的传入。
参考文献
Local indicators of spatial association—LISA
DOI:10.1111/gean.1995.27.issue-2 URL [本文引用: 1]
Potential establishment areas of Solenopsis invicta in China: A prediction based on GIS
Based on geographic information system (GIS), the potential establishment areas of Solenopsis invicta Buren in China were predicted. The days above threshold temperature and the number of degree-days were used as main determining factors, while annual precipitation and altitude were used as limiting factors. By using the Kriging spatial interpolation function in GIS software, the potential establishment area was divided into four categories, i.e., most suitable, suitable, mildly suitable, and unsuitable. The most suitable area was in the greater part of Guangdong, central and southern Guangxi, small part of southern Yunnan, Hainan, Taiwan, Hong Kong, and Macao, suitable area was in southern Yunnan, northern Guangxi and Guangdong, southern Henan, western Anhui, greater part of Zhejiang, central and eastern Hubei, Chongqing, Hunan, Jiangxi, and Fujian, mildly suitable area was in the greater parts of Anhui and Henan, central and eastern Hebei and Shandong, Beijing, Tianjian, central and northern Jiangsu, northwestern Zhejiang and Hubei, southern Shanxi, eastern Sichuan, central and western Guizhou, and small part of central Yunnan, and unsuitable area was in the greater parts of northwest, northeast, and north China.
基于地理信息系统的红火蚁在中国适生区的预测
Construction and application of Solenopsis invicta Buren epidemic investigation system based on mobile location based service
基于移动LBS服务的红火蚁疫情调查系统构建与应用
Effects of natural and human factors on vegetation normalized difference vegetation index based on geographical detectors in Inner Mongolia
基于地理探测器的内蒙古自然和人为因素对植被NDVI变化的影响
The analysis for the red imported fire ant Solenopsis invicta (Hymenoptera: Formicidae) distribution in China based on 3S technology, climate model and colony dynamic model
基于GIS和气候、种群动态模型的红火蚁适生性分析
The prediction on potential distribution of Solenopsis invicta in Yunnan Province based on CLIMEX and ArcGIS
基于CLIMEX和ArcGIS预测红火蚁在云南的潜在适生区
Investigation of Solenopsis invicta Buren on the main island of Pingtan Comprehensive Experimental Area
平潭综合实验区主岛红火蚁疫情调查
Dynamic evaluation of ecological security and its driving factors in the process of urbanization of Islands: A case study of Pingtan Island
海岛城市化过程中的生态安全动态评价与驱动力分析——以平潭岛为例
Geographical distribution and affecting factors of the important agricultural heritage systems in China
中国农业文化遗产的空间分布特征及影响因素分析
Potential geographical distribution model of Solenopsis invicta Buren in China
红火蚁在中国的潜在地理分布预测模型
Analysis of the main imapct factors on soil erosion in island city—An example of Pingtan Island, Fujian Province
海岛型城市的土壤侵蚀状况及主要影响因子分析——以福建省平潭岛为例
Study on types of environment, spatial distribution and sampling of red imported fire ant Solenopsis invicta Buren active mounds in Wuchuan, Guangdong Province
广东省吴川红火蚁生境类型、空间分布和抽样技术的研究
Spatial variation and driving factors of invasive plants in Fujian Province, China
福建省主要入侵植物空间分异及其影响因素
DOI:10.13287/j.1001-9332.201908.010
[本文引用: 2]

在实地调查数据的基础上,本研究结合GIS空间分析技术和地理探测器模型,分析福建省入侵植物空间分布情况,以及地理与社会环境因子及其交互作用对入侵植物分布的影响.结果表明: 福建省共记录入侵植物82种,其中,优势科为菊科,小蓬草、藿香蓟和空心莲子草出现频次最高.沿海区域的入侵植物物种数量多于内陆区域,福州和厦门为福建省外来入侵植物的两大热点地区.入侵植物在不同海拔均有分布,但入侵植物的种类随着海拔的升高总体呈下降趋势.地理探测器分析显示,自然环境因子中降水和社会经济因子中路网密度、人口密度是入侵植物空间分布的主要影响因子.各因子的空间交互作用会正向影响入侵植物的空间分布,这反映出入侵植物空间分布影响要素的复杂性.综上,将地理探测器应用到入侵植物研究领域是可行的,筛选出的环境指示因子可用于监测福建省入侵植物的适生区,从而为采取有效的防控措施提供科学依据.
Modeling geographical invasions of Solenopsis invicta influenced by land-use patterns
DOI:10.1038/s41598-022-15399-w
[本文引用: 1]
Research into geographical invasions of red imported fire ants (RIFAs) by anthropogenic disturbances has received much attention. However, little is known about how land-use change and the characteristics of roads with different land-use types are associated with the risk of RIFA successful invasion or remaining at the highest level of invasion (RIFA SIRH). Furthermore, it was often assumed in prior studies that the risk of RIFA SIRH had a linear association with the independent variables. However, a linear relationship may not reflect the actual circumstances. In this study, we applied linear and nonlinear approaches to assess how land-use types, distance from the nearest road, different land-use types, and spatial factors affect the risk of RIFA SIRH. The results showed that agricultural land, land for transportation usage, and areas that had undergone land-use change from 2014 to 2017 had greater odds of RIFA invasion than natural land cover. We also identified land for transportation usage and the area of land-use change from 2014 to 2017, had more than 60% of RIFA SIRH within 350 m and 150 m from the nearest road. This study provided important insights into RIFA invasions in an isolated island and the areas of control strategies implemented.
Spatial stratified heterogeneity and driving force of Anoplophora glabripennis in North China
华北地区光肩星天牛空间分异性及驱动因素研究
Establishment and social impacts of the red imported fire ant, Solenopsis invicta, (Hymenoptera: Formicidae) in Taiwan
DOI:10.3390/ijerph18105055
URL
[本文引用: 1]
The first report of the red imported fire ant (RIFA), Solenopsis invicta Buren, in Taiwan was in the city of Taoyuan in 2003. The government has made great efforts to bring RIFA-infested areas under control. RIFA has gradually spread outward since its discovery, but it is still confined in northern Taiwan, in part due to the control efforts. RIFA is well established in densely populated environments (i.e., urban areas), causing damage to public utilities and significantly affects the inhabitants of Taiwan. Out of 10,127 human encounters with RIFA reported by the Plant Pest Information Management System in the Bureau of Animal and Plant Health Inspection and Quarantine, Council of Agriculture, Executive Yuan, 3819 (37.71%) persons were stung, with 834 (21.8%) persons exhibiting wheal-and-flare reaction (swelling and redness of the skin). Among the victims, 288 (7.5%) sought medical care, and about 21 (0.6%) developed severe cellulitis and urticaria. Unexpectedly, 2.8% (106) of the victims exhibited anaphylactic shock, which was higher than previously reported cases (1%). The high anaphylactic shock percentage was probably because most victims were elderly farmers or because Asian people have higher sensitivity to the RIFA sting. RIFA is well adapted to the environmental conditions in Taiwan, which makes it extremely difficult (if not impossible) to eradicate. The management of RIFA in the future should focus on lowering the speed of spread to mitigate possible dangers to the inhabitants. Six major challenges of RIFA management in Taiwan are also discussed.
Study on expansion pattern of red imported fire ant, Solenopsis invicta Buren, in South China
华南地区红火蚁局域和长距离扩散规律研究
10 years after red imported fire ant found to invade China: History, current situation and trend of its infestation
发现红火蚁入侵中国10年: 发生历史、现状与趋势
Invasive alien plants and invasion risk assessment on Pingtan Island
DOI:10.3390/su14020923
URL
[本文引用: 1]
Pingtan Island is the largest island in Fujian Province and the fifth largest island in China. The invasion of a large number of alien plants has had a profound impact on the local ecological environment. Because the harm caused by alien invasive plants varies greatly between different ecosystems and even in different habitats, the risk assessment index system suitable for one region may not be suitable for other regions. Therefore, it is necessary to establish a risk assessment index system for invasive alien plants on Pingtan Island. Alien plant communities in different habitats were studied by means of quadrat investigation and professional literature review. Some invasive alien species were selected and compiled into a list of invasive alien plants on Pingtan Island, and their species composition, origin, flora, life forms, and habitats were statistically grouped. There were 104 species in 80 genera and 37 families of alien invasive plants. Asteraceae, Fabaceae, Amaranthaceae, and Poaceae were the main families, accounting for 26.7%, 6.7%, 6.7% and 5.8% of the total species, respectively. The geographical components of families and genera have obvious tropical properties, accounting for 51.3% and 66.6% of the total species, respectively. These originated mainly from South America and North America, accounting for 45.5% and 30.1% of the total frequency, respectively. Annual herbs, biennial herbs, and perennial herbs accounted for 84.6% of the total species. Based on a DPSIR conceptual model and an AHP method, an invasion risk assessment of 104 invasive alien plants was conducted. The ecological adaptability, habitat distribution and landscape impact of species were considered in the selection of indicators and the formulation of standards. A total of 23 high-risk invasive species were identified at level I, 37 medium-risk invasive species at level II, and 44 low-risk invasive species at level III. Lantana camara L. had the highest risk score (49), followed by Cenchrus echinatus L. (45), Spartina alterniflora Loisel. (45), and Panicum repens L. (43.5). Suggestions are put forward to prevent the invasion of alien plants on Pingtan Island and to provide a theoretical basis for promoting the healthy and stable development of the ecological environment on the island.
Study on Risk Assessment for Alien Species in Xiamen
厦门外来物种入侵风险评估研究
No saturation in the accumulation of alien species worldwide
DOI:10.1038/ncomms14435
PMID:28198420
[本文引用: 2]
Although research on human-mediated exchanges of species has substantially intensified during the last centuries, we know surprisingly little about temporal dynamics of alien species accumulations across regions and taxa. Using a novel database of 45,813 first records of 16,926 established alien species, we show that the annual rate of first records worldwide has increased during the last 200 years, with 37% of all first records reported most recently (1970-2014). Inter-continental and inter-taxonomic variation can be largely attributed to the diaspora of European settlers in the nineteenth century and to the acceleration in trade in the twentieth century. For all taxonomic groups, the increase in numbers of alien species does not show any sign of saturation and most taxa even show increases in the rate of first records over time. This highlights that past efforts to mitigate invasions have not been effective enough to keep up with increasing globalization.
Application of analogy deviation to predict potential distribution of Solenopsis invicta Buren (Hymenoptera: Formicidae) and its invasion probability in China
应用相似离度法预测红火蚁在中国适生区域及其入侵概率
Spatial distribution of invasive alien animal and plant species and its influencing factors in China
中国外来入侵生物的空间分布格局及其影响因素
Geodetector: Principle and prospective
DOI:10.11821/dlxb201701010
[本文引用: 1]
Spatial stratified heterogeneity is the spatial expression of natural and socio-economic process, which is an important approach for human to recognize nature since Aristotle. Geodetector is a new statistical method to detect spatial stratified heterogeneity and reveal the driving factors behind it. This method with no linear hypothesis has elegant form and definite physical meaning. Here is the basic idea behind Geodetector: assuming that the study area is divided into several subareas. The study area is characterized by spatial stratified heterogeneity if the sum of the variance of subareas is less than the regional total variance; and if the spatial distribution of the two variables tends to be consistent, there is statistical correlation between them. Q-statistic in Geodetector has already been applied in many fields of natural and social sciences which can be used to measure spatial stratified heterogeneity, detect explanatory factors and analyze the interactive relationship between variables. In this paper, the authors will illustrate the principle of Geodetector and summarize the characteristics and applications in order to facilitate the using of Geodetector and help readers to recognize, mine and utilize spatial stratified heterogeneity.
地理探测器: 原理与展望
DOI:10.11821/dlxb201701010
[本文引用: 1]
空间分异是自然和社会经济过程的空间表现,也是自亚里士多德以来人类认识自然的重要途径。地理探测器是探测空间分异性,以及揭示其背后驱动因子的一种新的统计学方法,此方法无线性假设,具有优雅的形式和明确的物理含义。基本思想是:假设研究区分为若干子区域,如果子区域的方差之和小于区域总方差,则存在空间分异性;如果两变量的空间分布趋于一致,则两者存在统计关联性。地理探测器q统计量,可用以度量空间分异性、探测解释因子、分析变量之间交互关系,已经在自然和社会科学多领域应用。本文阐述地理探测器的原理,并对其特点及应用进行了归纳总结,以利于读者方便灵活地使用地理探测器来认识、挖掘和利用空间分异性。
Nest distribution and dynamics of colony movement of red imported fire ant in lawn
草坪生境中红火蚁蚁巢空间关系和蚁群迁移动态规律研究
Spatiotemporal distribution pattern of the COVID-19 epidemic and geographical detection
城市群新冠疫情时空分布格局与分异机制的地理探测
A preliminary investigation on the epidemic of Solenopsis invicta in Haikou
海口市红火蚁疫情初步调查
Spatio-temporal distribution patterns of Fusarium interception in coastal areas of China
中国沿海地区镰刀菌属口岸截获时空分布格局分析
Spatial distribution characteristics of the nests of newly invaded red imported fire ants
新入侵地红火蚁蚁巢的空间分布特征
Study on location expansion of Solenopsis invicta
红火蚁局域扩散规律研究
A prediction of potential distribution area of Solenopsis invicta in China
红火蚁在中国的分布区预测
Expansion of Solenopsis invicta Buren in Fujian Province
福建省入侵红火蚁扩散规律研究
Ecological suitability of island development based on ecosystem services value, biocapacity and ecological footprint: A case study of Pingtan Island, Fujian, China
DOI:10.3390/su12062553
URL
[本文引用: 1]
The ecological environment and resource endowment of an island are more vulnerable compared to the mainland, and special assessment and measurement of the ecological suitability for development are significant. Pingtan Island (Fujian, China) was taken as a case study. Changes in ecosystem services value and the profit-and-loss balance between ecological footprint and biocapacity were assessed using land use/cover changes based on remote-sensing images taken in 2009, 2014 and 2017, and the ecological suitability of development was measured. Results show that island development led to a decrease in the ecosystem services value and an increase in ecological footprint and biocapacity. The key ecological factors restricting the scale of island development are topography, vegetation with special functions and freshwater. Biocapacity of islands can increase not only by changing from lower-yield land types to higher-yield construction land types but also by external investment. A new measurement framework was proposed that simply and clearly reveals the ecological suitability of island development and the underlying key constraints.
