


物种多样性大尺度分布格局及其形成机制长期以来一直是生态学的核心研究议题之一(Gaston, 2000; Anderson et al, 2011)。作为物种多样性的重要组成部分, beta多样性度量的是群落物种组成的时空变异(Whittaker, 1960), 可以为揭示生物多样性维持机制提供重要依据(陈圣宾等, 2010)。因此, beta多样性被广泛用于检验生态学中群落构建的相关机理或假说(Legendre et al, 2009; Myers et al, 2013)。近10年来, 有学者提出可以将beta多样性分解为研究区域内每个取样单元对beta多样性的贡献(local contribution to beta diversity, LCBD)和物种对beta多样性的贡献(species contribution to beta diversity, SCBD) (Legendre & De Cáceres, 2013)。LCBD可以量化每个采样单元中物种组成的生态特异性(ecological uniqueness), 其值越高表明采样点物种组成生态特异性越高, 物种组成越独特(Legendre & De Cáceres, 2013; Sor et al, 2018)。因此, 研究群落生态特异性可以精确定位高保护价值的局域群落, 为制定针对性的保护、恢复或管理措施提供依据(Legendre & De Cáceres, 2013; Yao et al, 2021)。以往的研究表明, 基于LCBD指标制定的保护方案对于提高生物多样性监测和保护成效有着巨大应用潜力(Legendre & Gauthier, 2014; Vilmi et al, 2017)。
近年来, 许多研究尝试量化LCBD对总的beta多样性的影响(Qiao et al, 2015; Dubois et al, 2020; Yao et al, 2021; Dansereau et al, 2022)。这些研究表明群落生态特异性与土壤养分、土壤pH值、坡度、坡向、群落物种丰富度和多度等多个环境因素密切相关(da Silva et al, 2018; Sor et al, 2018; Wang et al, 2022), 但群落生态特异性与环境因素的关系在不同生态系统类型中存在显著差异(Yao et al, 2021; Wang et al, 2022)。例如, 植物群落物种丰富度与群落生态特异性的关系在暖温带针叶林中呈负相关, 但在亚热带常绿落叶阔叶混交林则呈正相关(Yao et al, 2021)。此外, 有研究发现局域环境变量可以很好地解释粪甲虫和大型无脊椎动物群落的生态特异性(da Silva et al, 2018; Sor et al, 2018), 但底栖无脊椎动物群落生态特异性与局域环境变量仅有着微弱的相关性(Heino & Grönroos, 2017)。有研究表明物种丰富度、多度等群落特征对生态特异性有着重要影响(Dubois et al, 2020; Yao et al, 2021)。还有研究表明物种丰富度与群落生态特异性的关系受到常见种和稀有种在群落中的比例的影响(da Silva et al, 2018)。当常见种在群落中优势明显时, 群落物种丰富度与生态特异性将呈现为负相关, 反之稀有种占优势则呈现为正相关(Qiao et al, 2015; da Silva et al, 2018)。然而, 土壤、气候和物种丰富度等不同因素对群落生态特异性的相对影响在不同生态系统类型中存在显著差异(Yao et al, 2021; Wang et al, 2022)。例如, 土壤养分对亚热带常绿落叶阔叶混交林群落生态特异性有着显著影响, 但对温带针叶林群落生态特异性则没有显著影响(Yao et al, 2021)。
荒漠具有干旱、养分贫瘠、紫外线辐射强烈、生长季短等极端环境胁迫特征(蒋志刚, 2018)。植物在适应荒漠极端环境胁迫时, 具有形态结构与繁育对策适应、特殊生理特征适应和机会主义适应等多种适应类型, 且植被与植物组成具有残遗性和古老性, 形成了特殊区系特征, 是我国极具特色的植物种质资源和基因库(夏延国等, 2013)。荒漠植物群落与环境相互适应, 形成了脆弱且敏感的生态系统, 导致荒漠植物多样性保育极其困难。当前干旱区正在遭受气候变化和极端天气的影响(Deng et al, 2022), 且气温上升速率高于全球平均水平(Li et al, 2012), 荒漠植物群落一旦遭到破坏将很难得到恢复。因此, 开展荒漠植物多样性分布格局及其形成机制的研究具有重要意义。过去十几年来, 生态学家已经就荒漠植物区系、物种丰富度格局、群落结构及其影响因素等开展了大量卓有成效的研究(李新荣等, 2009; 王健铭等, 2016; 钟悦鸣等, 2017; 肖元明等, 2018)。然而, 温带荒漠植物群落生态特异性大尺度地理分布格局, 以及土壤、气候以及群落特征等不同环境因素的相对贡献尚有待进一步深入研究。
依托中国黑戈壁综合科学考察、中国荒漠植物群落调查等荒漠区大型综合科考项目, 本研究在准噶尔盆地、塔里木盆地、吐哈盆地、天山南北麓、阿尔泰山南麓、昆仑山北麓、阿尔金山山麓、河西走廊、阿拉善高原、阴山北麓等中国主要温带荒漠集中分布区开展了系统的野外调查和室内分析工作, 获取了948个植物群落的生态特异性数据, 以及土壤和气候等环境数据, 以期探讨以下问题: (1)中国温带荒漠植物群落生态特异性存在怎样的地理分布格局? (2)哪些环境因素影响着温带荒漠植物群落生态特异性? 这些因素的相对作用如何?
1 材料与方法
1.1 调查区域与调查线路设计
本研究选择在准噶尔盆地、塔里木盆地、吐哈盆地、天山南北麓、阿尔泰山南麓、昆仑山北麓、阿尔金山山麓、河西走廊、阿拉善高原、阴山北麓等中国温带荒漠主要分布区设置调查线路, 调查线路尽量覆盖不同的地理单元、地形地貌和地带性植被类型, 共设置植被调查点316个(图1)。
图1
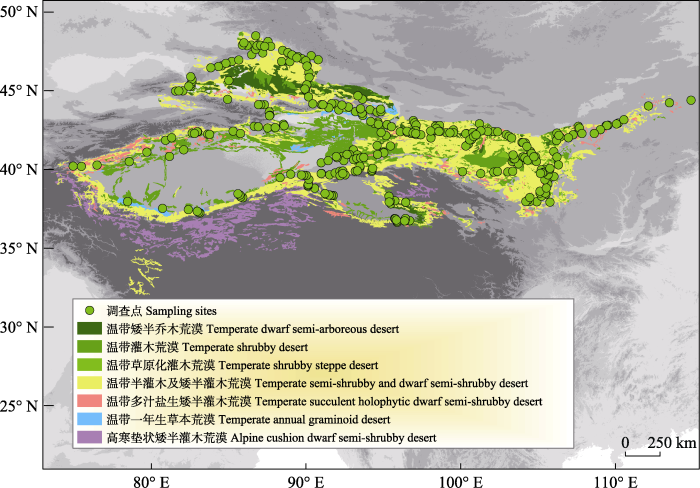
图1
中国温带荒漠植物群落调查样点分布图
Fig. 1
Distribution of sampling sites across the temperate deserts of China
1.2 植物群落调查和土壤理化性质测定
在2015-2020年每年生长季高峰期(7-8月), 针对植被组成与生境水土分布情况, 在每个调查样点设置3个10 m × 10 m的调查样方, 共计948个。在每个调查样方内, 依据方精云等(2009)群落调查技术规范, 调查和记录样方内所有植物种类、多度、盖度、平均高度等指标, 并记录样点地理坐标、地形特征以及地表砾石盖度等。本次共计调查了6个地带性的植被类型, 基本上涵盖了中国温带荒漠主要植被类型; 其中温带矮半乔木荒漠调查样方102个、温带灌木荒漠294个、温带半灌木及矮半灌木荒漠417个、温带草原化灌木荒漠66个、温带多汁盐生矮半灌木荒漠60个、温带一年生草本荒漠9个。调查包括了红砂(Reaumuria songarica)、膜果麻黄(Ephedra przewalskii)、梭梭(Haloxylon ammodendron)、合头藜(Sympegma regelii)、沙拐枣(Calligonum mongolicum)、白刺(Nitraria tangutorum)、泡泡刺(N. sphaerocarpa)、戈壁藜(Iljinia regelii)、沙冬青(Ammopiptanthus mongolicus)、霸王(Zygophyllum xanthoxylum)、木本猪毛菜(Salsola arbuscula)等研究区内主要的地带性优势群落类型, 共计记录植物262种, 分属35科130属, 其中小乔木2种、灌木94种、一年生草本54种、多年生草本107种、藤本4种、攀援植物1种。
根据土壤异质性情况, 在每个样方使用土钻随机采集15-30份0-10 cm土壤样品, 混合后剔除石子、根系及杂质, 用2 mm土壤筛进行筛选, 并选择一部分样品测定鲜重。本研究选择土壤含水量(soil moisture, SM)、有机碳含量(soil organic carbon content, SOC)、总氮含量(soil total nitrogen content, TSN)、pH值来表征土壤理化条件。其中, 土壤含水量通过烘干法测定, 土壤有机碳含量利用重铬酸钾法测定, 土壤总氮含量利用凯氏定氮法测定, 利用pH计测定土壤pH值。
1.3 气候变量数据
本研究针对温带荒漠气候本底现状, 选择前期研究表明可能对植物群落多样性有重要影响的5个气候变量来反映气候特征(Wang et al, 2012): 年均降水量(mean annual precipitation, MAP)、降水季节性(precipitation seasonality, PS)、年均温(mean annual temperature, MAT)、温度季节性(temperature seasonality, TS)、太阳辐射强度(solar radiation, SRAD)。利用经纬度坐标, 从气候共享网站(
1.4 植物群落beta多样性和生态特异性计算
其中, $\bar{Y}_{i}$为物种j在所有群落/样方中的物种多度平均值, Yij为物种j在群落/样方i中的盖度, n为样方数量, Sij为物种j在群落/样方i中的盖度与在所有群落/样方中物种多度平均值差异的平方和, SStotal为物种盖度矩阵的总平方和, BDtotal为方差的无偏估计, 可以用于度量群落beta多样性。
Legendre和De Cáceres (2013)提出群落物种多度总方差度量的beta多样性可以进一步分解为物种贡献和取样单元贡献两部分。取样单元的贡献可以反映群落或样方物种组成的独特程度, 即群落生态特异性。具体计算方式如下:
其中, SSj为物种j对应的盖度差异总平方和, SSi为取样单元i或群落i中所有物种对应的盖度差异总平方和。SCBDj为物种j对beta多样性的贡献, LCBDi为群落或取样单元i对beta多样性的贡献。
1.5 数据统计与分析
首先对经度、纬度、海拔、土壤含水量、pH值、有机碳含量、总氮含量、年均降水量、降水季节性、年均温、温度季节性、太阳辐射强度和群落特征(物种丰富度、植物群落盖度)进行标准化处理(平均值为0, 标准差为1), 以消除各个变量间量纲差异的影响。使用一元线性回归和二次项回归分析检测各个变量与荒漠植物群落LCBD的关系。本文通过以下两个步骤来确定变量与LCBD的关系为线性关系还是二次项关系: 首先分别计算一元线性模型和二次项回归模型的AIC值, 当两个回归模型AIC差值超过10时, 则认定AIC值更小的那个模型更加适合拟合变量与LCBD的关系(Burnham & Anderson, 2004); 例如当二次项回归模型AIC值比一元线性回归模型AIC值少于10及以上时, 则判定变量与LCBD的关系为二次曲线关系。此外, 为了分析稀有种对植物群落LCBD的影响, 本文将样方分布频率小于5%的物种判定为稀有物种(王健铭等, 2016), 通过计算稀有物种在每个群落中的相对比例来分析稀有种比例与物种丰富度的关系。
运用逐步多元回归与方差分解分析来探究不同环境因素对群落LCBD的相对作用。为了消除因子间存在的严重共线性影响, 当两个变量间相关系数大于0.7时, 剔除与LCBD相关性更弱的变量, 本研究在进行逐步回归分析前先剔除了土壤有机碳含量(附录1)。针对多元回归分析不同组间因子依然可能存在严重共线性的问题, 本研究采用以下3个步骤来避免数据过度拟合以及因子间的严重共线性(Burnham & Anderson, 2004): (1)剔除膨胀因子(VIF)大于3的解释变量; (2)运用step函数, 以AIC信息为准则进行逐步筛选, 进而得到最低AIC值的模型; (3) 完成上述两次模型修正后, 再对模型进行显著性检验(Padj < 0.05), 并只保留显著变量, 最终得到最佳解释变量组合。
2 结果
2.1 植物群落生态特异性地理分布格局
研究区植物群落beta多样性为0.873, 对beta多样性的相对贡献(SCBD)排名前10位的物种分别为红砂、膜果麻黄、白刺、梭梭、霸王、驼绒藜(Ceratoides latens)、沙拐枣、合头藜、绵刺(Potaninia mongolica)和泡泡刺, 这些物种对beta多样性贡献的大小范围为0.025-0.086 (附录2)。此外, 研究还发现小乔木和灌木物种对beta多样性的贡献显著高于草本物种(图2, P < 0.05)。
图2
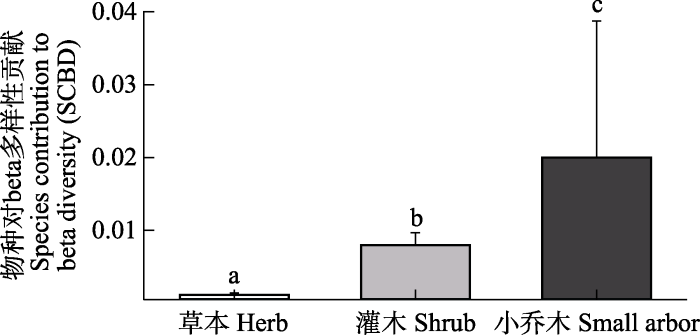
图2
不同生活型物种对beta多样性贡献的差异性(平均值 ± 标准误)。不同字母表示不同生活型物种之间存在显著差异(P < 0.05)。
Fig. 2
Difference in the species contribution to beta diversity (SCBD) among different life forms (mean ± SE). Different letters indicate significant differences among different life forms (P < 0.05).
各取样单元(样方)对植物beta多样性的相对贡献(LCBD)大小范围为0.00067-0.00136。一元线性和二次项回归分析结果显示荒漠植物群落LCBD与经度呈显著负相关, 但随着纬度和海拔的升高均呈现先降低后增加的趋势(图3, P < 0.0001)。
图3
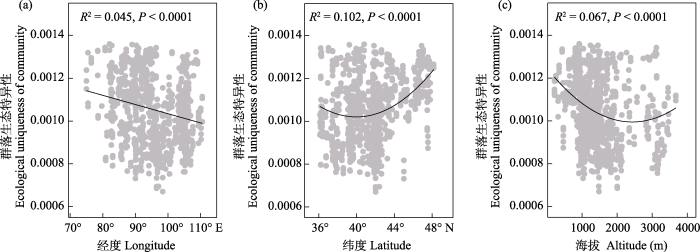
图3
中国温带荒漠植物群落生态特异性随经度(a)、纬度(b)和海拔(c)的变化趋势
Fig. 3
Trends of the ecological uniqueness of plant communities across the temperate deserts of China along longitude (a), latitude (b) and altitude (c)
2.2 温带荒漠植物群落生态特异性与环境变量间的关系
表1 单个环境因子与植物群落生态特异性的关系
Table 1
| 变量 Variable | R2 | 斜率 Slope | P |
|---|---|---|---|
| 物种丰富度 Species richness (SR) | 0.044 | US | < 0.0001 |
| 植物群落盖度 Plant community coverage (PCC) | 0.036 | US | < 0.0001 |
| 土壤含水量 Soil moisture (SM) | 0.018 | 0.00002 | < 0.0001 |
| 土壤总氮含量 Soil total nitrogen content (TSN) | 0.039 | 0.00003 | < 0.0001 |
| 土壤pH值 Soil pH (pH) | 0.080 | US | < 0.0001 |
| 年均温 Mean annual temperature (MAT) | 0.037 | US | < 0.0001 |
| 年均降水量 Mean annual precipitation (MAP) | 0.074 | US | < 0.0001 |
| 降水季节性 Precipitation seasonality (PS) | 0.166 | -0.396 | < 0.0001 |
| 太阳辐射强度 Solar radiation (SRAD) | 0.123 | US | < 0.0001 |
US表示先减后增的二次曲线关系。
US represents a quadratic relationship characterized by a decrease followed by an increase.
图4
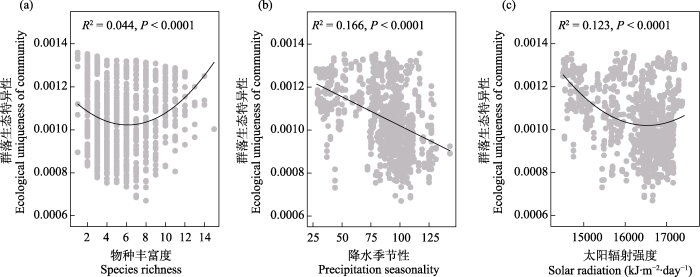
图4
中国温带荒漠植物群落生态特异性随物种丰富度(a)、降水季节性(b)和太阳辐射强度(c)的变化趋势
Fig. 4
Trends of the ecological uniqueness of plant communities across the temperate deserts of China along species richness (a), precipitation seasonality (b) and solar radiation (c)
逐步回归模型分析结果显示荒漠植物群落LCBD主要由经度、物种丰富度、群落盖度、土壤含水量、土壤总氮含量、土壤pH值、年均温和降水季节性共同调控(图5a, 所有变量P < 0.05)。在综合考虑其他变量的作用后, 降水季节性对温带荒漠植物群落LCBD的空间变化有着最强的解释率。另外植物群落物种丰富度对LCBD也有着比其他变量更重要的影响。
图5
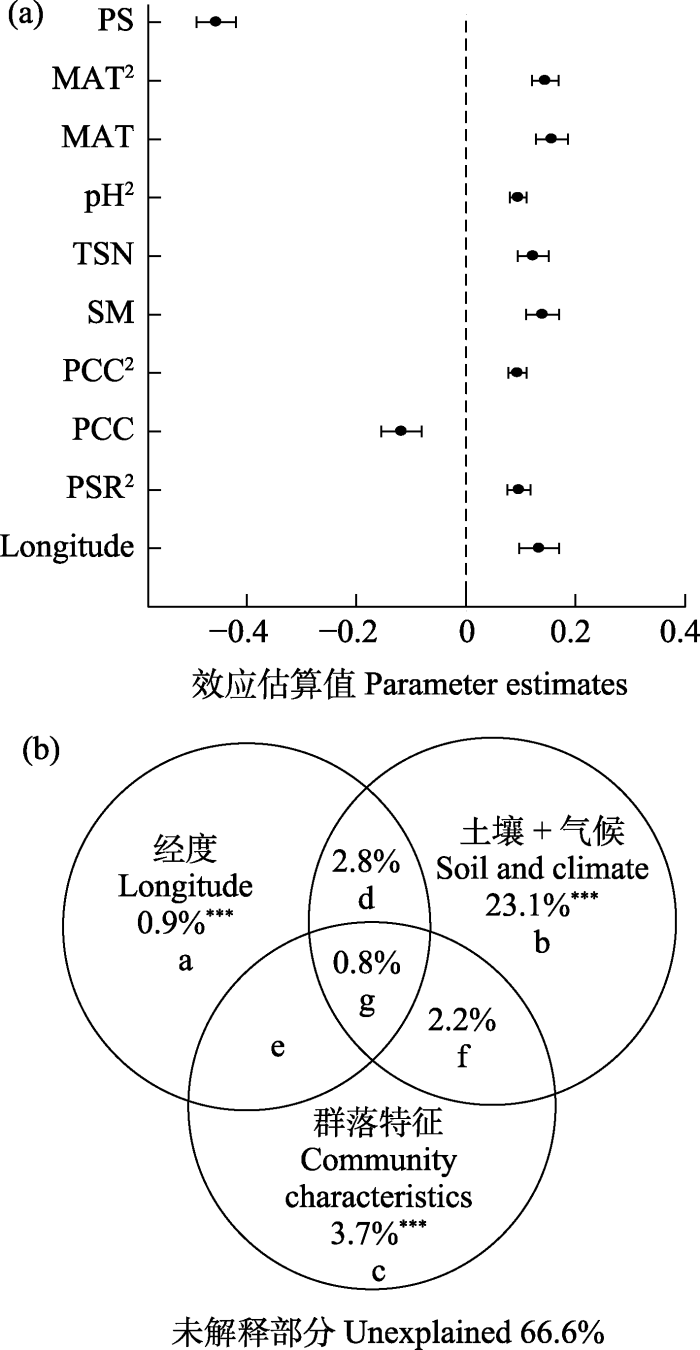
图5
不同变量对植物群落生态特异性的相对影响。(a)进入逐步回归模型中各个变量的效应估计值与95%置信区间; (b)经度、土壤和气候、群落特征(物种丰富度和植物群落盖度)的解释率。Longitude: 经度; SR: 物种丰富度; PCC: 植物群落盖度; SM: 土壤含水量; TSN: 土壤总氮含量; pH: 土壤pH值; MAT: 年均温; PS: 降水季节性。**, P < 0.001。
Fig. 5
Relative influence of different variables on the ecological uniqueness of plant communities. (a) Parameter estimates and the associated 95% confidence interval of each variable that enters into final models; (b) The explanation of longitude, soil and climate, community characteristics (species richness and plant community coverage) to the ecological uniqueness of plant communities. SR, Species richness; PCC, Plant community coverage; SM, Soil moisture; TSN, Soil total nitrogen content; pH, Soil pH; MAT, Mean annual temperature; PS, Precipitation seasonality. ***, P < 0.001.
方差分解结果显示, 经度、群落特征(物种丰富度和群落盖度)、土壤和气候变量共同解释了植物群落LCBD 33.5%的空间变异(图5b), 且土壤、气候和群落特征对植物群落LCBD均有着极显著的单独解释率(P < 0.001)。其中, 经度和群落特征分别单独解释了植物群落LCBD 0.9%和3.7%的空间变异, 而降水季节性、土壤含水量等气候和土壤因素单独解释了23.1%的空间变异。此外, 不同环境因素的共同解释率仅0.8%, 经度与土壤、气候的共同解释率为2.8%, 土壤、气候和群落特征的共同解释率为2.2%。
3 讨论
3.1 温带荒漠植物群落生态特异性空间分布格局
在艾比湖流域荒漠的研究发现草本植物的SCBD显著高于乔木和灌木物种(Wang et al, 2022)。然而, 本研究发现小乔木和灌木物种的SCBD显著高于草本植物。这可能是两个研究区物种种库和群落结构存在差异导致的。艾比湖流域荒漠植物群落建群种主要为梭梭、盐穗木(Halostachys caspica)、盐爪爪(Kalidium foliatum)等小乔木和灌木植物, 在流域尺度上这些建群种优势度变化较小, 而草本植物沿着环境梯度物种优势度有着更大的变化, 因此该区域草本植物对群落beta多样性有着更强的影响(Wang et al, 2022)。先前有研究发现荒漠植物群落主要以温带荒漠灌木和半灌木群落为主, 灌木、半灌木、小灌木在群落中所占比例非常高, 草本植物在群落中占比相对比较有限(王健铭等, 2016)。由于本研究涉及到阿拉善高原、塔里木盆地、准噶尔盆地、天山南北山麓、吐哈盆地等多个区域, 不同区域间优势植物群落类型存在显著差异, 例如白梭梭(Haloxylon persicum)群落主要分布在新疆北部。因此, 研究区不同区域建群种存在显著差异, 诸如梭梭、红砂、膜果麻黄等小乔木和灌木植物在不同区域优势度差异显著。此外, 草本植物出现频度较低且整体上在群落中占比有限。因此, 小乔木和灌木植物SCBD在大尺度上对群落beta多样性贡献更大。
许多研究都发现群落LCBD存在着明显的空间异质性(Dubois et al, 2020; Yao et al, 2021; Dansereau et al, 2022)。本文发现温带荒漠植物群落LCBD在大尺度上同样也存在着显著的空间异质性。具体表现为植物群落LCBD随着经度增加呈显著降低, 随着纬度和海拔的增加都呈现先降低后增加的变化规律。干旱区植被分布与植物多样性大尺度分布格局的形成主要由水热条件驱动(O’Brien, 1998; Hawkins & Porter, 2004; Ulrich et al, 2014)。中国温带荒漠区气候为典型的大陆性气候, 主要受到干燥性的大陆高压气团影响(吴征镒, 1980), 同时受到天山、祁连山、阿尔金山、昆仑山等众多山脉地形起伏的影响, 导致研究区水热条件存在明显的空间异质性(附录3)。例如, 降水季节性随着经度增加而显著增大, 随着纬度和海拔增加呈现先增加后减少的变化规律。已有研究发现植物群落中稀有种占比对LCBD有着重要影响(Yao et al, 2021)。在本研究中稀有种占比与LCBD有着非常显著的相关性, LCBD随着稀有种占比增加线性递增(附录4)。同时, 群落中稀有种占比随着经度和纬度的增加呈现与LCBD相似的变化规律(附录5)。海拔虽然与稀有种比例没有显著的关系, 但降水季节性、土壤含水量等土壤和气候因素有着显著的海拔变化规律。因此, 海拔梯度可能通过影响水分和养分可利用性来影响群落水土特异性。综上所述, 经度、纬度和海拔梯度通过影响水分、养分、稀有种占比等群落特征因素异质性分布导致温带荒漠植物群落生态特异性呈现出非线性的空间分布格局。
3.2 温带荒漠植物群落生态特异性格局形成的主要驱动因素
众多研究证实群落生态特异性受到土壤含水量、土壤养分、气候、地形等众多环境因素的影响, 然而生态系统中这些因素的相对作用并不一致(Dubois et al, 2020; Yao et al, 2021; Dansereau et al, 2022)。Yao等(2021)发现土壤养分、地形、物种丰富度、物种多度等不同因素对热带山地森林、亚热带森林、暖温带和温带森林群落生态特异性的相对作用存在明显差异; 如土壤pH值仅对暖温带森林群落生态特异性有着显著作用, 而土壤有机质仅对亚热带森林群落生态特异性有显著作用。此外, Heino和Grönroos (2017)发现昆虫群落生态特异性与环境变量仅有着微弱的相关性。在本研究中, 土壤、气候和群落特征对荒漠植物群落生态特异性都有着显著的单独影响。值得注意的是, 前期研究发现土壤水分、pH值和物种丰富度解释了艾比湖流域荒漠植物群落生态特异性19.88%的空间变异(Wang et al, 2022), 但在本研究中土壤、气候和群落特征可以共同解释温带荒漠植物群落生态特异性32.6%的空间变异, 表明环境过滤对荒漠植物群落组成在大尺度上有着重要的影响。已有许多研究发现物种丰富度等群落特征因素可以更好地解释群落生态特异性的空间变异(Yao et al, 2021)。然而, 与这些研究结果不同, 本研究发现气候和土壤因素单独解释了群落生态特异性最多的空间变异(23.1%, P < 0.001), 远远大于物种丰富度和群落盖度(3.7%, P < 0.001)的单独解释率, 说明温带荒漠植物群落物种组成主要由土壤和气候因素的调控。
在环境因素中, 与水资源可利用性相关的气候因素已经被广泛证明主导着干旱区植物多样性地理分布格局的形成(Wang et al, 2019)。在中国西北干旱区, 先前有研究证实降水和温度类因子通过调控水资源可利用性来共同控制植物物种丰富度格局(李利平等, 2011)。本次调查也发现降水季节性对温带荒漠植物群落生态特异性空间变异有着最强的解释率, 表明温带荒漠植物群落物种组成的独特程度主要还是受到水资源可利用性季节变化的影响。先前已经有研究证实降水季节性对干旱区水资源供给有着强烈作用(Lauenroth et al, 2014)。降水季节性还可以通过与土壤因素相互作用来调控土壤水分可利用性, 从而影响植物群落组成(Dodd et al, 1998)。例如, 先前已有研究发现灌木物种盖度很大程度上取决于降水季节性(Cook & Irwin, 1992)。荒漠区夏季降水量最大, 一般占全年降水量的40%- 50%, 而冬季降水量非常有限(中国黑戈壁地区生态本底科学考察队, 2014)。本研究发现降水季节性与年均降水量呈显著正相关(附录1)。因此, 降水季节性高的区域夏季降水量更大, 生长季水资源可利用性更高, 许多常见的草本植物开始出现。相反, 降水季节性低的区域则夏季降水也非常有限, 干旱胁迫非常严重, 植物群落往往多以超旱生、旱生灌木为主, 导致群落物种组成比较独特。因此, 荒漠植物群落生态特异性受到降水季节性的强烈影响, 并随着降水季节性的增加而显著降低。
此外, 经度单独解释的部分可能代表了地质历史(Svenning & Skov, 2005)、扩散限制(Gilbert & Lechowicz, 2004)以及未测量的潜在因素(Smith & Lundholm, 2010)对物种多样性的作用。本研究发现经度仅单独解释群落生态学特异性0.9%的空间变异, 说明中性过程以及其他未知过程对温带荒漠植物群落生态特异性也有着重要作用。同时方差分解结果显示植物群落生态特异性还有很大比例的空间变异没有得到解释, 这表明生态漂变等随机过程(Legendre et al, 2009)、区域取样效应(Chase & Myers, 2011), 以及未测量的环境变量(Borcard et al, 2004)等对荒漠植物群落多样性形成也有着重要作用。例如, 先前研究证实深层土壤含水量、土壤砾石含量与养分、地下水位等环境因子对阿拉善荒漠植物群落物种多样性有着重要影响(李新荣等, 2009; Zhang et al, 2017)。因此, 方差分解结果说明其他没有引入的土壤、气候、人为活动、地形等因子对荒漠植物群落生态特异性有重要作用。未来我们应该在此研究的基础上, 进一步引入地形、土壤和人为干扰等因素, 深入探究其他未知过程的作用, 综合考虑其他生态过程的影响, 全面揭示中国温带荒漠区植物群落多样性的维持机制。
3.3 植物群落生态特异性与群落物种丰富度的非线性关系
除了土壤和气候因素, 本研究发现物种丰富度和群落盖度也可以单独影响群落生态特异性, 这与先前一些研究的结果一致(Dubois et al, 2020; Yao et al, 2021; Wang et al, 2022)。然而, 物种丰富度与群落生态特异性间可能存在着负相关、正相关和不相关等多种关系(Legendre & De Cáceres, 2013; Heino et al, 2017; da Silva et al, 2018)。本研究发现物种丰富度与群落生态特异性呈先下降后增加的二次曲线关系。此前, 有研究报道不同生态功能型植物对气候梯度变化的响应并不相同(代爽等, 2013)。本研究中, 物种丰富度在6-8的区间内时植物群落生态特异性最小; 在该区间的调查样点其平均降水量为120.69 mm, 中生植物开始进入群落, 导致群落中超旱生、旱生和中生植物共存(代爽等, 2013)。因此,物种丰富度介于6-8的植物群落与物种丰富度梯度两端的群落可能共同分布着许多相同的物种, 导致其群落组成的独特性最小。先前有研究证实物种丰富度与群落生态特异性的关系会受到群落中常见种和优势种比例的调控(da Silva et al, 2018)。当群落中物种数量在6种以内时, 往往整个群落内所有物种都是荒漠常见物种, 如红砂、霸王、沙拐枣和膜果麻黄组成的群落, 这些群落往往稀有种占比非常低。本研究也发现群落中稀有种占群落总物种数的比例和相对盖度都随着物种丰富度的增加呈现显著的先下降后增加的变化趋势, 且在6-8的区间内时最低(附录6)。因此, 当物种丰富度低于6时, 群落生态特异性与物种丰富度呈显著负相关(附录7a, P < 0.001)。当物种丰富度超过8以后, 群落中除了少数优势灌木物种外, 其余物种多为稀有物种, 此时物种丰富度与群落生态特异性呈显著正相关(附录7c, P < 0.001)。而处在丰富度6-8区间内的群落, 优势种和稀有种占群落总物种数的比例比大致相当, 物种丰富度与群落生态特异性没有显著的相关性(附录7b, P > 0.05)。因此, 植物物种丰富度与群落生态特异性在整体上呈先下降后上升的二次曲线关系。此外, 此前有研究表明植物功能多样性和系统发育多样性对群落生态特异性也有着重要影响(Wang et al, 2022), 但本研究并未针对不同维度植物多样性展开分析。未来可比较分析不同维度植物多样性的影响和作用机制, 从而更好地揭示荒漠植物群落生态特异性的影响因素。
附录 Supplementary Material
附录1 各个环境变量间的相关关系
Appendix 1 Relationships among different environmental variables
附录2 中国温带荒漠重要荒漠植物物种对beta多样性的贡献
Appendix 2 The dominant plant species contribution to beta diversity (SCBD) across the temperate deserts of China
附录3 中国温带荒漠环境因子与地理因子的相关性
Appendix 3 Relationship between geographical factors and environmental factors in the temperate deserts of China
附录4 植物群落生态特异性与稀有种占群落总物种数的比例和相对多度(相对盖度)的关系
Appendix 4 Relationships between the ecological uniqueness of plant communities and the proportion of rare species to the total number of species and relative abundance of rare species in the community
附录5 稀有种占群落总物种数的比例沿经度、纬度和海拔梯度的变化规律
Appendix 5 Trends of the proportion of rare species to the total number of species in the community along longitude, latitude and altitude gradients
附录6 稀有种占群落总物种数的比例和稀有种相对盖度随群落物种丰富度梯度的变化规律
Appendix 6 Trends of the proportion of rare species to the total number of species and relative abundance of rare species in the community along plants species richness gradients
附录7 不同物种丰富度梯度上物种丰富度与群落生态特异性的关系
Appendix 7 Relationships between species richness and the ecological uniqueness of plant communities across different species richness gradients
参考文献
Navigating the multiple meanings of β diversity: A roadmap for the practicing ecologist
DOI:10.1111/j.1461-0248.2010.01552.x
PMID:21070562
[本文引用: 1]

A recent increase in studies of β diversity has yielded a confusing array of concepts, measures and methods. Here, we provide a roadmap of the most widely used and ecologically relevant approaches for analysis through a series of mission statements. We distinguish two types of β diversity: directional turnover along a gradient vs. non-directional variation. Different measures emphasize different properties of ecological data. Such properties include the degree of emphasis on presence/absence vs. relative abundance information and the inclusion vs. exclusion of joint absences. Judicious use of multiple measures in concert can uncover the underlying nature of patterns in β diversity for a given dataset. A case study of Indonesian coral assemblages shows the utility of a multi-faceted approach. We advocate careful consideration of relevant questions, matched by appropriate analyses. The rigorous application of null models will also help to reveal potential processes driving observed patterns in β diversity.© 2010 Blackwell Publishing Ltd/CNRS.
Dissecting the spatial structure of ecological data at multiple scales
DOI:10.1890/03-3111 URL [本文引用: 1]
Multimodel inference: Understanding AIC and BIC in model selection
Disentangling the importance of ecological niches from stochastic processes across scales
DOI:10.1098/rstb.2011.0063
URL
[本文引用: 1]
Deterministic theories in community ecology suggest that local, niche-based processes, such as environmental filtering, biotic interactions and interspecific trade-offs largely determine patterns of species diversity and composition. In contrast, more stochastic theories emphasize the importance of chance colonization, random extinction and ecological drift. The schisms between deterministic and stochastic perspectives, which date back to the earliest days of ecology, continue to fuel contemporary debates (e.g. niches versus neutrality). As illustrated by the pioneering studies of Robert H. MacArthur and co-workers, resolution to these debates requires consideration of how the importance of local processes changes across scales. Here, we develop a framework for disentangling the relative importance of deterministic and stochastic processes in generating site-to-site variation in species composition (β-diversity) along ecological gradients (disturbance, productivity and biotic interactions) and among biogeographic regions that differ in the size of the regional species pool. We illustrate how to discern the importance of deterministic processes using null-model approaches that explicitly account for local and regional factors that inherently create stochastic turnover. By embracing processes across scales, we can build a more synthetic framework for understanding how niches structure patterns of biodiversity in the face of stochastic processes that emerge from local and biogeographic factors.
A review of beta diversity studies
DOI:10.3724/SP.J.1003.2010.323
[本文引用: 1]
<p>Beta diversity is an important component of biological diversity, measuring compositional change in species assemblages across temporal and spatial scales. Beta diversity concerns not only a number of ecological and evolutionary issues, but can also guide the selection of protected areas and help to optimize conservation networks. It has thus become a hot topic in biodiversity research in recent years. Researchers have used various measures and analytical methods to investigate patterns of beta diversity and its underlying mechanisms for various taxa and in different regions. Here, we reviewed literature from the past decade pertaining to the following aspects of beta diversity: metrics, temporal and spatial patterns, determinants and applications in biodiversity conservation. Whittaker introduced the term beta diversity in 1960, but defined it vaguely. As the concept of beta diversity evolved, a high variety of measures were developed to quantify the concept. The comparison of results from different studies may be hindered by the variety of measures used to quantify beta diversity. Presently, the most popular methods for measuring beta diversity are similarity/ dissimilarity coefficients such as Jaccard index and Sørensen index. In the last few years, several methods to quantify beta diversity have emerged, some of which are worth noting. Beta diversity depends on temporal scale, spatial scale and taxonomic scale, and decreases with increasing analytical grain size. There is no consensus among scientists that beta diversity decreases with latitude, i.e. that it is higher in tropics and lower near the poles. Beta diversity is high within mountain ranges and at the interface of biogeographic realms; thus, larger/more reserves are needed in these regions to cover the entire gradient of species turnover. Studies on beta diversity across temporal scales have shown that climatic change has resulted in shifts in species composition through time, and that the migration of species between different continents/regions has led to biotic homogenization. Based on a thorough review of beta diversity literature, we think the following questions might be the focus of future research: (1) the influence of evolutionary history and biological characteristics of different taxonomic groups on their beta diversity; (2) the influence of temporal/spatial scales on beta diversity and its determinants; and (3) the effect of anthropogenic activities on beta diversity.</p>
Beta多样性研究进展
DOI:10.3724/SP.J.1003.2010.323
[本文引用: 1]
Beta多样性度量时空尺度上物种组成的变化, 是生物多样性的重要组成部分, 与许多生态学和进化生物学问题密切相关, 并且其信息可用于保护区选址和布局规划, 因此在最近10年间成为生物多样性研究的热点问题之一。多年来, 学者们利用各种度量方式和分析方法, 在不同地理区域, 对许多生物类群beta多样性的时空格局和形成机制进行了大量研究。本文主要从beta多样性的度量方法、时空格局、形成机制及其在生物多样性保护中的应用等几个方面, 总结了最近10多年来相关研究的进展。Whittaker(1960)最初提出beta多样性概念时就缺乏严格的定义, 随着概念的不断演化, 度量方法也同样呈现出多样化, 而度量手段的多样化非常不利于不同研究之间的比较。目前应用最普遍的度量方法是采用相似性指数, 如Jaccard和Sørensen指数。最近几年, 新的度量方法还在不断出现, 其中一些方法非常值得注意。Beta多样性具有时空尺度和分类尺度依赖性, 一般随分析粒度(grain)的增加而降低。虽然有些研究表明beta多样性随纬度增加而降低, 但学者们并没有达成共识。山区和生物地理区的交界处beta多样性都比较高, 因而需要在这些地区增加保护区的面积或者数量以囊括物种变化梯度。对时间尺度上beta多样性的研究表明, 气候变化确实导致了物种组成在时间上的变化, 并且物种在不同大陆和地区间的迁移导致了生物同质化。扩散过程和生态位过程共同决定了beta多样性, 只是这两个过程的相对重要性依尺度、地理区域和物种类群的不同而有所差异。综上所述, 我们认为未来beta多样性研究的热点问题是:(1)不同生物类群的进化历史和生物学特征对beta多样性的影响; (2)不同的时空尺度对beta多样性及其维持机制的影响; (3)人类活动对beta多样性的影响。
Climate-vegetation relationships between the Great Plains and Great Basin
DOI:10.2307/2426538 URL [本文引用: 1]
Disentangling the correlates of species and site contributions to beta diversity in dung beetle assemblages
DOI:10.1111/ddi.2018.24.issue-11 URL [本文引用: 6]
Relationship between shrub species richness and climate across central Inner Mongolia, China
内蒙古灌木群落物种丰富度与气候的关系
Evaluating ecological uniqueness over broad spatial extents using species distribution modelling
Wetting trend in Northwest China reversed by warmer temperature and drier air
DOI:10.1016/j.jhydrol.2022.128435 URL [本文引用: 1]
Differential water resource use by herbaceous and woody plant life-forms in a shortgrass steppe community
DOI:10.1007/s004420050686
PMID:28307675
[本文引用: 1]
We conducted a study to test the predictions of Walter's two-layer model in the shortgrass steppe of northeastern Colorado. The model suggests that grasses and woody plants use water resources from different layers of the soil profile. Four plant removal treatments were applied in the spring of 1996 within a plant community codominated by Atriplex canescens (a C shrub) and Bouteloua gracilis (a C grass). During the subsequent growing season, soil water content was monitored to a depth of 180 cm. In addition, stem and leaf tissue of Atriplex, Bouteloua and the streamside tree Populus sargentii were collected monthly during the growing seasons of 1995 and 1996 for analysis of the δO value of plant stem water (for comparison with potential water sources) and the δC value of leaves (as an indicator of plant water status). Selective removal of shrubs did not significantly increase water storage at any depth in the measured soil profile. Selective removal of the herbaceous understory (mainly grasses) increased water storage in the top 60 cm of the soil. Some of this water gradually percolated to lower layers, where it was utilized by the shrubs. Based on stem water δO values, grasses were exclusively using spring and summer rain extracted from the uppermost soil layers. In contrast, trees were exclusively using groundwater, and the consistent δC values of tree leaves over the course of the summer indicated no seasonal changes in gas exchange and therefore minimal water stress in this life-form. Based on anecdotal rooting-depth information and initial measurements of stem water δO, shrubs may have also had access to groundwater. However, their overall δO values indicated that they mainly used water from spring and summer precipitation events, extracted from subsurface soil layers. These findings indicate that the diversity of life-forms found in this shortgrass steppe community may be a function of the spatial partitioning of soil water resources, and their differential use by grasses, shrubs, and trees. Consequently, our findings support the two-layer model in a broad sense, but indicate a relatively flexible strategy of water acquisition by shrubs.
Ecological uniqueness of plant communities as a conservation criterion in lake-edge wetlands
DOI:10.1016/j.biocon.2020.108491 URL [本文引用: 5]
Methods and protocols for plant community inventory
DOI:10.3724/SP.J.1003.2009.09253
[本文引用: 1]
A plant community is an assemblage of plant populations that live in certain area, and interact with and adapt to one another in the context of long-term environmental changes. Plant communities maintain global ecosystem functions, and provide food and habitats for animals and other organisms. Plant communities also provide primary resources for human survival and development, and are therefore indispensable to human societies. China is among the countries with the most diverse plant communities in the world. However, no systematic national inventory has been conducted for Chinese plant communities. This fact obstructs exploitation and protection of China’s plant resources, and also hampers the development of the fields of Chinese ecology and geography. There is an urgent need to survey Chinese plant communities using consis-tent methods and protocols. In this paper, we review major concepts in plant community ecology, and pro-pose a framework for developing plant community inventories based on recent progress in community ecol-ogy and our own experience with long-term field surveys. Our framework provides protocols for site selec-tion and plot design, items to be measured in a plot, and measurements of functional traits of dominant spe-cies. We also review protocols for field surveys of large, long-term plots. The protocols proposed in this pa-per are expected to be a base for standardizing methodology for inventory of Chinese plant communities.
植物群落清查的主要内容、方法和技术规范
DOI:10.3724/SP.J.1003.2009.09253
[本文引用: 1]
植物群落是不同植物在长期环境变化中相互作用、相互适应而形成的组合。它提供着人类赖以生存的主要物质资源, 维系着地球生态系统的健康和功能, 也为各种动物和其他生物提供食物来源和栖息地, 是人类生存和发展不可或缺的物质基础, 具有不可替代的作用。我国植物群落类型多样, 在世界上首屈一指, 但我国至今尚没有一次全面和系统的植物群落清查, 不仅影响了人们对我国植物资源的了解、利用和保护, 也不利于我国生态学、环境科学和地理学等相关学科的发展。采用统一的方法体系和技术规范开展我国植物群落的清查工作势在必行, 并具有紧迫性。本文基于作者长期的野外工作实践和国内外的群落调查方法, 首先简要定义了与植物群落清查有关的重要概念, 在此基础上, 论述了调查样地的设置原则和体系、群落清查的技术指标和方法、主要优势种生态属性的测定方法和规范, 并介绍了大样地调查的主要步骤。通过本文的介绍、归纳和总结, 试图为制定我国植物群落清查的技术规范提供基础材料和技术储备。
Global patterns in biodiversity
DOI:10.1038/35012228 [本文引用: 1]
Neutrality, niches, and dispersal in a temperate forest understory
Water-energy balance and the geographic pattern of species richness of western Palearctic butterflies
DOI:10.1111/een.2003.28.issue-6 URL [本文引用: 1]
Exploring species and site contributions to beta diversity in stream insect assemblages
DOI:10.1007/s00442-016-3754-7
PMID:27743166
[本文引用: 2]
It was recently suggested that beta diversity can be partitioned into contributions of single sites to overall beta diversity (LCBD) or into contributions of individual species to overall beta diversity (SCBD). We explored the relationships of LCBD and SCBD to site and species characteristics, respectively, in stream insect assemblages. We found that LCBD was mostly explained by variation in species richness, with a negative relationship being detected. SCBD was strongly related to various species characteristics, such as occupancy, abundance, niche position and niche breadth, but was only weakly related to biological traits of species. In particular, occupancy and its quadratic terms showed a very strong unimodal relationship with SCBD, suggesting that intermediate species in terms of site occupancy contribute most to beta diversity. Our findings of unravelling the contributions of sites or species to overall beta diversity are of high importance to community ecology, conservation and bioassessment using stream insect assemblages, and may bear some overall generalities to be found in other organism groups.
Unravelling the correlates of species richness and ecological uniqueness in a metacommunity of urban pond insects
DOI:10.1016/j.ecolind.2016.10.006 URL [本文引用: 1]
Exploring the distribution patterns and conservation approaches of biodiversity on the Qinghai- Tibetan Plateau
DOI:10.17520/biods.2018064 URL [本文引用: 1]
探索青藏高原生物多样性分布格局与保育途径
DOI:10.17520/biods.2018064 [本文引用: 1]
Ecohydrology of dry regions: Storage versus pulse soil water dynamics
DOI:10.1007/s10021-014-9808-y URL [本文引用: 1]
Testing the environmental filtering concept in global drylands
DOI:10.1111/1365-2745.12735
PMID:28642625
[本文引用: 1]
1. The environmental filtering hypothesis predicts that the abiotic environment selects species with similar trait values within communities. Testing this hypothesis along multiple - and interacting - gradients of climate and soil variables constitutes a great opportunity to better understand and predict the responses of plant communities to ongoing environmental changes. 2. Based on two key plant traits, maximum plant height and specific leaf area (SLA), we assessed the filtering effects of climate (mean annual temperature and precipitation, precipitation seasonality), soil characteristics (soil pH, sand content and total phosphorus) and all potential interactions on the functional structure and diversity of 124 dryland communities spread over the globe. The functional structure and diversity of dryland communities were quantified using the mean, variance, skewness and kurtosis of plant trait distributions. 3. The models accurately explained the observed variations in functional trait diversity across the 124 communities studied. All models included interactions among factors, i.e. climate - climate (9% of explanatory power), climate - soil (24% of explanatory power) and soil - soil interactions (5% of explanatory power). Precipitation seasonality was the main driver of maximum plant height, and interacted with mean annual temperature and precipitation. Soil pH mediated the filtering effects of climate and sand content on SLA. Our results also revealed that communities characterized by a low variance can also exhibit low kurtosis values, indicating that functionally contrasting species can co-occur even in communities with narrow ranges of trait values. 4. We identified the particular set of conditions under which the environmental filtering hypothesis operates in drylands worldwide. Our findings also indicate that species with functionally contrasting strategies can still co-occur locally, even under prevailing environmental filtering. Interactions between sources of environmental stress should be therefore included in global trait-based studies, as this will help to further anticipate where the effects of environmental filtering will impact plant trait diversity under climate change.
Beta diversity as the variance of community data: Dissimilarity coefficients and partitioning
DOI:10.1111/ele.12141
PMID:23809147
[本文引用: 5]
Beta diversity can be measured in different ways. Among these, the total variance of the community data table Y can be used as an estimate of beta diversity. We show how the total variance of Y can be calculated either directly or through a dissimilarity matrix obtained using any dissimilarity index deemed appropriate for pairwise comparisons of community composition data. We addressed the question of which index to use by coding 16 indices using 14 properties that are necessary for beta assessment, comparability among data sets, sampling issues and ordination. Our comparison analysis classified the coefficients under study into five types, three of which are appropriate for beta diversity assessment. Our approach links the concept of beta diversity with the analysis of community data by commonly used methods like ordination and anova. Total beta can be partitioned into Species Contributions (SCBD: degree of variation of individual species across the study area) and Local Contributions (LCBD: comparative indicators of the ecological uniqueness of the sites) to Beta Diversity. Moreover, total beta can be broken up into within- and among-group components by manova, into orthogonal axes by ordination, into spatial scales by eigenfunction analysis or among explanatory data sets by variation partitioning. © 2013 John Wiley & Sons Ltd/CNRS.
Partitioning beta diversity in a subtropical broad-leaved forest of China
DOI:10.1890/07-1880.1
PMID:19341137
[本文引用: 2]
The classical environmental control model assumes that species distribution is determined by the spatial variation of underlying habitat conditions. This niche-based model has recently been challenged by the neutral theory of biodiversity which assumes that ecological drift is a key process regulating species coexistence. Understanding the mechanisms that maintain biodiversity in communities critically depends on our ability to decompose the variation of diversity into the contributions of different processes affecting it. Here we investigated the effects of pure habitat, pure spatial, and spatially structured habitat processes on the distributions of species richness and species composition in a recently established 24-ha stem-mapping plot in the subtropical evergreen broad-leaved forest of Gutianshan National Nature Reserve in East China. We used the new spatial analysis method of principal coordinates of neighbor matrices (PCNM) to disentangle the contributions of these processes. The results showed that (1) habitat and space jointly explained approximately 53% of the variation in richness and approximately 65% of the variation in species composition, depending on the scale (sampling unit size); (2) tree diversity (richness and composition) in the Gutianshan forest was dominantly controlled by spatially structured habitat (24%) and habitat-independent spatial component (29%); the spatially independent habitat contributed a negligible effect (6%); (3) distributions of richness and species composition were strongly affected by altitude and terrain convexity, while the effects of slope and aspect were weak; (4) the spatial distribution of diversity in the forest was dominated by broad-scaled spatial variation; (5) environmental control on the one hand and unexplained spatial variation on the other (unmeasured environmental variables and neutral processes) corresponded to spatial structures with different scales in the Gutianshan forest plot; and (6) five habitat types were recognized; a few species were statistically significant indicators of three of these habitats, whereas two habitats had no significant indicator species. The results suggest that the diversity of the forest is equally governed by environmental control (30%) and neutral processes (29%). In the fine-scale analysis (10 x 10 m cells), neutral processes dominated (43%) over environmental control (20%).
Why does the temperature rise faster in the arid region of Northwest China?
Distribution patterns and climatic explanations of species richness of vascular plants in Xinjiang, China
DOI:10.3724/SP.J.1148.2011.00025 URL [本文引用: 1]
新疆野生维管束植物物种丰富度分布格局的水热解释
The response of shrub species richness and abundance patterns to environmental change in Alxa Plateau: The premise of shrubs diversity conservation in extremely arid gobi regions
阿拉善高原灌木种的丰富度和多度格局对环境因子变化的响应: 极端干旱戈壁地区灌木多样性保育的前提
Beta-diversity in temperate and tropical forests reflects dissimilar mechanisms of community assembly
DOI:10.1111/ele.12021
PMID:23113954
[本文引用: 1]
Site-to-site variation in species composition (β-diversity) generally increases from low- to high-diversity regions. Although biogeographical differences in community assembly mechanisms may explain this pattern, random sampling effects can create this pattern through differences in regional species pools. Here, we compared assembly mechanisms between spatially extensive networks of temperate and tropical forest plots with highly divergent species pools (46 vs. 607 species). After controlling for sampling effects, β-diversity of woody plants was similar and higher than expected by chance in both forests, reflecting strong intraspecific aggregation. However, different mechanisms appeared to explain aggregation in the two forests. In the temperate forest, aggregation reflected stronger environmental correlations, suggesting an important role for species-sorting (e.g. environmental filtering) processes, whereas in the tropics, aggregation reflected stronger spatial correlations, more likely reflecting dispersal limitation. We suggest that biogeographical differences in the relative importance of different community assembly mechanisms contribute to these striking gradients in global biodiversity.© 2012 Blackwell Publishing Ltd/CNRS.
Water-energy dynamics, climate, and prediction of woody plant species richness: An interim general model
DOI:10.1046/j.1365-2699.1998.252166.x
URL
[本文引用: 1]
Predictable geographic patterns in the distribution of species richness, especially the latitudinal gradient, are intriguing because they suggest that if we knew what the controlling factors were we could predict species richness where empirical data is lacking (e.g. tropics). Based on analyses of the macro‐scale distribution of woody plant species richness in Southern Africa, one controlling factor appears to be climate‐based water‐energy dynamics. Using the regression models of climate's relationship to species richness in Southern Africa, I was able to describe an Interim General Model (IGM) and to predict first‐order macro‐scale geographic variations in woody plant species richness for the continent of Africa, as well as elsewhere in the world—exemplified using South America, the United States and China.
Beta diversity determinants in Badagongshan, a subtropical forest in Central China
DOI:10.1038/srep17043
PMID:26594051
[本文引用: 2]
Niche and neutral theories emphasize different processes contributing to the maintenance of species diversity. In this study, we calculated the local contribution to beta diversity (LCBD) of every cell, using variation partitioning in combination with spatial distance and environmental variables of the 25-ha Badagongshan plot (BDGS), to determine the contribution of environmentally-related variation versus pure spatial variation. We used topography and soil characteristics as environmental variables, distance-based Moran's eigenvectors maps (dbMEM) to describe spatial relationships among cells and redundancy analysis (RDA) to apportion the variation in beta diversity into three components: pure environmental, spatially-structured environmental, and pure spatial. Results showed LCBD values were negatively related to number of common species and positively related to number of rare species. Environment and space jointly explained similar to 60% of the variation in species composition; soil variables alone explained 21.6%, slightly more than the topographic variables that explained 15.7%; topography and soil together explained 27%, slightly inferior to spatial variables that explained 34%. The BDGS forest was controlled both by the spatial and environmental variables, and the results were consistent across different life forms and life stages.
Variation partitioning as a tool to distinguish between niche and neutral processes
DOI:10.1111/eco.2010.33.issue-4 URL [本文引用: 1]
Uniqueness of sampling site contributions to the total variance of macroinvertebrate communities in the Lower Mekong basin
DOI:10.1016/j.ecolind.2017.08.038 URL [本文引用: 3]
The relative roles of environment and history as controls of tree species composition and richness in Europe
DOI:10.1111/jbi.2005.32.issue-6 URL [本文引用: 1]
Climate and soil attributes determine plant species turnover in global drylands
DOI:10.1111/jbi.12377
PMID:25914437
[本文引用: 1]
Geographic, climatic, and soil factors are major drivers of plant beta diversity, but their importance for dryland plant communities is poorly known. This study aims to: i) characterize patterns of beta diversity in global drylands, ii) detect common environmental drivers of beta diversity, and iii) test for thresholds in environmental conditions driving potential shifts in plant species composition.224 sites in diverse dryland plant communities from 22 geographical regions in six continents.Beta diversity was quantified with four complementary measures: the percentage of singletons (species occurring at only one site), Whittake's beta diversity (β(W)), a directional beta diversity metric based on the correlation in species occurrences among spatially contiguous sites (β(R)), and a multivariate abundance-based metric (β(MV)). We used linear modelling to quantify the relationships between these metrics of beta diversity and geographic, climatic, and soil variables.Soil fertility and variability in temperature and rainfall, and to a lesser extent latitude, were the most important environmental predictors of beta diversity. Metrics related to species identity (percentage of singletons and β(W)) were most sensitive to soil fertility, whereas those metrics related to environmental gradients and abundance ((β(R)) and β(MV)) were more associated with climate variability. Interactions among soil variables, climatic factors, and plant cover were not important determinants of beta diversity. Sites receiving less than 178 mm of annual rainfall differed sharply in species composition from more mesic sites (> 200 mm).Soil fertility and variability in temperature and rainfall are the most important environmental predictors of variation in plant beta diversity in global drylands. Our results suggest that those sites annually receiving ~ 178 mm of rainfall will be especially sensitive to future climate changes. These findings may help to define appropriate conservation strategies for mitigating effects of climate change on dryland vegetation.
Ecological uniqueness of stream and lake diatom communities shows different macroecological patterns
DOI:10.1111/ddi.2017.23.issue-9 URL [本文引用: 1]
Ecological uniqueness and the determinants in arid desert ecosystems of Northwest China
DOI:10.1016/j.gecco.2022.e02005 URL [本文引用: 8]
Plant distribution patterns and the factors influencing plant diversity in the Black Gobi Desert of China
中国黑戈壁植物多样性分布格局及其影响因素
Different ecological processes determined the alpha and beta components of taxonomic, functional, and phylogenetic diversity for plant communities in dryland regions of Northwest China
Relative role of contemporary environment versus history in shaping diversity patterns of China’s woody plants
DOI:10.1111/ecog.2012.35.issue-12 URL [本文引用: 1]
Vegetation of the Siskiyou Mountains, Oregon and California
DOI:10.2307/1943563 URL [本文引用: 1]
Plant species diversity and floral characters in the Black Gobi Desert of China
中国黑戈壁地区植物区系及其物种多样性研究
Phylogenetic structure of desert shrub community in Qaidam Basin
柴达木盆地荒漠灌丛群落谱系结构研究
Ecological uniqueness of species assemblages and their determinants in forest communities
DOI:10.1111/ddi.v27.3 URL [本文引用: 14]
Spatial pattern of plant species diversity and the influencing factors in a gobi desert within the Heihe River Basin, Northwest China
DOI:10.1007/s40333-017-0056-9
[本文引用: 1]
Understanding the spatial pattern of plant species diversity and the influencing factors has important implications for the conservation and management of ecosystem biodiversity. The transitional zone between biomes in desert ecosystems, however, has received little attention in that regard. In this study, we conducted a quantitative field survey (including 187 sampling plots) in a 40-km2 study area to determine the spatial pattern of plant species diversity and analyze the influencing factors in a Gobi Desert within the Heihe River Basin, Northwest China. A total of 42 plant species belonging to 16 families and 39 genera were recorded. Shrub and semi-shrub species generally represented the major part of the plant communities (covering 90% of the land surface), while annual and perennial herbaceous species occupied a large proportion of the total recorded species (71%). Patrick richness index (R), Shannon-Wiener diversity index (H'), Simpson’s dominance index (D), and Pielou’s evenness index (J) were all moderately spatially variable, and the variability increased with increasing sampling area. The semivariograms for R and H' were best fitted with Gaussian models while the semivariograms for D and J were best fitted with exponential models. Nugget-to-still ratios indicated a moderate spatial autocorrelation for R, H', and D while a strong spatial autocorrelation was observed for J. The spatial patterns of R and H' were closely related to the geographic location within the study area, with lower values near the oasis and higher values near the mountains. However, there was an opposite trend for D. R, H', and D were significantly correlated with elevation, soil texture, bulk density, saturated hydraulic conductivity, and total porosity (P<0.05). Generally speaking, locations at higher elevations tended to have higher species richness and diversity and the higher elevations were characterized by higher values in sand and gravel contents, bulk density, and saturated hydraulic conductivity and also by lower values in total porosity. Furthermore, spatial variability of plant species diversity was dependent on the sampling area.
Composition of seed plant species and floristic features in the gobi area of the northern Qinghai-Tibet Plateau of China
中国青藏高原北部戈壁区种子植物物种组成及其区系特征
