


声音中蕴涵着大量有效信息, 生物声音在个体识别、领地防御、吸引配偶以及维持社会群落等方面发挥着重要作用(Rodrigues, 1996; Wilkins et al, 2013)。通过采集分析环境中发声动物的声音特征来评估生物多样性, 是近年来生物声学监测研究的热点之一。鸟类是生态系统的重要组成部分并发挥着巨大作用(徐诗等, 2021), 常作为评估生态系统状态的指示物种。传统的鸟类调查包括网捕法、样线法、样点法、标图法等(蔡音亭等, 2010)。其中样点法和样线法是最常见的, 但都要求经验丰富的观察者能够现场准确识别调查区域内的鸟类, 受人为因素影响较大, 需要在白天进行工作且监测次数有限(张倩雯等, 2018; 游海林等, 2021)。不能保证多点观测的同步性, 更难以实现同一地点昼夜、全年的连续监测。
与传统方法相比, 鸟类声学监测可以很好地弥补这些不足, 近年来被广泛用于鸟类群落的研究、保护和监测中(Shonfield & Bayne, 2017)。这种方法降低了观察者的技术要求门槛, 现场录音后可提取音频反复进行鉴定, 减少了观察者的偏差(Gibb et al, 2019)。随着科技水平的进步, 野外录音设备也更加高效便携, 支持在更大范围内同时工作, 减少因采样时间不同带来的误差。此外, 连续的录音能够获得完整的昼夜记录和动态变化。这种方法不侵入、不破坏自然环境(Sugai et al, 2019), 最大限度地削弱了人为干扰对动植物的影响。收集到的音频文件能够长久保存, 可以作为跟踪鸟类群落分布和随时间变化的重要数据来源(Lees et al, 2014; Wheeldon et al, 2019)。因此, 生物声学监测的方法得到越来越多的关注。
声学监测通常使用以下两种方式来分析量化声音数据, 第一种需要对音频进行物种识别, 包括人工识别和自动分类识别。人工识别即通过回放录音进行监听, 并采用频谱图辅助鉴别的方式来提取有用的生物信息。研究人员通过对比鸟类直接观测和监听识别结果来验证声学监测的有效性。有研究表明声学方法能够检测到更多的鸟类, 对物种丰富度的评估要优于传统观测, 并且在不同能见度、不同类型的生境中都有相似的结果(Wheeldon et al, 2019)。然而在亚热带雨林的鸟类调查则有所不同, 因为在现场观测中记录到较多“安静”的鸟类, 使得点计数检测到的物种明显多于声音记录(Leach et al, 2016)。人工识别非常耗时而且处理的数据量十分有限, 为了应对大数据的存储和分析, 声音自动分类识别技术快速发展。它通过机器学习对获得的音频进行分类训练, 并根据训练模板进行匹配, 鉴别出具体的鸟种(Qian et al, 2015)。该方法省时但适用范围相对局限, 需要大量准备工作提供充足且具有代表性的学习样本。现阶段的技术易受到环境中背景噪音的干扰, 导致错误率增加, 需要对音频进行准确分类和降噪处理(Stowell et al, 2019)。
第二种方式是通过计算声学指数来评估特定区域的生物多样性。声学指数能够反映固定时长的数字音频中声波能量在时间或频率上的分布特征(Eldridge et al, 2018)。它建立在发声物种丰富度越高, 环境中的生物声越复杂的假设上。声学指数的关注重点从个体和物种水平转向声学群落, 不进行物种识别而是快速反映特定环境中的声音多样性(Sueur et al, 2014)。关于声学指数评估鸟类多样性的研究多在原始森林或热带雨林中展开。研究表明在热带景观中声学复杂度指数和声学多样性指数与鸟类丰富度相关(Machado et al, 2017; Mitchell et al, 2020)。通过声学指数对环境中声音的时空变化进行分析, 也能够获得鸟类和昆虫等动物的行为活动和物候特征(Rodriguez et al, 2014)。尽管大部分研究显示在森林生境中声学指数能够有效地评估鸟类多样性(Bradfer-Lawrence et al, 2020), 但城市复杂环境中的人为干扰可能会导致结论发生变化。例如分析城市环境中的生物声音时, 与人类有关的噪音可能导致潜在的假阳性和评价结果的偏差(Brumm et al, 2017; Fairbrass et al, 2017)。因此声学指数在城市森林公园中的应用仍有很大不确定性, 需要进行更多的研究验证其适用性。
本研究在人为干扰较强的城市森林中进行鸟类观测和同步声学监测, 尝试用声学指数快速评估鸟类多样性, 以期为声学监测在城市森林生态中的应用提供新的思路, 不断丰富和完善城市森林鸟类多样性的调查方法。我们关注以下3个问题: (1)通过回放现场录音识别鸣声能否获得与直接观测相似的鸟类调查结果? 两种方法的优缺点怎样? (2)不同月份间声学指数与鸟类丰富度和多度的相关性怎样? (3)在人为干扰较强的城市森林中, 声学指数能否有效地评估鸟类丰富度和多度?
1 研究方法
1.1 研究区概况
东郊森林公园位于北京通州、顺义、朝阳三区交界带, 是北京城市总体规划中东部郊野公园群的主要组成部分。观测区位于东郊森林公园中心位置的华北树木园(39°57' -39°59' N, 116°39'-116°40' E, 图1), 规划总占地约526 ha。华北树木园以徐尹路为界分为南北两个园区, 北园管护程度较高, 定期进行除草剪枝、更换地被草花等园林绿化措施。南园近自然程度较高, 管理相对粗放。
图1
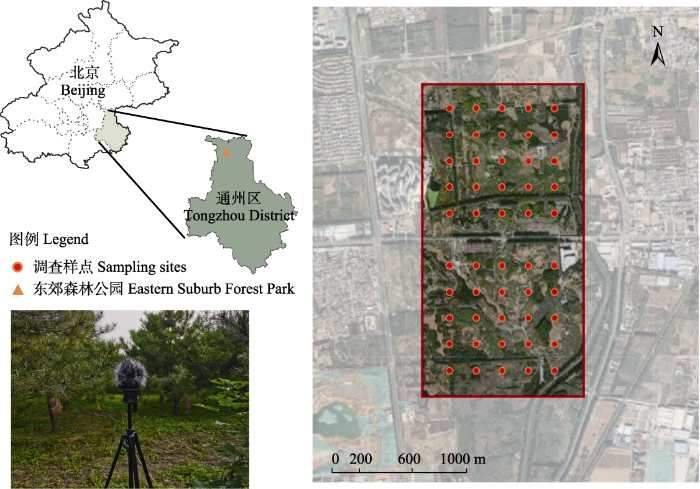
图1
东郊森林公园研究区域(华北树木园)与样点分布
Fig. 1
Research area (North China Arboretum) and sampling sites distribution in Eastern Suburb Forest Park
1.2 样点设计
1.3 鸟类调查
鸟类的繁殖具有季节性, 大多数鸟类在繁殖季节的叫声婉转响亮(韩宗先, 2001), 能够为声学监听识别提供可靠的信息来源。结合北京地区物候特征, 于2021年4-6月选择晴朗无风的工作日进行鸟类调查, 具体调查日期为4月23-24日、5月24-25日、6月18-19日。采用固定半径样点法, 在鸟类活跃时间段(7:00-11:00和16:00-18:00)观察记录出现在样点周围50 m范围内鸟的种类、数量和活动情况。观察员到达样点后先静止5 min后再进行观测, 每个样点观测5 min。所有调查均由同一位观察员完成, 调查之前需进行系统学习和培训, 以提高鸟类的识别技能并控制系统误差(杨刚等, 2015)。通过调查获得鸟类丰富度(即鸟类物种数)及多度(即鸟类个体数量)。
1.4 声音采集与处理
鸟类鸣声采集与观测调查同步进行, 该过程可以清晰全面地记录每个调查样点内的声音情况。本研究选用Zoom H5型号的录音设备, 搭配XYH-5X/Y全向麦克风收集样点内的声音数据, 声音采样位为16 bit, 采样率为44.1 kHz, 立体声采样, 音频格式为WAV。将录音设备安装在三脚架上, 并保持距离地面约1.5 m。Hao等(2021)研究表明Zoom H5的收音范围主要受麦克风的影响, 当距声源40 m时收集到的声音信号明显减弱, 50 m时声音信号几乎难以辨别。结合预实验结果, 调节麦克风增益以保证声音采样范围(50 m)与鸟类观测范围相匹配。对获得的音频进行监听识别, 通过Adobe Audition软件获得音频的频谱图以辅助检测和识别鸟种。
迄今为止, 研究人员已开发了60多个声学参数, 反映了声音在景观中的独特贡献(Bradfer-Lawrence et al, 2019)。本文选择了6个在生态声学研究中使用频繁并得到初步验证的指数, 即声熵指数(acoustic entropy index, H, Sueur et al, 2008)、声学复杂度指数(acoustic complexity index, ACI, Pieretti et al, 2011)、声学多样性指数(acoustic diversity index, ADI, Villanueva-Rivera et al, 2011)、声学均匀度指数(acoustic evenness index, AEI)、生物声学指数(bioacoustic index, BIO, Boelman et al, 2007)和标准化声景差异指数(normalized difference sound index, NDSI, Kasten et al, 2012)。利用“Seewave”和“Soundscape”软件包对这6个声学指数进行计算, 详见表1。
表1 本研究使用的6个声学指数介绍
Table 1
| 声学指数 Acoustic indices | 详细信息 Details | 参考文献 Reference |
|---|---|---|
| 声熵指数 Acoustic entropy index (H) | 将音频划分为多个频段, 使用Shannon指数来计算时间熵(Ht)和频谱熵(Hf), 两者相乘得到声熵指数, 体现声学信号在时域和频域上的复杂度。The audio is divided into multiple frequency bands and the Shannon index is used to calculate the temporal entropy (Ht) and spectral entropy (Hf), which are multiplied to obtain the acoustic entropy index, reflecting the complexity of the acoustic signal in the time and frequency domains. | Sueur et al, 2008 |
| 声学复杂度指数 Acoustic complexity index (ACI) | 该指数用于测量相邻频率带之间振幅的变化, 反映声强的可变性和不规律性, 特别是鸟鸣声。该指数相对不受恒定强度或持续声音的影响。本研究中使用以下参数计算: min_freq = 2000, max_freq = 11000, j = 5, fft_w = 512。This index is used to measure changes in amplitude between adjacent frequency bands, reflecting the variability and irregularity of sound intensity, especially bird calls. The index is relatively unaffected by a constant intensity of a sustained sound. The following parameters are used in this study: min_freq = 2000, max_freq = 11000, j = 5, fft_w = 512. | Pieretti et al, 2011 |
| 声学多样性指数 Acoustic diversity index, (ADI) | 将频谱图划分为多个频段(默认为10), 并使用Shannon指数计算每个频段中超过阈值(默认为-50 dBFS)的声音所占比例。本研究中使用默认参数计算。The spectrogram is divided into frequency bands (default 10) and the percentage of sounds in each band that exceed the threshold (default -50 dBFS) is calculated using the Shannon index. The default parameters are used for calculation in this study. | Villanueva-Rivera et al, 2011 |
| 声学均匀度指数 Acoustic evenness index (AEI) | 将频谱图划分为多个频段(默认为10), 并使用Gini指数计算每个频段中超过阈值(默认为-50 dBFS)的声音所占比例。本研究中使用默认参数计算。The spectrogram is divided into frequency bands (default 10) and the Gini index is used to calculate the proportion of sounds in each band that exceeded the threshold (default -50 dBFS). The default parameters are used for calculation in this study. | Villanueva-Rivera et al, 2011 |
| 生物声学指数 Bioacoustic index (BIO) | 测量指定频率范围内的声音强度, 频谱中超过阈值部分的面积与大多数鸟类的鸣叫频率区间和声强有关, 本研究中使用以下参数计算: min_freq = 2000, max_freq = 11000, fft_w = 512。The sound intensity in the specified frequency range was measured and the area of the above-threshold portion of the spectrum was related to the frequency range and sound intensity of most birds’ calls. The following parameters were used in this study to calculate: min_freq = 2000, max_freq = 11000, fft_w = 512. | Boelman et al, 2007 |
| 标准化声景差异指数 Normalized difference sound index (NDSI) | 通过计算人工声(1-2 kHz)与生物声(2-11 kHz)的比值来评估人类活动对声景观的影响程度。范围从-1到1, 本研究中使用默认参数计算。NDSI was assessed by calculating the ratio of anthrophony (1-2 kHz) to biophony (2-11 kHz). The range is from -1 to 1 and is calculated using the default parameters in this study. | Kasten et al, 2012 |
1.5 数据分析
声学指数计算和所有统计分析均在R 4.0.0中完成。在进行数据分析前先使用Shapiro-Wilk检验法检验声学指数的正态性, 根据其分布特征选用Spearman相关分析验证不同月份鸟类丰富度和多度与6个声学指数间的相关关系。通常选择泊松分布来拟合具有数值意义的离散数据(张宇等, 2018), 根据鸟类数据的计数特点构建符合泊松分布的广义线性混合模型(GLMM)评估声学指数对鸟类丰富度和多度的预测程度。建模前对数据进行标准化处理, 将鸟类丰富度和多度作为响应变量, 调查月份和样点作为随机效应, 6个声学指数作为固定效应。为了避免解释变量间多重共线性的问题, 计算每个变量的方差膨胀因子(VIF), VIF > 10的变量被排除在分析之外。采用赤池信息准则(AIC)对模型的拟合优度进行评价, 利用MuMIn程序包中“dredge”函数进行模型排序的选择, ΔAICC ≤ 2的所有模型均可认为是最优模型(Mortelliti et al, 2010)。本研究采用模型平均的方法对AIC权重累计和大于0.95的多个模型的参数估计值进行平均(Grueber et al, 2011; Hao et al, 2021), 以此来确定对鸟类多样性影响显著的声学指数及其具体效应。同时计算模型边际效应的R2 (marginal R2, R2m)来表示固定效应对模型的解释量, 条件效应的R2 (conditional R2, R2c)表示固定效应和随机效应共同对模型的解释量。利用“ape”包计算Moran’s I以检验最优模型残差中的空间自相关(Paradis et al, 2004)。当遇到空间自相关时则使用“glmmPQL”函数拟合空间广义线性混合模型, 选取合适的相关矩阵结构建立空间模型(Dormann, 2007; Hamza et al, 2021)。
2 结果
2.1 两种调查方法下鸟类物种组成的比较
本研究通过样点法观测记录到鸟类33种2,475只, 通过频谱图辅助监听音频也记录到33种鸟类, 但未能直接获得具体数量。其中, 戴胜(Upupa epops)、金眶鸻(Charadrius dubius)仅在观测中被记录, 大杜鹃(Cuculus canorus)、银喉长尾山雀(Aegithalos glaucogularis)仅在监听识别中被记录。其他鸟种在两种方法均有记录, 占全部物种数的88.6%。综合两种方法获得4-6月东郊森林公园的鸟类共计35种, 隶属于10目23科(附录1)。其中鸣禽共记录到22种, 占整体的62.8%。在所有样点中, 麻雀(Passer montanus)和喜鹊(Pica pica)为优势种; 灰喜鹊(Cyanopica cyanus)、白头鹎(Pycnonotus sinensis)和金翅雀(Chloris sinica)为常见种。不同月份观测与监听的结果存在差异(图2), 样点间监听获得的物种平均值略高于直接观测记录, 这两种方法可相互补充以获得更完整的鸟类调查名录, 用于构建鸟类丰富度模型。
图2
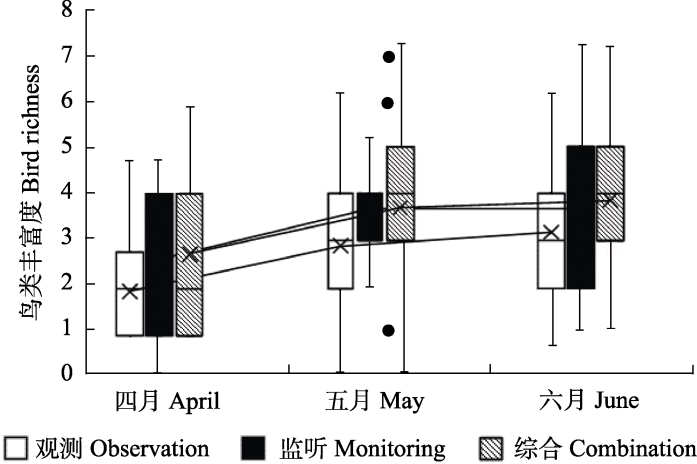
图2
东郊森林公园4-6月鸟类观测与监听结果
Fig. 2
Bird observation and monitoring results from April to June in Eastern Suburb Forest Park
2.2 两种调查方法下结果的相关性
基于3个月的整体结果显示大多数声学指数与鸟类多样性有显著相关关系, 仅H和BIO与鸟类丰富度间没有相关性, 但不同月份间鸟类丰富度和多度与声学指数的相关性有显著差异(表2)。其中ACI表现突出, 在3个月的结果中都显示与鸟类多样性显著正相关。NDSI与4月鸟类丰富度及4月和6月的鸟类多度呈正相关, H与4月鸟类多样性呈正相关, ADI与6月鸟类多度正相关, AEI与4月鸟类丰富度和6月鸟类多度呈负相关, 而BIO仅显示和4月鸟类多度呈正相关, 其他月份没有显著相关性。尽管鸟类丰富度和多度间存在相关性, 但研究结果表明在城市森林环境中声学指数与鸟类多度间的关系强于鸟类丰富度。
表2 东郊森林公园4-6月鸟类丰富度和多度与声学指数的相关性
Table 2
| 声学指数 Acoustic indices | 四月 April | 五月 May | 六月 June | 4-6月 April-June | ||||
|---|---|---|---|---|---|---|---|---|
| 丰富度 Richness | 多度 Abundance | 丰富度 Richness | 多度 Abundance | 丰富度 Richness | 多度 Abundance | 丰富度 Richness | 多度 Abundance | |
| 声熵指数 Acoustic entropy index (H) | 0.371* | 0.345* | 0.022 | 0.035 | -0.11 | 0.175 | 0.16 | 0.288** |
| 声学复杂度指数 Acoustic complexity index (ACI) | 0.614** | 0.591** | 0.349* | 0.437** | 0.456** | 0.316* | 0.425** | 0.369** |
| 声学多样性指数 Acoustic diversity index (ADI) | 0.282 | 0.175 | 0.166 | 0.194 | 0.164 | 0.327* | 0.323** | 0.373** |
| 声学均匀度指数 Acoustic evenness index (AEI) | -0.365* | -0.259 | -0.181 | -0.191 | -0.153 | -0.325* | -0.339** | -0.387** |
| 生物声学指数 Bioacoustic index (BIO) | 0.228 | 0.300* | 0.034 | 0.007 | -0.257 | 0.095 | 0.076 | 0.213* |
| 标准化声景差异指数 Normalized difference sound index (NDSI) | 0.517** | 0.671** | 0.111 | 0.186 | -0.044 | 0.423** | 0.269** | 0.502** |
* P < 0.05; ** P < 0.01.
2.3 声学指数模型与鸟类多样性的关系
在构建声学指数与鸟类多样性回归模型时, 每个变量的方差膨胀因子均小于10, 没有明显的多重共线性。检验两个模型残差的空间自相关时发现鸟类多度(Moran’s I < 0.004, P > 0.134)不受空间自相关的影响, 而鸟类丰富度(Moran’s I < 0.036, P < 0.001)在空间上出现聚集, 故采用“glmm PQL”函数构建包含空间自相关矩阵结构类型(corExp)的声学指数和鸟类丰富度模型。
表3 AIC权重累计和大于0.95的声学指数与鸟类多度模型集
Table 3
| 响应变量 Response variable | 解释变量 Explanatory variables | 自由度 df | Loglink | AICc | ΔAICc | 权重 Weight |
|---|---|---|---|---|---|---|
| 多度 Abundance | ACI + ADI + H + NDSI | 7 | -562.41 | 1,139.65 | 0.00 | 0.29 |
| ACI + ADI + NDSI | 6 | -564.15 | 1,140.92 | 1.27 | 0.15 | |
| ACI + ADI + BIO + H + NDSI | 8 | -562.15 | 1,141.39 | 1.74 | 0.12 | |
| ACI + ADI + AEI + H + NDSI | 8 | -562.34 | 1,141.77 | 2.12 | 0.10 | |
| ACI + ADI + BIO + NDSI | 7 | -563.69 | 1,142.22 | 2.56 | 0.08 | |
| ACI + AEI + H + NDSI | 7 | -563.74 | 1,142.33 | 2.68 | 0.08 | |
| ACI + AEI + NDSI | 6 | -565.05 | 1,142.72 | 3.07 | 0.06 | |
| ACI + ADI + AEI + NDSI | 7 | -564.11 | 1,143.06 | 3.40 | 0.05 | |
| ACI + ADI + AEI + BIO + H + NDSI | 9 | -562.08 | 1,143.54 | 3.88 | 0.04 | |
| ACI + AEI + BIO + H + NDSI | 8 | -563.52 | 1,144.13 | 4.48 | 0.03 |
声学指数缩写含义见
Abbreviations of acoustic indices see
表4 声学指数与鸟类多度的平均模型参数估计值
Table 4
| 响应变量 Response variable | 解释变量 Explanatory variables | 参数估计 Parameter estimate | 标准误 SE | P |
|---|---|---|---|---|
| 多度 Abundance | 截距 Intercept | 2.68 | 0.10 | < 0.001*** |
| ACI | 0.16 | 0.03 | < 0.001*** | |
| ADI | 0.18 | 0.07 | 0.01** | |
| H | -0.10 | 0.06 | 0.07 | |
| NDSI | 0.28 | 0.07 | < 0.001*** | |
| BIO | -0.05 | 0.06 | 0.44 | |
| AEI | -0.13 | 0.14 | 0.37 |
声学指数缩写含义见
Abbreviations of acoustic indices see
表5 声学指数与鸟类丰富度的空间模型参数估计
Table 5
| 响应变量 Response variable | 解释变量 Explanatory variables | 参数估计 Parameter estimate | 标准误 SE | P |
|---|---|---|---|---|
| 丰富度 Richness | 截距 Intercept | 1.250 | 0.054 | 0.000 |
| H | -0.044 | 0.073 | 0.512 | |
| ACI | 0.138 | 0.039 | < 0.001*** | |
| ADI | 0.200 | 0.118 | 0.093 | |
| AEI | -0.026 | 0.161 | 0.873 | |
| BIO | -0.112 | 0.070 | 0.080 | |
| NDSI | 0.064 | 0.073 | 0.344 |
声学指数缩写含义见
Abbreviations of acoustic indices see
3 讨论
3.1 声学监测与鸟类直接观测的比较
本研究通过声学监测人工识别的鸟类组成与样点法直接观测记录的总物种数相等且种类有相当多的重叠(88.6%), 但两种方法都检测出了独特的物种。传统鸟类观测可以直接获得鸟的种类和数量, 能够灵活高效地完成数据收集。但观察者通常需要大量时间进行系统学习和专业培训, 才能保证调查结果的准确性(吴飞和杨晓君, 2008)。而在监听录音的过程中可以反复提取音频从而减少鸟类被忽视的情况, 频谱图也提供了可视化声音的可能(Swiston & Mennill, 2009), 有效辅助了鸟类识别的过程。客观的声学记录有利于获得更准确的检测结果, 特别是在物种丰富的地区(Darras et al, 2019), 但通过监听识别不能直接获得鸟类群落的密度。有研究通过部署麦克风矩阵, 根据不同麦克风探测信号的时间延迟来推断鸣鸟的位置并估计鸟类密度(Efford et al, 2009; Frommolt & Tauchert, 2014), 或通过检测鸟类发声频次来预测密度, 能够在一定程度上弥补数量的空缺。不过这些方法局限在特定的物种, 还需要更多深入的研究(Pérez-Granados et al, 2019; Pérez-Granados & Traba, 2021)。
声学监测对具有独特鸣声且发声响亮的物种采样特别有效(Blake, 2021)。而出现在样地范围内的部分水鸟和不常发声的鸟种, 利用声音捕捉有效信息则变得比较困难。这可能会导致声学监测遗漏一些能在直接观察过程中看到但不常发声的物种, 鉴于两种方法具有不同的优势, 研究人员可以根据研究目的结合使用以获得更完整的物种调查结果。本研究中鸟类观测和录音同时进行, 保证了实验数据的一致性和可靠性, 但声学监测在长期监测中更具优势。录音设备支持在不同样点间同时进行昼夜连续、长时间的工作, 可获得更全面的动态数据。通过大数据的采样能够有效探测到罕见或稀有物种(Darras et al, 2019), 弥补对部分鸟类捕捉效率的不足, 分析鸟类群落分布随着时间推移的动态变化等。表6对两种方法的特点进一步进行比较, 并对本次实验未能直接验证的方法优劣进行补充。
表6 样点法和声学监测优劣对比补充
Table 6
| 样点法 Point counts | 声学监测 Acoustic monitoring | 参考文献 Reference | |
|---|---|---|---|
| 优势Advantage | (1)最常采用的鸟类调查方法之一, 易于实施、易于做到随机化或系统化。One of the most commonly used bird survey methods, easy to implement and easy to randomize or systematize. (2)观测过程中能够直接获得鸟的种类、数量、行为活动等信息, 具有高效性和灵活性。The observation process is efficient and flexible as it provides direct access to information on bird species, numbers, behavioral activities, etc. (3)适用于复杂、斑块化的生境。相较于样线法, 观察员有更多的时间观察鸟类, 减弱行走速度带来的影响。Suitable for complex habitats, observers have more time to observe birds and attenuate the effects of walking speed compared to the sample line method. | (1)快速发展的调查方法之一。操作简单易重复, 支持同时进行大尺度、长期、连续的动态监测与跟踪。One of the rapidly developing survey methods, simple and repeatable in operation, supports simultaneous large-scale, long-term, continuous dynamic monitoring. (2)不侵入自然环境, 尽可能地减少现场调查对动植物的影响。有利于对偏远地区、稀有物种的监测。It does not invade the natural environment, minimizes the impact of field surveys on flora and fauna, and facilitates the monitoring of remote areas and rare species. (3)录音永久保存、可反复监听, 降低识别偏差。声学指数和机器学习的不断发展有助于快速评估生物多样性的动态变化。Recordings can be permanently stored and repeatedly monitored to reduce identification bias. The development of acoustic indices and machine learning helps to rapidly assess dynamic changes in biodiversity. | 吴飞和杨晓君, 2008; Zhang et al, 2018; Darras et al, 2019 |
| 劣势Weakness | (1)观测次数有限, 不能保证多样点间同步进行, 观测周期影响结果的可靠性。The limited number of observations does not guarantee the synchronization of multiple points, and the period affects the reliability of the results. (2)对观察员的专业能力要求较高。在地形复杂、植被密集的森林中, 因视线容易受阻导致记录不完全。The professional competence of observers is required. In forests with complex terrain and dense vegetation, it is easy to have incomplete records due to obstructed vision. (3)人类的接近引入了惊飞或回避效应, 尤其是多名调查人员带来的干扰可能会使鸟类远离观察者的视线, 影响调查结果。Human proximity introduces a startle or avoidance effect, especially as disturbance from multiple investigators may keep birds away and affect findings. | (1)应对大数据的挑战。长期录制产生庞大的音频文件, 需要考虑大数据的存储与处理, 电池容量及更换成本等。The challenge of big data. Long-term recording generates huge audio files, requiring consideration of big data storage and processing, battery capacity, and replacement costs, etc. (2)人工识别需要大量的时间精力, 目前自动识别的技术还易受到背景噪声和声音重叠的干扰导致结果偏差。 Manual recognition takes a lot of time, and current automatic recognition techniques are still subject to interference from background noise and sound overlap, leading to biased results. (3)天气条件或人为破坏对录音设备的灵敏度造成影响, 长期监测中数据丢失可能会在很长一段时间内不被注意到, 需要定期查看维护。Weather conditions or vandalism affect the sensitivity of recording equipment, and data loss during long-term monitoring may unnoticed and require regular maintenance. | Prabowo et al, 2016; Priyadarshani et al, 2018; Darras et al, 2019 |
3.2 不同月份声学指数与鸟类多样性的关系
声学指数与城市森林中的鸟类丰富度和多度的相关性在不同月份间呈现明显的差异。4月声学指数的指示结果要明显优于5月和6月, 这可能与每月记录到的主要发声鸟种不同有关。鸟鸣声频率和强度的差异会造成声学指数的结果出现变化, 这为探究不同物种间的发声特性提供了可能。4月多数鸟类处在繁殖期, 为吸引配偶, 鸣声以声音响亮且婉转的鸣唱为主。黄眉柳莺(Phylloscopus inornatus)和黄腰柳莺(P. proregulus)等身材较小的旅鸟记录就主要集中在这个期间。而5-6月主要记录了四声杜鹃(Cuculus micropterus)、大杜鹃等体型较大的鸟, 它们的发声频率低, 传播范围较广。除此之外, 6月的个别音频中记录到蟪蛄(Platpleura keampferi)的鸣声, 而昆虫鸣声通常较为强烈(Diepstraten & Willie, 2021), 这也会影响声学指数与鸟类多样性间的相关性。本次调查集中在鸟类鸣声对声景贡献相对较大的4-6月, 鉴于声学指数和鸟类多样性的相关性在不同月份有明显差异, 有必要在不同季节进行重复实验以进一步验证声学指数指示结果的有效性。
3.3 不同声学指数与鸟类多样性的关系
在评估的6个声学指数中, ACI在3个月的记录中都显示出与鸟类的丰富度和多度显著相关。ACI为了捕捉环境中生物声音信号的复杂性, 相对不受城市中人类和环境中恒定噪声带来的影响(Pieretti et al, 2011), 这增强了声学指数在城市环境中的适用性。与在其他生境中的记录一致, H、ADI和AEI也被证明与鸟类丰富度和多度相关(Mammides et al, 2017; Eldridge et al, 2018; Marín-Gómez & MacGregor-Fors, 2019)。其中H和ADI与鸟类多样性呈正相关, AEI随着鸟类丰富度的增加而降低。有些学者发现BIO与鸟类多度之间存在很强的正相关(Boelman et al, 2007; Fuller et al, 2015), 但本研究得到了不一致的结果。这可能是由于城市中存在多种干扰源, 导致结果出现偏差, 说明BIO并不适合在干扰强烈的环境中使用。NDSI与鸟类多度的相关性较高, 该指数受人为干扰和生物多样性两个因素共同影响(Kasten et al, 2012)。本研究显示人为干扰越小、人工声越少的样地, 鸟的种类和数量越多, 生物声更加丰富。声学指数有助于快速评估城市森林中的鸟类多样性情况。值得注意的是, 目前没有单独的指标可以准确描述整个声音环境, 在预测生物多样性和声学活动时多个指数组合比单一指标更有效(Towsey et al, 2014), 这就需要进一步探究多个声学指数组合对鸟类多样性的解释和预测能力。
3.4 声学指数用于评估城市森林中鸟类多样性的局限性和潜力
声学指数模型对鸟类多度的评估能力优于丰富度, 鸟类多度对自然环境中声音多样性和复杂性的贡献在一定程度上比物种丰富度要大, 声学指数更能体现环境中声音群落的多样性。声学指数会受环境中其他声音的影响, 不少研究指出声学指数模型的效果会受到昆虫、天气和人类活动声音的负面干扰(Buxton et al, 2018), 从而导致预测能力降低。为了更好地衡量鸟类群落的发声情况, 我们选择在鸟类的活跃时间段进行采样, 但这并不能完全排除非焦点生物的声音。我们在监听中发现城市森林中的人工声主要包括以下3类: (1)园林管护: 包括除草声、粉碎枝条声、广播声、施工声; (2)人类活动: 包括甩鞭子声、抖空竹声、广场舞、唱歌交谈声; (3)交通噪声: 包括鸣笛声、飞机声、摩擦声等, 这些人工声可能会造成声学指数的指示偏差。Fairbrass等(2017)指出交谈声会导致ACI和BIO高于期望值, 而ADI和NDSI低于期望值。Munro等(2018)的研究表明交通噪声会对发声动物造成负面影响。人为干扰通过改变动物的群落结构、日常行为和活动空间以及掩盖生物声音信号, 直接或间接地影响声学指数的指示性能(Mitchell et al, 2020; Diepstraten & Willie, 2021)。同时, 声学指数的选择也会影响模型预测能力。在Buxton等(2018)的研究中使用了36个相关变量来建立声学记录中动物声音多样性的预测模型, 最终获得理想的评估准确度。但在实际应用中, 过多的指标会使评估效率降低。研究人员需在充分理解声学指数含义的前提下选择更具针对性的指数, 如何选择合适的声学生态指标以获得更好的模型拟合效果也是未来研究的方向。
目前, 声学指数还在不断开发和更新, 例如“hardRain”软件包(Metcalf et al, 2020)可以对大型声音数据集进行预处理, 检测出降雨干扰的文件。根据研究需求可以考虑通过机器学习等方法剔除人工声和地球物理声的干扰, 从大量的声学数据集中提取有效的生态信息, 以进一步提高声学指数的精度与准确性。若仅需快速获得不同样点间生物多样性的整体特征, 则计算声学指数能极大提高分析效率; 如需探究生境内完整的物种名录, 则传统直接观测和声学监测联合使用会比单独使用任何一种方法更有效。声学监测作为一种独立或补充的手段, 在生物多样性方面的研究中有很大发展空间和应用价值, 本研究支持使用声学指数作为快速评估鸟类多样性的指标, 但在广泛应用之前需要更多实验进一步验证。
本研究验证了生物声学监测在城市森林中应用的可行性, 通过人工识别音频中的鸟类可以获得和样点法直接观测相似的结果。相邻月份间主要发声鸟种的不同影响了声学指数与鸟类丰富度的相关性, 且声学指数对鸟类多度的预测能力优于鸟类丰富度。基于声音调查城市森林中鸟类多样性的特征拓宽了生物多样性研究的方法。声学监测具有连续采样、长期且同步性好等优势, 新技术的尝试在推动生物多样性监测快速发展方面发挥着关键作用。除了确定环境中发声生物的种类和数量外, 积累长期且连续的声音数据有助于进一步探究其发声特性、鸣叫特征以及环境干扰导致的行为活动变化等问题(Gasc et al, 2017)。通过分析声学指数的时空动态变化趋势有助于了解发声生物的生态行为和群落结构的动态信息, 帮助研究人员评估土地利用变化、气候变化、城市化等因素导致的生物多样性差异等(边琦等, 2021)。声学监测在促进城市生物多样性保护、城市自然资源管理和生态系统监测方面具有巨大发展空间, 随着科学技术的不断创新, 声学监测的应用前景值得期待。
附录 Supplementary Material
附录1 东郊森林公园4-6月鸟类综合调查名录
Appendix 1 Bird survey list from April to June in Eastern Suburb Forest Park
参考文献
Application of ecoacoustic monitoring in the field of biodiversity science
DOI:10.13287/j.1001-9332.202103.032
[本文引用: 1]

Sound is an important way of communication among organisms. The monitoring and analy-sis of biological sound is an emerging method to describe and evaluate biodiversity. This method does not invade or damage the natural environment. By recording ecological information through sound, it can effectively reflect the relevant characteristics of biodiversity. The sound-based exploration of biodiversity change has broadened the interdisciplinary approach and has been increasingly applied to ecological research. Here, we expounded on the main theoretical foundations and research methods of using acoustic monitoring to assess biodiversity. We introduced related research fields from two aspects, namely the biodiversity of vocal animals and the temporal and spatial diversity of soundscape. We presented examples of the application of acoustic monitoring to assess the impact of land-use change, climate change and urbanization on biodiversity. Finally, we proposed the future direction of development, and hope that the potential of sound surveys could be further explored to provide an effective reference for biodiversity monitoring and assessment.
生物声音监测研究在生物多样性领域的应用
DOI:10.13287/j.1001-9332.202103.032
[本文引用: 1]
声音是生物之间交流的重要手段,对生物声音的监测与分析是描述和评估生物多样性的新兴方法。这种方法不侵入和破坏自然环境,通过声音记录生态信息,并有效反映生物多样性的相关特征,是一种重要的生态工具。从声音角度探讨生物多样性的变化拓宽了多学科交叉的新思路,因此近年来被越来越多地应用于生态学研究中。本文阐述了利用声音监测评估生物多样性的主要理论基础和研究方法,从发声动物的生物多样性、声景的时空多样性两个方面介绍了相关领域的研究进展,列举了声音监测在评估土地利用变化、气候变化和城市化对生物多样性影响的应用实例。最后,对未来研究方向进行了展望,希望能进一步挖掘声音调查的发展潜力,为生物多样性的监测评估提供有效的借鉴和参考。
Acoustic monitors and direct observations provide similar but distinct perspectives on bird assemblages in a lowland forest of eastern Ecuador
Multi-trophic invasion resistance in Hawaii: Bioacoustics, field surveys, and airborne remote sensing
DOI:10.1890/07-0004.1 URL [本文引用: 3]
Rapid assessment of avian species richness and abundance using acoustic indices
Guidelines for the use of acoustic indices in environmental research
DOI:10.1111/2041-210X.13254
[本文引用: 1]
Ecoacoustics, the study of environmental sound, is a growing field with great potential for biodiversity monitoring. Audio recordings could provide a rapid, cost-effective monitoring tool offering novel insights into ecosystem dynamics. More than 60 acoustic indices have been developed to date, which reflect distinct attributes of the soundscape, (i.e. the total acoustic energy at a given location, including noise produced by animals, machinery, wind and rain). However, reported patterns in acoustic indices have been contradictory, possibly because there is no accepted best practice for the collection and analysis of audio recordings. Here, we propose: (a) guidelines for designing studies using audio recordings for the rapid assessment of multiple sites; and (b) a workflow for comparing recordings with seven of the most commonly used indices, permitting discrimination among habitat-specific soundscapes. We collected and analysed over 26,000 hr of recordings from 117 sites across a range of habitats in a human-modified tropical landscape in central Panama; an order of magnitude more recordings than used in previously published studies. We demonstrate that: (a) Standard error variance of indices stabilizes within 120 hr of recordings from a single location. (b) Continuous recording should be used rather than subsample recording on a schedule; sub sampling is a common practice but delays capture of site variability and maximizing total duration of recording should be prioritized. (c) Use of multiple indices to describe soundscape patterns reveals distinct diel and seasonal soundscape patterns among habitats. We advocate collecting at least 120 hr of continuous recordings per site, and using a range of acoustic indices to categorize the soundscape, including the Acoustic Complexity Index, Acoustic Evenness Index, Acoustic Entropy Index and the Normalized Difference Soundscape Index. Differences among habitat types can be captured if multiple indices are used, and magnitude of variance is often more important than mean values. The workflow we provide will enable successful use of ecoacoustic techniques for environmental monitoring.
Measurement artefacts lead to false positives in the study of birdsong in noise
DOI:10.1111/2041-210X.12766 URL [本文引用: 1]
Efficacy of extracting indices from large-scale acoustic recordings to monitor biodiversity
DOI:10.1111/cobi.13119
PMID:29676813
[本文引用: 2]
Passive acoustic monitoring could be a powerful way to assess biodiversity across large spatial and temporal scales. However, extracting meaningful information from recordings can be prohibitively time consuming. Acoustic indices (i.e., a mathematical summary of acoustic energy) offer a relatively rapid method for processing acoustic data and are increasingly used to characterize biological communities. We examined the relationship between acoustic indices and the diversity and abundance of biological sounds in recordings. We reviewed the acoustic-index literature and found that over 60 indices have been applied to a range of objectives with varying success. We used 36 of the most indicative indices to develop a predictive model of the diversity of animal sounds in recordings. Acoustic data were collected at 43 sites in temperate terrestrial and tropical marine habitats across the continental United States. For terrestrial recordings, random-forest models with a suite of acoustic indices as covariates predicted Shannon diversity, richness, and total number of biological sounds with high accuracy (R ≥ 0.94, mean squared error [MSE] ≤170.2). Among the indices assessed, roughness, acoustic activity, and acoustic richness contributed most to the predictive ability of models. Performance of index models was negatively affected by insect, weather, and anthropogenic sounds. For marine recordings, random-forest models poorly predicted Shannon diversity, richness, and total number of biological sounds (R ≤ 0.40, MSE ≥ 195). Our results suggest that using a combination of relevant acoustic indices in a flexible model can accurately predict the diversity of biological sounds in temperate terrestrial acoustic recordings. Thus, acoustic approaches could be an important contribution to biodiversity monitoring in some habitats.© 2018 The Authors. Conservation Biology published by Wiley Periodicals, Inc. on behalf of Society for Conservation Biology.
A comparison of line transect and point count surveys: A case study of spring saltmarsh birds at Chongming Dongtan
DOI:10.3724/SP.J.1003.2010.044
[本文引用: 1]
We compared fixed-distance line transect and fixed-radius point count surveys for estimating saltmarsh bird richness and abundance at Chongming Dongtan. A total of 24 bird species were recorded during five surveys in spring 2008, 19 during line transects and 21 during point counts. The average number of species detected per survey did not differ between the two methods. Density estimates of individual species from the two methods were correlated, suggesting that the two methods consistently estimate relative abundance. However, density of individual species and of all species combined as estimated by point count surveys were higher than those by line transect surveys. Our results indicate that it is important to account for different survey methods when comparing temporal and spatial differences in bird species richness and abundance.
鸟类调查的样线法和样点法比较: 以崇明东滩春季盐沼鸟类调查为例
DOI:10.3724/SP.J.1003.2010.044
[本文引用: 1]
为了探讨样线法和样点法对盐沼湿地鸟类调查的有效性及适用性, 我们于2008年3–5月采用固定距离样线法和固定半径样点法对崇明东滩盐沼鸟类进行了调查。5次调查共记录到鸟类24种, 其中样线法记录到19种, 样点法记录到21种, 两种调查方法平均每次记录到的鸟类种数没有显著差异, 表明两种方法对盐沼鸟类种类的发现能力相似。两种方法得到的鸟类密度之间有显著的相关性,说明两种方法在反映鸟类群落中每种鸟类的相对数量方面具有可比性。但除了仅在一种调查方法中记录到的种类, 样点法调查得到的每种鸟类密度和鸟类总密度均高于样线法的调查结果。因此, 在对鸟类种群或群落的时空特征进行比较时, 需要考虑所采用的调查方法对调查结果的影响。
Autonomous sound recording outperforms human observation for sampling birds: A systematic map and user guide
Assessing the structure and drivers of biological sounds along a disturbance gradient
Effects of incorporating spatial autocorrelation into the analysis of species distribution data
DOI:10.1111/j.1466-8238.2006.00279.x URL [本文引用: 1]
Population density estimated from locations of individuals on a passive detector array
The density of a closed population of animals occupying stable home ranges may be estimated from detections of individuals on an array of detectors, using newly developed methods for spatially explicit capture-recapture. Likelihood-based methods provide estimates for data from multi-catch traps or from devices that record presence without restricting animal movement ("proximity" detectors such as camera traps and hair snags). As originally proposed, these methods require multiple sampling intervals. We show that equally precise and unbiased estimates may be obtained from a single sampling interval, using only the spatial pattern of detections. This considerably extends the range of possible applications, and we illustrate the potential by estimating density from simulated detections of bird vocalizations on a microphone array. Acoustic detection can be defined as occurring when received signal strength exceeds a threshold. We suggest detection models for binary acoustic data, and for continuous data comprising measurements of all signals above the threshold. While binary data are often sufficient for density estimation, modeling signal strength improves precision when the microphone array is small.
Sounding out ecoacoustic metrics: Avian species richness is predicted by acoustic indices in temperate but not tropical habitats
DOI:10.1016/j.ecolind.2018.06.012 URL [本文引用: 2]
Biases of acoustic indices measuring biodiversity in urban areas
DOI:10.1016/j.ecolind.2017.07.064 URL [本文引用: 2]
Applying bioacoustic methods for long-term monitoring of a nocturnal wetland bird
DOI:10.1016/j.ecoinf.2013.12.009 URL [本文引用: 1]
Connecting soundscape to landscape: Which acoustic index best describes landscape configuration?
DOI:10.1016/j.ecolind.2015.05.057 URL [本文引用: 1]
Future directions for soundscape ecology: The importance of ornithological contributions
DOI:10.1642/AUK-16-124.1 URL [本文引用: 1]
Emerging opportunities and challenges for passive acoustics in ecological assessment and monitoring
DOI:10.1111/2041-210X.13101 URL [本文引用: 1]
Multimodel inference in ecology and evolution: Challenges and solutions
DOI:10.1111/j.1420-9101.2010.02210.x
PMID:21272107
[本文引用: 1]
Information theoretic approaches and model averaging are increasing in popularity, but this approach can be difficult to apply to the realistic, complex models that typify many ecological and evolutionary analyses. This is especially true for those researchers without a formal background in information theory. Here, we highlight a number of practical obstacles to model averaging complex models. Although not meant to be an exhaustive review, we identify several important issues with tentative solutions where they exist (e.g. dealing with collinearity amongst predictors; how to compute model-averaged parameters) and highlight areas for future research where solutions are not clear (e.g. when to use random intercepts or slopes; which information criteria to use when random factors are involved). We also provide a worked example of a mixed model analysis of inbreeding depression in a wild population. By providing an overview of these issues, we hope that this approach will become more accessible to those investigating any process where multiple variables impact an evolutionary or ecological response.© 2011 The Authors. Journal of Evolutionary Biology © 2011 European Society For Evolutionary Biology.
Urban and industrial landscapes interact with microhabitat to predict occurrence of European turtle dove (Streptopelia turtur) in Mediterranean oases: Implications for conservation
Birds’ courtship display behaviour and its biological significance
鸟类的求偶行为及其生物学意义
Soundscape mapping for spatial-temporal estimate on bird activities in urban forests
It is not just about birds: What do acoustic indices reveal about a Costa Rican tropical rainforest?
DOI:10.1080/23766808.2021.1971042 URL [本文引用: 1]
The remote environmental assessment laboratory’s acoustic library: An archive for studying soundscape ecology
Comparison of point counts and automated acoustic monitoring: Detecting birds in a rainforest biodiversity survey
DOI:10.1071/MU15097 URL [本文引用: 1]
Conducting rigorous avian inventories: Amazonian case studies and a roadmap for improvement
DOI:10.1007/BF03544240 URL [本文引用: 1]
Do acoustic indices reflect the characteristics of bird communities in the savannas of Central Brazil?
DOI:10.1016/j.landurbplan.2017.01.014 URL [本文引用: 1]
Do acoustic indices correlate with bird diversity? Insights from two biodiverse regions in Yunnan Province, South China
DOI:10.1016/j.ecolind.2017.07.017 URL [本文引用: 1]
How early do birds start chirping? Dawn chorus onset and peak times in a neotropical city
DOI:10.13157/arla.66.2.2019.ra5 URL [本文引用: 1]
hardRain: An R package for quick, automated rainfall detection in ecoacoustic datasets using a threshold-based approach
Spatial replication and habitat context matters for assessments of tropical biodiversity using acoustic indices
Independent effects of habitat loss, habitat fragmentation and structural connectivity on forest-dependent birds
DOI:10.1111/j.1472-4642.2010.00701.x URL [本文引用: 1]
Traffic noise impacts on urban forest soundscapes in south-eastern Australia
DOI:10.1111/aec.12555 URL [本文引用: 1]
APE: Analyses of phylogenetics and evolution in R language
DOI:10.1093/bioinformatics/btg412
PMID:14734327
[本文引用: 1]
Analysis of Phylogenetics and Evolution (APE) is a package written in the R language for use in molecular evolution and phylogenetics. APE provides both utility functions for reading and writing data and manipulating phylogenetic trees, as well as several advanced methods for phylogenetic and evolutionary analysis (e.g. comparative and population genetic methods). APE takes advantage of the many R functions for statistics and graphics, and also provides a flexible framework for developing and implementing further statistical methods for the analysis of evolutionary processes.The program is free and available from the official R package archive at http://cran.r-project.org/src/contrib/PACKAGES.html#ape. APE is licensed under the GNU General Public License.
Effort needed to accurately estimate vocal activity rate index using acoustic monitoring: A case study with a dawn-time singing passerine
Estimating bird density using passive acoustic monitoring: A review of methods and suggestions for further research
DOI:10.1111/ibi.12944 URL [本文引用: 1]
A new methodology to infer the singing activity of an avian community: The acoustic complexity index (ACI)
DOI:10.1016/j.ecolind.2010.11.005 URL [本文引用: 3]
Bird responses to lowland rainforest conversion in Sumatran Smallholder Landscapes, Indonesia
Automated birdsong recognition in complex acoustic environments: A review
Bird sounds classification by large scale acoustic features and extreme learning machine
Song activity in the chiffchaff: Territorial defence or mate guarding?
DOI:10.1006/anbe.1996.0074 URL [本文引用: 1]
Temporal and spatial variability of animal sound within a neotropical forest
DOI:10.1016/j.ecoinf.2013.12.006 URL [本文引用: 1]
Autonomous recording units in avian ecological research: Current use and future applications
Automatic acoustic detection of birds through deep learning: The first bird audio detection challenge
DOI:10.1111/2041-210X.13103
[本文引用: 1]
Assessing the presence and abundance of birds is important for monitoring specific species as well as overall ecosystem health. Many birds are most readily detected by their sounds, and thus, passive acoustic monitoring is highly appropriate. Yet acoustic monitoring is often held back by practical limitations such as the need for manual configuration, reliance on example sound libraries, low accuracy, low robustness, and limited ability to generalise to novel acoustic conditions. Here, we report outcomes from a collaborative data challenge. We present new acoustic monitoring datasets, summarise the machine learning techniques proposed by challenge teams, conduct detailed performance evaluation, and discuss how such approaches to detection can be integrated into remote monitoring projects. Multiple methods were able to attain performance of around 88% area under the receiver operating characteristic (ROC) curve (AUC), much higher performance than previous general-purpose methods. With modern machine learning, including deep learning, general-purpose acoustic bird detection can achieve very high retrieval rates in remote monitoring data, with no manual recalibration, and no pretraining of the detector for the target species or the acoustic conditions in the target environment.
Acoustic indices for biodiversity assessment and landscape investigation
DOI:10.3813/AAA.918757 URL [本文引用: 1]
Rapid acoustic survey for biodiversity appraisal
Terrestrial passive acoustic monitoring: Review and perspectives
DOI:10.1093/biosci/biy147
[本文引用: 1]
Passive acoustic monitoring (PAM) is quickly gaining ground in ecological research, following global trends toward automated data collection and big data. Using unattended sound recording, PAM provides tools for long-term and cost-effective biodiversity monitoring. Still, the extent of the potential of this emerging method in terrestrial ecology is unknown. To quantify its application and guide future studies, we conducted a systematic review of terrestrial PAM, covering 460 articles published in 122 journals (1992-2018). During this period, PAM-related studies showed above a fifteenfold rise in publication and covered three developing phases: establishment, expansion, and consolidation. Overall, the research was mostly focused on bats (50%), occurred in northern temperate regions (65%), addressed activity patterns (25%), recorded at night (37%), used nonprogrammable recorders (61%), and performed manual acoustic analysis (58%), although their applications continue to diversify. The future agenda should include addressing the development of standardized procedures, automated analysis, and global initiatives to expand PAM to multiple taxa and regions.
Comparison of manual and automated methods for identifying target sounds in audio recordings of Pileated, Pale-billed, and putative Ivory-billed woodpeckers
DOI:10.1111/j.1557-9263.2009.00204.x URL [本文引用: 1]
The use of acoustic indices to determine avian species richness in audio-recordings of the environment
DOI:10.1016/j.ecoinf.2013.11.007 URL [本文引用: 1]
A primer of acoustic analysis for landscape ecologists
DOI:10.1007/s10980-011-9636-9 URL [本文引用: 3]
Comparison of acoustic and traditional point count methods to assess bird diversity and composition in the Aberdare National Park, Kenya
DOI:10.1111/aje.12596
[本文引用: 2]
Afromontane forests, like those in the Aberdare National Park (ANP) in Kenya, sustain unique avifaunal assemblages. There is a growing need for biodiversity inventories for Afromontane forests, especially through the utilisation of unskilled observers. Acoustic surveys are a potential aid to this, but more comparisons of this technique with that of traditional point counts are needed. We conducted a systematic survey of the ANP avifauna, assessing whether acoustic and traditional surveys resulted in different species richness scores, and whether this varied with habitat and species characteristics. We also investigated the role of habitat and elevation in driving variation in species richness. The ANP provides habitat types including scrub, moorland, montane, hagenia and bamboo forests. Overall, the surveys yielded 101 identified species. The acoustic method resulted in higher species richness scores compared to the traditional method across all habitats, and the relative performance of the two methods did not vary with habitat type or visibility. The methods detected different species, suggesting that they should be used together to maximise the range of species recorded. We found that habitat type was the primary driver of variation in species richness, with scrub and montane forest having higher species richness scores than other habitats.
Evolutionary divergence in acoustic signals: Causes and consequences
DOI:10.1016/j.tree.2012.10.002 URL [本文引用: 1]
Application of point count method in forest birds survey
样点法在森林鸟类调查中的运用
Bird community composition and its seasonal variation in comprehensive communities in Beijing: A case study of Chinese Academy of Forestry
北京综合性社区鸟类群落构成及其季节变化——以中国林业科学研究院社区为例
The influence of habitat types on bird community in urban parks
城市公园生境类型对鸟类群落的影响
Application of soundscape monitoring technology in bird diversity monitoring at the typical wetland of Poyang Lake
声音监测技术在鄱阳湖典型湿地鸟类多样性监测中的应用
Comparing the effectiveness of camera trapping to traditional methods for biodiversity surveys of forest birds
DOI:10.17520/biods.2017275
[本文引用: 1]
To compare the effectiveness of camera trapping to more common mist netting, fixed-distance line transect, and fixed-radius point count methods of forest birds, we surveyed bird species diversity at Nanling National Nature Reserve and Chebaling National Nature Reserve, Guangdong, China from 2011 to 2016. At Nanling, 222 bird species were recorded by fixed-distance line transect and fixed-radius point count methods, 43 bird species were captured by mist netting and 47 bird species were trapped by cameras. One species was captured only by mist netting, six species only by camera-trapping, and 164 species only by fixed-distance line transect and fixed-radius point count methods. At Chebaling, 109 bird species were recorded by fixed-distance line transect and fixed-radius point count methods, 42 by mist nets and 27 by cameras. Nine species were recorded only by mist netting, three only by camera-trapping, and 97 only by fixed-distance line transect and fixed-radius point count methods. At both sites, the number of birds captured by mist netting was negatively correlated with increasing body size, whether measured as body weight, body length, wing length, or tarsus length. By contrast, the number of birds photographed by camera traps was positively correlated with the same measures of body size. These results show that bird surveys using different methods may yield different results and that method should be selected to suit the body size of the target bird species. In surveying bird diversity of a wide range of body sizes, mist netting and camera trapping together would be complimentary methods. Our results suggest that a combination of research methods may be necessary to obtain reliable avian diversity estimates.
红外相机技术与其他几种森林鸟类多样性调查方法的比较
DOI:10.17520/biods.2017275
[本文引用: 1]
为了探讨红外相机技术、网捕法、固定距离样线法和固定半径样点法对森林鸟类多样性调查的有效性和实用性, 我们于2011-2016年, 用这几种方法调查了广东南岭国家级自然保护区和车八岭国家级自然保护区的鸟类多样性。在南岭, 固定距离样线法和固定半径样点法记录鸟类222种, 网捕鸟类43种, 红外相机拍到鸟类47种; 其中1种鸟仅网捕到, 6种鸟仅被红外相机拍到, 164种鸟仅被固定距离样线法和固定半径样点法记录到。在车八岭, 固定距离样线法和固定半径样点法记录鸟类109种, 网捕鸟类42种, 红外相机拍到鸟类27种, 其中9种鸟仅网捕到, 3种鸟仅被红外相机拍到, 97种鸟仅被固定距离样线法和固定半径样点法记录到。随着鸟类的体重、体长、翅长和跗蹠增加, 网捕到的鸟类个体数量减少, 鸟类身体大小与网捕到的鸟类数量呈显著负相关; 而红外相机拍到的鸟类数量随鸟类的身体大小增大而增加, 并且呈显著的正相关。本文的结果显示, 网捕法和红外相机技术针对不同类群的鸟类调查效力不同, 但都是固定距离样线法和固定半径样点法的有效补充。建议今后开展森林鸟类多样性调查与监测时, 尽量采用多种研究方法相结合, 以求达到最优的效果。
Evaluation of habitat suitability based on patches of the Sichuan snub-nosed monkey (Rhinopithecus roxellana) in Shennongjia, Hubei Province
基于斑块尺度的神农架川金丝猴生境适宜性评价
