


大型食肉动物对生态系统功能维持和生物多样性保护有重要作用(Prugh & Laura, 2009; Estes et al, 2011; Ripple et al, 2014; Suraci et al, 2016)。雪豹(Panthera uncia)是亚洲中部和南部山地生态系统中的大型食肉动物和顶级捕食者, 同时也是亚洲高山裸岩生态系统中的旗舰种、伞护种(李娟, 2012; Sharma et al, 2014; Alexander et al, 2016a)。但雪豹的生存状况不容乐观, 世界自然保护联盟(IUCN)于2017年将雪豹评为易危(VU)物种(McCarthy et al, 2017), 全球雪豹面临着疾病、气候变化、极端天气、报复性猎杀、偷猎和误杀、自然猎物减少、栖息地退化和破碎化等众多威胁因素(McCarthy et al, 2017)。为保证雪豹的物种存续, 通过长期监测了解其种群动态是开展保护工作的前提条件和必要手段。
在现有野生动物调查方法中, 红外相机法是目前雪豹及其他猫科动物调查使用最广泛的方法之一, 其实施难度和成本较低, 可全天、长期拍摄, 且能依据猫科动物身上的斑纹获得个体形貌和行为的详细信息(Jackson et al, 2006; Sollmann et al, 2012; Harmsen et al, 2020)。自21世纪初, 应用红外相机的雪豹调查工作已在多个雪豹分布国家里陆续开展, 但现有的此类调查大多数是仅持续2-3个月的短期调查(如McCarthy et al, 2008; Janečka et al, 2011; Alexander et al, 2015; Sharma et al, 2021), 这种“快照”式调查可作快速摸底之用, 虽有利于扩大调查范围, 但无法提供种群动态等关键信息, 因此, 短期的红外相机调查在评估种群生存状况和保护成效, 调整保护管理措施, 深入了解物种生态学特性等方面的功能有限(Sharma et al, 2014)。目前国际上仅有蒙古南戈壁托斯特山1例连续4年和吉尔吉斯斯坦1例连续3年的雪豹种群长期红外相机监测工作发表, 两项工作都分析了雪豹种群动态(Sharma et al, 2014; Rode et al, 2021)。在国内, 四川卧龙国家级自然保护区内持续28个月的雪豹监测是目前已发表的时间最长的监测工作(唐卓等, 2017), 其次为甘肃祁连山国家级自然保护区内19个月的雪豹监测(Alexander et al, 2016b)。以上两项国内雪豹长期监测工作均未分析种群动态, 国内其余雪豹调查工作均为短期调查。
在山水自然保护中心和北京大学自然保护与社会发展研究中心的支持下, 三江源国家级自然保护区内, 玉树藏族自治州玉树市哈秀乡云塔村的牧民们从2013年10月开始雪豹监测工作。牧民们接受红外相机使用和维护的培训, 参与到当地雪豹保护工作, 形成了有利于长期维持的社区保护模式(贾丁等, 2020), 目前已传回至2019年1月共5年多时间的雪豹监测数据。本研究首次分析了此地雪豹的种群动态, 并根据研究结果为该地雪豹保护提出针对性建议。本研究也指出了种群动态监测的重要性和长期红外相机监测的可能性, 以期为其他雪豹种群的此类工作提供参考。
1 研究方法
1.1 研究区域
云塔村野生动物资源丰富, 已发现的有岩羊(Pseudois nayaur)、白唇鹿(Przewalskium albirostris)、马麝(Moschus chrysogaster)、中华鬣羚(Capricornis milneedwardsii)等野生有蹄类动物, 喜马拉雅旱獭(Marmota himalayana)、高原鼠兔(Ochotona curzoniae)等啮齿动物, 多种鸟类, 以及雪豹、狼(Canus lupus)、赤狐(Vulpes vulpes)、猞猁(Lynx lynx)等食肉动物(贾丁等, 2020)。作为雪豹的主要猎物, 云塔村的岩羊密度为8.67只/km2, 处于各地已报道雪豹猎物密度的较高水平(肖凌云, 2017)。
云塔村位于通天河畔, 通天河流经村北面和东面, 在非结冰期将云塔村雪豹种群与通天河东北岸的种群隔开。云塔村与西面的村有高山裸岩斑块相连, 与南面的村以平缓的高寒草甸为界, 将该村的高山裸岩生态系统相对隔离开来(图1)。
图1
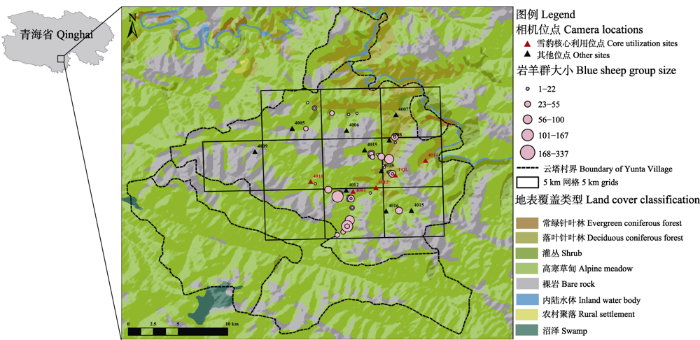
图1
云塔村红外相机布设位点、雪豹核心利用区域的相机位点和岩羊野外计数结果。岩羊野外计数结果来自在2014年4月开展的岩羊调查(Xiao et al, 2022), 粉色圆圈代表岩羊群, 圆圈大小表示群大小。
Fig. 1
Camera locations, core utilization area of snow leopards and blue sheep distribution in Yunta. Data of blue sheep distribution is from the blue sheep survey conducted in April 2014 (Xiao et al, 2022). Pink circles represent blue sheep groups, while circle size indicates group size.
1.2 红外相机调查
使用ArcMap (Version 10.2, ESRI)工具将云塔村三社划分成10个5 km × 5 km的网格(小于雪豹的平均家域面积, 因此可视为最大化雪豹个体独立探测率的布设方案), 在每个网格中选择1-3个红外相机位点(Xiao et al, 2022)。根据村民访谈结果和样线痕迹调查结果, 我们在网格内选择了雪豹出现最频繁的20个位点(图1), 在雪豹最有可能利用的兽径上, 或可能进行刨坑、嗅闻等行为的位置, 以及可能用身体摩擦或用尿液标记的山壁突出石块附近布设了33台相机, 以便雪豹更有可能在镜头前停留较长时间并转身, 留下更多花纹信息(李娟, 2012; Sharma et al, 2014)。监测初期, 我们在13个位点上相对着放置了2台不同型号的相机(Panthera V4; Acorn Ltl 6210), 由于Panthera相机相对较低的探测概率, 在2015年4月后我们统一撤掉了Panthera相机。在2种型号相机对放期间, Panthera相机仅补充了1只雪豹个体记录(即该个体仅被1台Panthera相机拍摄到, 未被对应的Acorn相机拍到), 因此相机型号的不同和相机撤除对监测结果的影响不会太大。相机维护和照片收集交由经过培训的牧民监测员执行, 每3个月由山水自然保护中心的工作人员前去找牧民监测员收集1次拍摄到的照片, 同时检查有无相机设置错误并调整。
1.3 数据分析
1.3.1 雪豹个体识别
为了通过尽可能多的影像信息达成尽可能准确的个体识别, 我们对5年监测期间回收的所有雪豹照片进行了个体识别。收回红外相机数据后, 我们从中提取出雪豹照片, 并依据雪豹身上天然花纹的形状和分布, 人工肉眼识别雪豹个体(Jackson et al, 2006; 李娟, 2012; Sollmann et al, 2012), 主要关注头部、左侧面、右侧面和尾部等花纹最清晰、特征明显而易于辨认的部位(图2), 四肢花纹等也可作为辅助信息。拍到清晰而完整的头部、左侧面、右侧面或尾巴的个体被命名并成为已知个体; 一系列连拍中只拍到局部花纹(如前肢、肩膀等)的个体, 视为不确定个体, 留待与后续照片比对; 整个连拍系列均模糊而无法辨认花纹的照片则舍弃不用。
图2
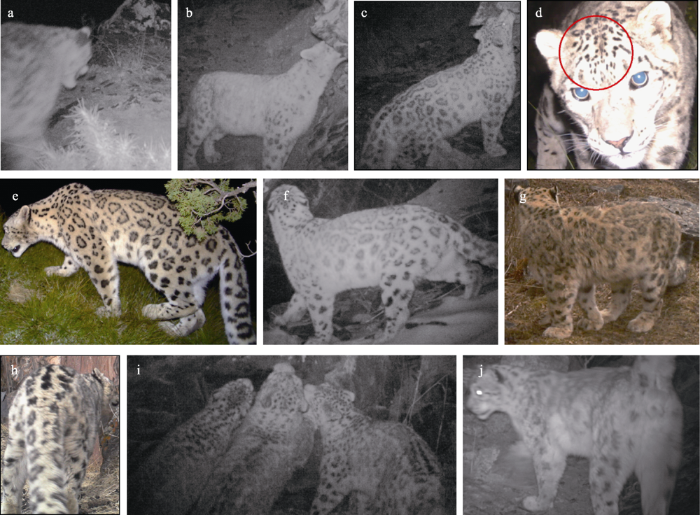
图2
雪豹照片个体识别示例。a: 模糊照片; b: 不确定个体; c: 已知个体和侧面花纹; d: 头部花纹; e、f: 相同个体; e、g: 不同个体; h: 尾部花纹; i: 带崽雌性; j: 雄性和雄性生殖器。
Fig. 2
Examples of individual identification of snow leopards. a, Blurry photos; b, Unknown individuals; Patterns of known individuals on flanks, head, tail in c, d, h, respectively; Same individual in e, f; Different individuals in e, g; i, Female with cubs; j, Male and its testis.
为尽量减少错误识别, 避免影响种群数量和密度估计(Johansson et al, 2020), 我们每识别一系列新照片时, 均和各已知个体比对, 仅当尾部或头部花纹完全相同, 或侧面有3处以上花纹相同时才视为同一只, 而只要有一处花纹不同就视为两只不同个体(Sharma et al, 2014) (图2)。为降低主观性造成的影响, 进一步提高个体识别的可靠性, 第一人识别完成后交由第二人对结果进行独立的检查和查重, 若两人识别结果不一致, 则讨论至形成统一意见。最后建立个体档案和个体图鉴, 记录个体命名、出现的时间和位点、性别、家族关系等, 收录个体最清晰且特征明显的花纹图片。本研究中将可以明确观察到雄性生殖器官的个体确认为雄性, 并将带幼崽的个体确认为雌性(图2)。
被命名的已知个体中, 部分个体仅有左侧、右侧、尾部和头部中某几个部位的花纹信息, 有重复计数同一个体的可能, 因此我们进一步统计了已知个体被拍摄到花纹的部位, 分别统计具有左侧、右侧、尾部和头部花纹的雪豹个体数, 选择识别个体数最多的部位, 保留具有该部位花纹的雪豹个体, 避免高估种群数量和密度。
1.3.2 种群密度和数量估计
从2017年4月开始, 监测出现了相机编号混淆和位置信息缺失的情况, 因此选择数据质量相对较好的2015年、2016年和2017年三年的雪豹个体识别结果进行种群密度和数量估计。本研究使用单季节空间标记-重捕模型(spatially explicit capture-recap- ture model, SECR) (Borchers & Efford, 2008; Royle et al, 2009; Borchers, 2012)估测云塔村雪豹每年的种群密度和数量。目前, SECR模型被普遍认为是大型动物种群密度估计的最佳方法, 其克服了传统标记-重捕模型在计算真实取样面积时的局限(Royle et al, 2009)。Sollmann等(2012)同时使用实测和模拟数据探究红外相机阵列面积对SECR模型参数估计的影响, 研究表明: 当阵列面积接近或略大于个体在研究期间的移动范围时, 模型即可具有良好表现, 即相比于需要数倍于目标物种平均家域的调查面积的传统标记-重捕模型, SECR模型所需调查面积较小。
为满足种群闭合假设, 输入模型的数据时间范围不宜过长, 但模型需要保证一定的数据量和空间重捕率(Sollmann et al, 2012)。参考已发表的工作(Jackson et al, 2006; Sharma et al, 2014; Alexander et al, 2015; Sharma et al, 2015), 我们在每年的数据中截取3个月输入模型, 以模型估测结果代表该年云塔村雪豹种群的情况。月份选择标准有二: (1)数据质量较好, 即相机工作的台数和天数较多, 雪豹捕获次数和捕获率较高; (2)为排除季节干扰进行年间比较, 每年需选择相同或相近月份的数据。最终选择用2014年12月至2015年2月, 2016年1-3月和2017年1-3月的数据代表各自所在年份的情况(附录1)。
模型运算在Rstudio (Version 1.2.5033)环境下应用R程序包camtrapR和secr实现。secr包结合个体捕获历史记录和监测到每个个体的位置, 使用最大似然估计的标记-重捕方法来估计物种密度。该方法通过估计g0 (λ0, 在活动中心的探测概率)和sigma (σ, 尺度参数, 反映探测概率随到活动中心距离的增加而减小的速率)估算种群密度, 解决了传统上非空间模型中采样区域大小影响密度估计准确性的问题。我们使用secr包中suggest.buffer功能, 基于g0和sigma并选择半正态探测函数(half normal detection function), 确定合适的缓冲区(buffer)宽度和估算采样区域(mask)面积, 使活动中心在mask外的个体被探测到的概率为0, 并保证种群密度估算结果的稳定性。本研究的目的是在一片相对均质的栖息地内进行当地的雪豹种群密度估计, 并与历史数据进行对比, 不涉及推广到更大区域预测雪豹密度的应用, 因此假设雪豹密度在本研究区域内分布无空间异质性, 选择使用零模型对雪豹密度与探测概率进行估计。同时考虑到用于拟合模型参数的数据量有限, 假设与sigma相关的参数恒定, 无个体异质性。
1.3.3 种群动态分析
我们使用多区段(multi-session) SECR模型, 基于2014年12月至2015年2月, 2016年1-3月和2017年1-3月三个时期的数据估算了种群增长率; 并基于雪豹个体信息, 分析了个体更替、领域变化、幼崽出生情况等方面的种群动态信息。
为分析5年监测期间种群中个体更替情况, 我们绘制了成年个体累积曲线, 观察累计监测到的雪豹成年个体数是否随监测时间增加而趋于稳定; 同时具体统计了每个个体的拍摄日期, 确定各个体是否在监测范围内稳定居留。我们利用R程序包camtrapR提取照片信息, 输出“雪豹个体-捕获时间-捕获地点”的个体信息表格, 并基于该表格绘制了个体更替图。为定量描述个体更替现象, 我们计算了个体更替率(某年被拍摄到的个体中在次年未被再次拍摄到的个体所占比例)。我们还进一步根据个体被拍摄到的时间和次数, 定义了三类个体: (1)将仅被捕获1次或出现不超过1个月的个体定义为过境个体; (2)将连续捕获时长大于1个月但不超过1,000天的个体定义为短期居留个体; (3)将首末次捕获时间间隔在1,000天以上且中间无连续1年以上捕获间隔的个体定义为定居个体。红外相机探测历史无法完全代表个体在云塔村存在的真实时长, 该定义仅为了更方便地讨论个体更替现象。
为分析监测期间个体领域分布是否发生了变化, 我们根据最小凸多边形法(minimum convex polygon, MCP)的原理, 在ArcMap (V10.7.1)中连接各个体出现位点的最外侧位点, 以构成该个体的最小领域边界, 分析种群内个体的领域分布, 并结合各个体出现时间, 绘制各年领域分布, 分析领域变化情况。需要指出的是, 根据相机位点绘制个体领域分布的方法较为粗略, 仅能反映监测范围内相机探测到雪豹的位点, 来初步估计其保守活动范围。领域变化的分析只使用了2013年10月至2017年4月监测位点信息明确的数据。
为了解5年监测期间种群中幼崽出生情况, 我们记录了非独立个体的拍摄位点、时间和它们跟随的雌性雪豹个体。基于雪豹的产崽期(4-6月)和生活史信息(Johansson et al, 2021), 并根据拍摄到雪豹幼崽的月份、形态特征和体型大小, 我们估测幼崽的年龄和出生时间, 并统计各年出生的幼崽数量。
2 结果
2.1 个体识别
2013年10月至2019年1月共拍摄到4,362张雪豹照片, 包含795次独立捕获, 其中547次捕获可识别个体, 识别率为69%。共识别出50只个体, 其中10只具有完整的左右两侧、尾部、头部的花纹信息, 其他个体缺失其中一个或几个部位的信息, 最终保留了具有清晰完整尾部花纹的35只个体(附录2)。30只为成年个体, 5只在被初次捕获时为幼崽(其跟随的雌性雪豹个体和推算的出生时间见附录3), 其中2只幼崽在成年后被成功再次识别到, 1只幼崽截至2019年1月尚未独立, 未获得其余2只幼崽成年后的识别记录。30只成年个体中共有14只可确定性别, 其中9只为雄性, 5只为雌性(详见图3c)。
图3
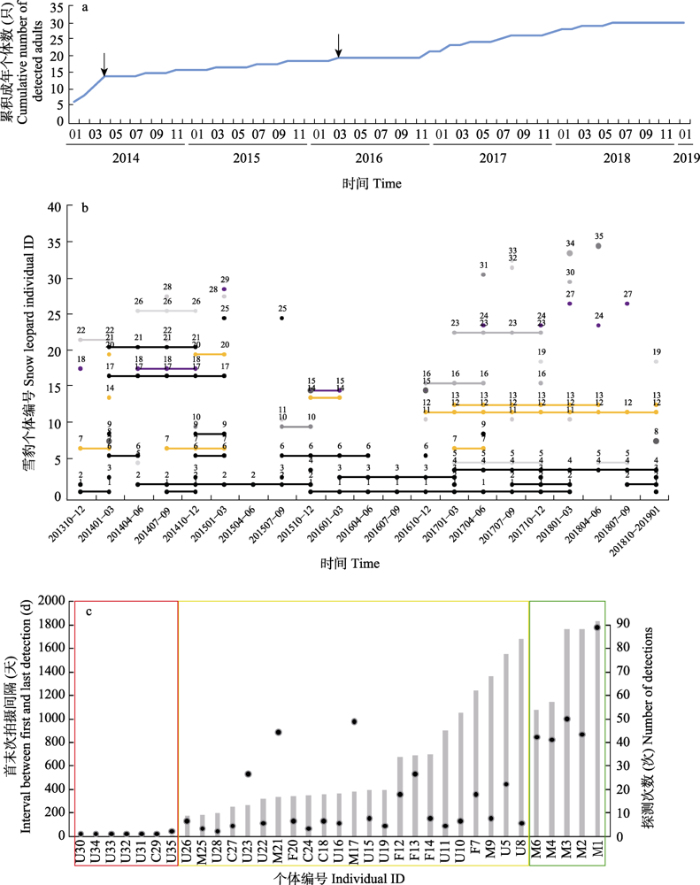
图3
云塔村雪豹种群的个体更替。(a)云塔村雪豹种群成年个体累积曲线。箭头表示2只幼崽成年后首次被识别到的时间。(b) 云塔村雪豹个体拍摄历史。黑色代表雄性, 黄色代表雌性, 初次拍摄到时为幼崽的个体显示为紫色, 其他个体显示为灰色。连线表示雪豹个体在多个季度连续出现。(c)云塔村雪豹首末次拍摄之间时长(柱状图)和拍摄次数(散点图)。红框表示过境个体, 黄框表示短期居留个体, 绿框表示定居个体。雌性、雄性、性别未知个体和幼崽的编号分别以字母F、M、U和C开头。
Fig. 3
Individual turnover of the snow leopard population in Yunta. (a) Adult individual cumulative curve of Yunta snow leopard population. Arrows show the time when the two cubs were first recognized in adulthood. (b) Detection history of snow leopard individuals in Yunta population. Males were shown in black, females in yellow, cubs in purple, and others in gray. Connected points indicate continuous detections in multiple seasons. (c) Numbers of detections (points) and interval time between the first and last encounter of each snow leopard individual (bars). Transits, short-term residents and long-term residents were framed in red, yellow and green, respectively. Individuals numbered with F, M, U and C are females, males, individuals of unknown sex and cubs, respectively.
2.2 种群动态
SECR模型估测2015-2017年云塔村成年雪豹平均种群数量在12-16只之间, 平均种群密度在2.6-5.4只/100 km2之间, 种群增长率为1.02 (表1)。
表1 SECR模型估测的云塔村雪豹种群数量和密度
Table 1
| 2014.12-2015.2 | 2016.1-2016.3 | 2017.1-2017.3 | |
|---|---|---|---|
| 种群数量(只) Population size | 16 ± 4 | 18 ± 8 | 16 ± 5 |
| 种群密度 Population density (inds./100 km2) | 3.2 ± 1.2 | 5.5 ± 2.9 | 4.6 ± 1.9 |
| 成年个体数量(只) Adult population size | 12 ± 3 | 15 ± 7 | 16 ± 5 |
| 成年个体密度 Adult population density (inds./100 km2) | 2.6 ± 1.1 | 5.4 ± 2.9 | 4.6 ± 1.9 |
| 缓冲区宽度 Buffer width (km) | 6.634 | 5.173 | 5.252 |
2.2.1 个体更替
2.2.2 领域取代
在数据位置信息明确的2013年10月至2017年4月内, 有5只雄性雪豹(M1、M2、M3、M17、M21)在3个及以上位点被捕获, 从而连成面积较大的、呈面状的领域。在监测的第一、二年间, 云塔雪豹种群中发生了领域取代事件。第一年中, M2、M17、M21号雪豹占有较大领域, 互相少有重叠, 将调查范围大致分隔成3片区域, 此时M1在3片领域的边缘、M3在3片区域的交汇处被分别拍摄到(图4a)。第二年中, M17和M21消失, M17原有的领域被M2和M3占据, M21原有的领域被M1和M3占据(图4b)。第三年无其他具有较大领域的雪豹个体出现, 但M1、M2、M3出现的范围明显减小(图4c)。统计表明这一活动范围的缩小并非由相机工作台数或天数、雪豹探测次数或探测率等降低导致(附录5)。
图4
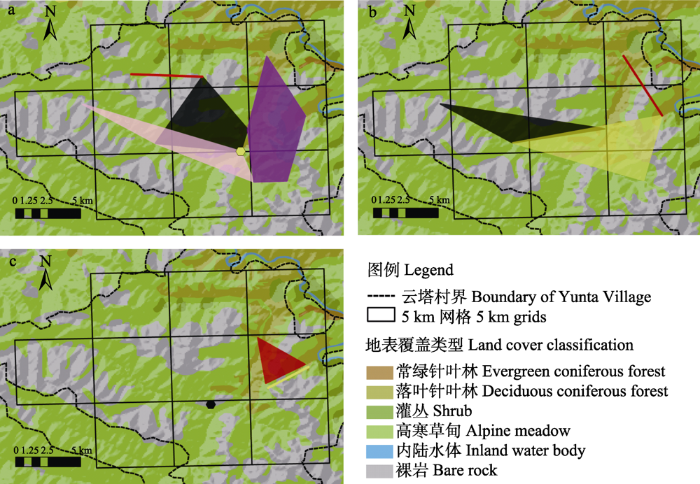
图4
云塔雪豹种群在监测第1年(a)、第2年(b)、第3年(c)记录到的领域取代现象。每只个体用不同颜色表示(M1: 红色; M2: 黑色; M3: 黄色; M17: 粉色; M21: 紫色)。
Fig. 4
Territory replacement recorded in the first year (a), second year (b) and third year (c) in Yunta. Different individuals were shown in different colors (M1, Red; M2, Black; M3, Yellow; M17, Pink; M21, Purple).
2.2.3 核心利用区域
表2 各位点雪豹探测率和个体数(黑体表示雪豹集中利用位点)
Table 2
| 相机位点 Camera site | 工作天数 Working day | 探测次数 Detections | 探测概率 Detection rate | 雪豹个体数 Individual number |
|---|---|---|---|---|
| 4002 | 462 | 48 | 0.1039 | 7 |
| 4013 | 891 | 84 | 0.0943 | 7 |
| 4004 | 550 | 31 | 0.0564 | 7 |
| 4010 | 916 | 27 | 0.0295 | 7 |
| 4003 | 411 | 41 | 0.0998 | 6 |
| 4001 | 700 | 61 | 0.0871 | 6 |
| TQL | 644 | 31 | 0.0481 | 6 |
| 4015 | 444 | 13 | 0.0293 | 5 |
| 4009 | 620 | 6 | 0.0097 | 5 |
| 4007 | 489 | 17 | 0.0348 | 4 |
| 4014 | 492 | 12 | 0.0244 | 4 |
| 4016 | 521 | 10 | 0.0192 | 3 |
| 4018 | 560 | 21 | 0.0375 | 2 |
| 4006 | 501 | 16 | 0.0319 | 2 |
| 4005 | 556 | 5 | 0.0090 | 2 |
| 4008 | 176 | 4 | 0.0227 | 1 |
| MCG | 241 | 3 | 0.0124 | 1 |
| 4019 | 223 | 8 | 0.0359 | 0 |
| 4012 | 453 | 3 | 0.0066 | 0 |
| 4011 | 243 | 0 | 0 | 0 |
3 讨论
本研究是国内首个雪豹种群动态研究, 系统地整理和分析了云塔村雪豹种群2013年10月至2019年1月的红外相机监测数据。其中2015-2017年数据的质量符合空间标记-重捕模型(SECR)的要求, 模型估测结果显示种群大小在这3年间较为一致, 是否长期稳定有待进一步监测。
但在种群大小一致的同时, 整个监测期间云塔雪豹种群内部发生着明显的动态变化。一方面, 种群迁入率和迁出率较高; 另一方面, 个体更替和领域取代等现象一再发生。由于本研究的监测时间较长, 可以确定监测范围内不断有新的成年个体出现, 也有个体不再出现。新出现的成年个体中可以确定有2只在云塔出生, 不排除有监测到过但花纹模糊无法识别的幼崽(3只, 推测成年时间分别约为2016年4月、2016年4月和2018年4月)长成的成年个体。除此之外, 新增成年雪豹中以外来个体为主。不再出现的个体数也远高于正常雪豹种群的自然死亡率(Sharma et al, 2014), 迁出的占比可能更大。总体来说, 云塔雪豹种群中长期稳定栖息的个体较少, 并可能有较多迁入和迁出的情况。本研究也可以确定监测期间发生了个体在领域被其他个体占据后不再出现的事件。部分个体无法建立或维持领域, 在竞争中失败而离开或死亡, 可能是造成观察到的个体更替现象的原因之一(Harmsen et al, 2020)。
监测期间, 过境个体和短期居留个体占多数, 迁入和迁出较多, 我们推测导致这种现象的原因有三: 其一, 推测云塔村可能处在雪豹迁徙扩散的通道上, 其他种群雪豹迁移经过云塔村, 其中通天河在结冰期可能被东西两侧的雪豹种群用作往来交流的通道(李娟, 2012), 同时北岸雪豹个体也可能在结冰期通过通天河和云塔种群交流。其二, 本研究相机布设范围较小, 可能未覆盖一些雪豹的全部家域, 导致其探测率不稳定。其三, 云塔村的岩石类型主要为页岩, 所形成的天然洞穴很少, 然而岩羊种群密度较高(8.67只/km2; 肖凌云, 2017)。食物资源充足却缺乏合适的雪豹育崽巢址, 可能也是导致该地雪豹种群中过境与短期居留个体多而长期居留个体较少的原因之一。
本研究发现云塔村有7个位点被雪豹利用最多(图1), 这些位点彼此相邻, 共同组成了一片雪豹核心利用区域, 雄性雪豹的领域取代也围绕这片区域进行(李娟, 2012)。为探讨核心利用区域的形成原因, 本研究收集了云塔村2014年的岩羊调查结果(Xiao et al, 2022), 根据已有研究, 在三江源地区, 岩羊是雪豹的主要野生猎物, 岩羊密度是小尺度上影响雪豹分布的主要因素之一(李娟, 2012)。该核心利用区域位于三条山谷交汇处, 西部是云塔村岩羊密度最高的区域之一, 东部由于地形阻隔没有进行岩羊计数, 但已知人类活动极少, 野生动物密度高。Jackson (1996)在尼泊尔基于雪豹颈圈数据的研究表明, 雪豹的家域之间会彼此重叠, 形成多个个体共同利用的核心区域, 这样的区域通常位于雪豹活动地区的河流交汇处, 地形有利、食物丰富。
目前国内外雪豹监测中对新生雪豹幼崽数量的报道较少, 蒙古托斯特山持续4年的监测工作中拍摄到至少13只成年雪豹个体和21只幼崽(Sharma et al, 2014); 吉尔吉斯斯坦一项持续3年的雪豹监测工作拍摄到至少5只成年个体和3只幼崽(Rode et al, 2021); 甘肃祁连山国家级自然保护区在19个月的监测中拍摄到10-12只成年个体和2只幼崽(Alexander et al, 2016b)。相比之下, 本研究得到的云塔村雪豹种群新生幼崽数较低。雪豹幼崽出生时间临近虫草季, 云塔村每年在这段时间会有大量外来人员进山采虫草, 这可能使雌雪豹偏向选择不在云塔村产崽。但从2018年开始, 云塔村不再允许外来人员采虫草, 这一变化是否会影响云塔村雪豹新生个体数量和位置, 有待继续观察。此外, 云塔村陡峭的山壁及其岩石类型不利于形成育崽洞穴, 这可能也是限制云塔新生个体数的因素之一。
本研究体现出了长期监测的一些优势。长期监测可以通过照片的累积补全同一个体不同角度的花纹和性别等信息, 避免个体误判, 有助于全面而准确的个体识别; 还能通过对个体的长期追踪实现对雪豹种群内部动态变化的了解, 如本研究中发现的个体更替、领域取代等; 此外, 相对于一个时间截面上的短期调查, 长期监测可以区分出实际的定居个体, 避免过境与短期居留个体影响对当地种群情况的判断。
本研究也存在一些不足之处。主要体现在: (1)分析数据时我们发现, 部分雪豹个体在不同相机位点上的重捕次数较少, 可能导致空间标记-重捕模型对两个主要参数g0 (λ0)和sigma (σ)的估测结果不够准确, 未来可考虑扩大监测范围(Suryawanshi et al, 2019)和适当加密相机位点来得到更为准确的模型结果。(2)通过简单连接雪豹拍摄位点进行的雪豹领域分析比较粗略, 只是对调查区域内雪豹个体活动范围的保守估计。(3)牧民监测员在自己行动期间可能出现相机设置错误, 请亲友帮忙或监测员间互相帮忙放相机导致编号混淆, 长距离移动相机位置但没有记录新坐标等问题, 这些情况较难完全避免。因此, 开展基于社区的监测工作时, 需做好充分的培训, 并及时向社区反馈问题, 迅速调整。但上述局限性不影响本研究的主要结论: 在监测范围内, 云塔雪豹种群虽然维持着表面数量的稳定, 但种群内部个体更替和领域变化明显, 是一个不断发生着动态变化的种群。
全球范围内, 雪豹栖息地与畜牧业分布区高度重叠, 在三江源地区也是如此(Xiao et al, 2022), 本研究为三江源及更大范围的雪豹栖息地提供了基于当地牧民社区的雪豹长期监测案例。云塔村社区雪豹监测在2019年1月后仍在继续, 截至本文2022年9月成稿, 已连续开展了将近9年, 这有赖于科研机构和保护组织的坚持, 也离不开牧民对雪豹的正面态度和保护热情, 未来应努力继续维持并进一步激发牧民参与雪豹保护的动力, 保持和提高监测稳定性及数据质量, 以支持对雪豹种群的更深入研究, 为保护行动提供更为科学的指导。
附录 Supplementary Material
附录1 监测期间各月份的调查努力和雪豹拍摄情况
Appendix 1 Survey efforts and data size in each month during the monitoring period
附录2 初步识别个体花纹信息完整度统计
Appendix 2 Statistics of pattern completeness of preliminarily identified individuals
附录3 监测期间拍摄到雪豹幼崽数量和母亲个体、拍摄时间及推算的幼崽出生时间
Appendix 3 Snow leopard cubs detected during the monitoring period and their mother, date of first detection, inferred birth time of the cubs
附录4 云塔雪豹种群的个体更替率
Appendix 4 Individual turnover rates of snow leopard population in Yunta
附录5 云塔三年相机工作情况和雪豹拍摄与识别情况
Appendix 5 Camera working days and snow leopard encounters each year in Yunta
致谢
本监测项目受到青海省千人计划创新创业团队-三江源国家公园管理局柔性引进人才项目、科技部重点研发项目、华泰证券“一个长江”项目、字节跳动公益、阿拉善SEE三江源项目中心的支持。感谢三江源国家公园管理局、玉树州林业和草原局、玉树市以及哈秀乡当地各级政府对本研究野外数据采集提供的大力支持, 感谢云塔村社区监测队员们持续的数据收集和管理, 山水自然保护中心加公扎拉、达哇江才、更尕依严等同事在社区培训工作中做出的贡献, 感谢参与红外相机数据分析的志愿者们。
参考文献
Conservation of snow leopards: Spill-over benefits for other carnivores?
DOI:10.1017/S0030605315001040 URL [本文引用: 1]
Face value: Towards robust estimates of snow leopard densities
A granular view of a snow leopard population using camera traps in Central China
DOI:10.1016/j.biocon.2016.02.023 URL [本文引用: 2]
A non-technical overview of spatially explicit capture-recapture models
DOI:10.1007/s10336-010-0583-z
[本文引用: 1]

Most capture-recapture studies are inherently spatial in nature, with capture probabilities depending on the location of traps relative to animals. The spatial component of the studies has until recently, however, not been incorporated in statistical capture-recapture models. This paper reviews capture-recapture models that do include an explicit spatial component. This is done in a non-technical way, omitting much of the algebraic detail and focussing on the model formulation rather than on the estimation methods (which include inverse prediction, maximum likelihood and Bayesian methods). One can view spatially explicit capture-recapture (SECR) models as an endpoint of a series of spatial sampling models, starting with circular plot survey models and moving through conventional distance sampling models, with and without measurement errors, through mark-recapture distance sampling (MRDS) models. This paper attempts a synthesis of these models in what I hope is a style accessible to non-specialists, placing SECR models in the context of other spatial sampling models.
Spatially explicit maximum likelihood methods for capture-recapture studies
Live-trapping capture-recapture studies of animal populations with fixed trap locations inevitably have a spatial component: animals close to traps are more likely to be caught than those far away. This is not addressed in conventional closed-population estimates of abundance and without the spatial component, rigorous estimates of density cannot be obtained. We propose new, flexible capture-recapture models that use the capture locations to estimate animal locations and spatially referenced capture probability. The models are likelihood-based and hence allow use of Akaike's information criterion or other likelihood-based methods of model selection. Density is an explicit parameter, and the evaluation of its dependence on spatial or temporal covariates is therefore straightforward. Additional (nonspatial) variation in capture probability may be modeled as in conventional capture-recapture. The method is tested by simulation, using a model in which capture probability depends only on location relative to traps. Point estimators are found to be unbiased and standard error estimators almost unbiased. The method is used to estimate the density of Red-eyed Vireos (Vireo olivaceus) from mist-netting data from the Patuxent Research Refuge, Maryland, U.S.A. Estimates agree well with those from an existing spatially explicit method based on inverse prediction. A variety of additional spatially explicit models are fitted; these include models with temporal stratification, behavioral response, and heterogeneous animal home ranges.
Trophic downgrading of planet earth
DOI:10.1126/science.1205106
PMID:21764740
[本文引用: 1]
Until recently, large apex consumers were ubiquitous across the globe and had been for millions of years. The loss of these animals may be humankind's most pervasive influence on nature. Although such losses are widely viewed as an ethical and aesthetic problem, recent research reveals extensive cascading effects of their disappearance in marine, terrestrial, and freshwater ecosystems worldwide. This empirical work supports long-standing theory about the role of top-down forcing in ecosystems but also highlights the unanticipated impacts of trophic cascades on processes as diverse as the dynamics of disease, wildfire, carbon sequestration, invasive species, and biogeochemical cycles. These findings emphasize the urgent need for interdisciplinary research to forecast the effects of trophic downgrading on process, function, and resilience in global ecosystems.
Spatially explicit capture recapture density estimates: Robustness, accuracy and precision in a long-term study of jaguars (Panthera onca)
Home Range, Movements and Habitat Use of Snow Leopard (Uncia uncia) in Nepal
Estimating snow leopard population abundance using photography and capture-recapture techniques
DOI:10.2193/0091-7648(2006)34[772:ESLPAU]2.0.CO;2 URL [本文引用: 3]
Comparison of noninvasive genetic and camera-trapping techniques for surveying snow leopards
DOI:10.1644/10-MAMM-A-036.1 URL [本文引用: 1]
Overview of Sanjiangyuan community-based camera- trapping monitoring platform
DOI:10.17520/biods.2019322 URL [本文引用: 2]
三江源红外相机社区监测平台概述
The timing of breeding and independence for snow leopard females and their cubs
DOI:10.1007/s42991-020-00073-3 URL [本文引用: 1]
Identification errors in camera-trap studies result in systematic population overestimation
DOI:10.1038/s41598-020-63367-z
PMID:32286438
[本文引用: 1]
Reliable assessments of animal abundance are key for successful conservation of endangered species. For elusive animals with individually-unique markings, camera-trap surveys are a benchmark standard for estimating local and global population abundance. Central to the reliability of resulting abundance estimates is the assumption that individuals are accurately identified from photographic captures. To quantify the risk of individual misidentification and its impact on population abundance estimates we performed an experiment under controlled conditions in which 16 captive snow leopards (Panthera uncia) were camera-trapped on 40 occasions and eight observers independently identified individuals and recaptures. Observers misclassified 12.5% of all capture occasions, resulting in systematically inflated population abundance estimates on average by one third (mean ± SD = 35 ± 21%). Our results show that identifying individually-unique individuals from camera-trap photos may not be as reliable as previously believed, implying that elusive and endangered species could be less abundant than current estimates indicate.
Assessing estimators of snow leopard abundance
DOI:10.2193/2008-040 URL [本文引用: 1]
Panthera uncia
Tough times for Tibetan nomads in Western China: Snowstorms, settling down, fences and the demise of traditional nomadic pastoralism
DOI:10.3167/082279400782310674 URL [本文引用: 1]
The rise of the mesopredator
DOI:10.1525/bio.2009.59.9.9 URL
Status and ecological effects of the world’s largest carnivores
Population monitoring of snow leopards using camera trapping in Naryn State Nature Reserve, Kyrgyzstan, between 2016 and 2019
Bayesian inference in camera trapping studies for a class of spatial capture-recapture models
We develop a class of models for inference about abundance or density using spatial capture-recapture data from studies based on camera trapping and related methods. The model is a hierarchical model composed of two components: a point process model describing the distribution of individuals in space (or their home range centers) and a model describing the observation of individuals in traps. We suppose that trap- and individual-specific capture probabilities are a function of distance between individual home range centers and trap locations. We show that the models can be regarded as generalized linear mixed models, where the individual home range centers are random effects. We adopt a Bayesian framework for inference under these models using a formulation based on data augmentation. We apply the models to camera trapping data on tigers from the Nagarahole Reserve, India, collected over 48 nights in 2006. For this study, 120 camera locations were used, but cameras were only operational at 30 locations during any given sample occasion. Movement of traps is common in many camera-trapping studies and represents an important feature of the observation model that we address explicitly in our application.
Vigorous dynamics underlie a stable population of the endangered snow leopard Panthera uncia in Tost Mountains, South Gobi, Mongolia
Does livestock benefit or harm snow leopards?
DOI:10.1016/j.biocon.2015.04.026 URL [本文引用: 1]
Spatial variation in population-density of snow leopards in a multiple use landscape in Spiti Valley, Trans-Himalaya
How does spatial study design influence density estimates from spatial capture-recapture models?
Fear of large carnivores causes a trophic cascade
DOI:10.1038/ncomms10698
PMID:26906881
[本文引用: 1]
The fear large carnivores inspire, independent of their direct killing of prey, may itself cause cascading effects down food webs potentially critical for conserving ecosystem function, particularly by affecting large herbivores and mesocarnivores. However, the evidence of this has been repeatedly challenged because it remains experimentally untested. Here we show that experimentally manipulating fear itself in free-living mesocarnivore (raccoon) populations using month-long playbacks of large carnivore vocalizations caused just such cascading effects, reducing mesocarnivore foraging to the benefit of the mesocarnivore's prey, which in turn affected a competitor and prey of the mesocarnivore's prey. We further report that by experimentally restoring the fear of large carnivores in our study system, where most large carnivores have been extirpated, we succeeded in reversing this mesocarnivore's impacts. We suggest that our results reinforce the need to conserve large carnivores given the significant "ecosystem service'' the fear of them provides.
Sampling bias in snow leopard population estimation studies
DOI:10.1002/1438-390X.1027
[本文引用: 1]
Accurate assessments of the status of threatened species and their conservation planning require reliable estimation of their global populations and robust monitoring of local population trends. We assessed the adequacy and suitability of studies in reliably estimating the global snow leopard (Panthera uncia) population. We compiled a dataset of all the peer-reviewed published literature on snow leopard population estimation. Metadata analysis showed estimates of snow leopard density to be a negative exponential function of area, suggesting that study areas have generally been too small for accurate density estimation, and sampling has often been biased towards the best habitats. Published studies are restricted to six of the 12 range countries, covering only 0.3-0.9% of the presumed global range of the species. Re-sampling of camera trap data from a relatively large study site (c.1684 km(2)) showed that small-sized study areas together with a bias towards good quality habitats in existing studies may have overestimated densities by up to five times. We conclude that current information is biased and inadequate for generating a reliable global population estimate of snow leopards. To develop a rigorous and useful baseline and to avoid pitfalls, there is an urgent need for (a) refinement of sampling and analytical protocols for population estimation of snow leopards (b) agreement and coordinated use of standardized sampling protocols amongst researchers and governments across the range, and (c) sampling larger and under-represented areas of the snow leopard's global range.
Research on snow leopards (Panthera uncia) using camera-trapping in Wolong National Nature Reserve, China
DOI:10.17520/biods.2016313
[本文引用: 1]
Between November 2013 and March 2016, twenty Ltl-6210MC infrared-triggered camera-traps were installed in Wolong National Nature Reserve, Sichuan, China, to monitor snow leopards(Panthera uncia) and other wildlife. A total of 7,056 camera-days of data were collected, including approximately 120,000 photos and video clips. The effective number of snow leopard samples collected by the infrared cameras was 43, and the calculated relative abundance index (RAI) for this species was 6.09. During the 28 months of continuous data collection using infrared cameras, records of snow leopards, including leopard cubs, demonstrated that Wolong National Nature Reserve is a relatively hospitable environment for this species. The analytical results indicate that the annual activity peaked in January, and the daily activity peaked between the hours of 18:00-20:00, and daily activity patterns showed seasonal variations. When considering environmental factors, the preferred habitat is the alpine scree where snow leopards appeared most in the ridge areas and the range of preferred reference temperatures for snow leopard activity was found between -10℃ and -3℃. In addition, the lunar-phase relative abundance index was originally created to assess the appearance of wildlife under different night lightness levels. It was found that the snow leopard is fairly active at night, and the lunar-phase has a significant impact on its level of nocturnal activity (P < 0.01). We provided primary sources for further protection and research of snow leopards and the other wildlife. This study could be utilized to comprehensively learn the ecological characteristics and assess snow leopard habitat.
基于红外相机技术对四川卧龙国家级自然保护区雪豹(Panthera uncia)的研究
DOI:10.17520/biods.2016313
[本文引用: 1]
2013年11月至2016年3月, 在四川卧龙国家级自然保护区内布设20台Ltl-6210MC红外相机, 对雪豹(Panthera uncia)及其同域野生动物进行研究。相机工作日7,056个, 拍摄记录约12万条。雪豹的有效探测43次, 相对多度指数为6.09。28个月中红外相机持续记录到雪豹, 并且记录中还有幼雪豹, 说明卧龙国家级自然保护区雪豹的生存状况较好。数据分析表明, 雪豹年活动高峰是1月, 日活动高峰为18:00-20:00, 日活动节律存在季节差异。关于环境因子, 雪豹偏好生境为高山流石滩, 尤其常见于高山流石滩的山脊, 其活动最适宜的参考温度范围为-10℃到-3℃。此外, 本文提出了月相活动强度指数, 用于评价夜间不同光照强度下野生动物的活动情况。结果显示, 雪豹夜行能力较强, 月相对其夜间活动有显著影响(P < 0.01)。本研究为进一步开展雪豹及其同域野生动物的保护和研究提供了第一手资料, 对全面了解雪豹的生态习性及其栖息地评价有参考意义。
Spatial separation of prey from livestock facilitates coexistence of a specialized large carnivore with human land use
