


准确可信的野外种群数量和密度等基础数据不仅是物种生态学研究的基本问题, 也是管理和保护野生动物、制定具针对性保护策略的重要依据(肖文宏等, 2019)。标记-重捕法(capture-recapture method)是野生动物种群数量和密度研究中一种常用的调查方法(Molles, 2002; Noss et al, 2013)。对身上带有独特花纹的动物, 可以利用红外相机所拍摄的照片进行个体识别, 再通过标记-重捕模型估算其种群数量、密度等(Karanth & Nichols, 1998; Royle et al, 2014)。这项技术在猫科动物的种群研究上应用最为广泛, 如孟加拉虎(Panthera tigris tigris) (Karanth & Nichols, 1998; Wang & MacDonald, 2009)、美洲豹(P. onca) (Tobler & Powell, 2013)、欧亚猞猁(Lynx lynx) (Zimmermann et al, 2013)、虎猫(Leopardus pardalis) (Maffei & Noss, 2008), 也包括我国一些猫科动物, 但主要集中在东北虎(Panthera tigris altaica)、雪豹(P. uncia)以及东北豹(P. pardus orientalis)等旗舰物种(Alexander et al, 2016; Xiao et al, 2016; Wang et al, 2017)。
豹猫(Prionailurus bengalensis)是分布范围最广的猫科物种之一, 其分布区由阿富汗和巴基斯坦, 经过印度次大陆和喜马拉雅山脉向东一直延伸至中国, 向北至俄罗斯远东地区和朝鲜半岛, 向南延伸整个东南亚和马来群岛, 在日本和菲律宾的一些岛屿亦有分布(Ross et al, 2015)。豹猫被IUCN物种红色名录列为无危物种(Ross et al, 2015)。在中国, 豹猫虽然几乎遍布全国, 但仍然面临着捕杀、宠物贸易、路杀和栖息地丧失等威胁因素, 因而在2021年出版的《中国生物多样性红色名录•脊椎动物(第一卷): 哺乳动物(上册)》中被列为易危物种(蒋志刚, 2021), 属国家II级重点保护野生动物。
虽然豹猫是我国分布最广而且最常见的猫科动物, 但对于其野外生态学研究并不多, 有关种群密度的调查更是稀少。近年仅见台湾地区一篇利用红外相机技术对豹猫进行种群密度估算的研究报道①(①刘建男 (2020) 108-109年度石虎保育行动纲领研拟与密度估算研究案成果报告书. 农业委员会特有生物研究保育中心, 台湾.), 以及20世纪八、九十年代利用皮张收购数量估算豹猫种群密度的报道(韩德民等, 1995; 王应祥等, 1997)。而在国外, 近年来不断有利用红外相机技术和标记-重捕模型对豹猫种群密度进行估算的案例, 如婆罗洲(Mohamed et al, 2013)、印度(Bashir et al, 2013; Srivathsa et al, 2015)、新加坡(Chua et al, 2016)、泰国(Petersen et al, 2019)、韩国(Park et al, 2019)等, 为评估各地区豹猫的种群数量和保护现状提供了参考数据。
1 材料与方法
1.1 研究区域概况
研究地点嘉道理农场暨植物园(Kadoorie Farm and Botanic Garden, 下文简称KFBG)地处香港新界中部, 坐落于香港最高峰大帽山北坡, 地理坐标22°25°-22°26° N, 114°06°-114°07° E。KFBG成立于1956年, 当时只是一片饱受多年强烈人为干扰影响的灌草丛; 经过六十多年的森林修复和土地管理工作, 现在已恢复成树木茂盛的森林(图1)。KFBG占地1.48 km2, 地势陡峭, 山脚海拔约150 m, 海拔最高处约680 m; 向南与“大榄郊野公园-大帽山郊野公园-城门郊野公园-大埔滘自然护理区”组成的连片自然保护地(共约87.12 km2)相接壤。当前, KFBG有87%的土地以天然次生林为主, 其余为中低海拔范围的果园和农地(约占6%), 以及人工建筑物区域(办公楼、展览室和动物救助设施等, 约占7%); 有水泥硬化道路约9.2 km (附录1)。最新调查记载KFBG范围内有豹猫、小灵猫(Viverricula indica)、赤麂(Muntiacus vaginalis)等34种野生兽类(艾加里和陈辈乐, 2021), 占香港已知陆生野生兽类总数(51种, 不包括野化的家猫、家狗和家牛)的67% (AFCD, 2021)。
图1
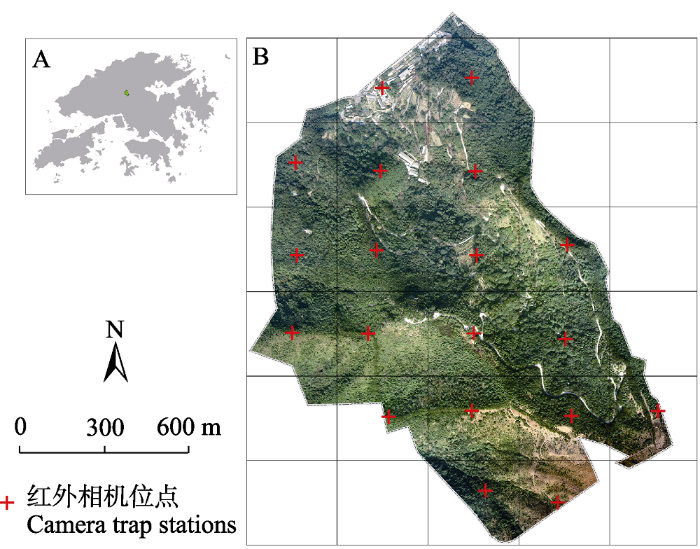
图1
本次调查地点嘉道理农场暨植物园在香港特别行政区的位置(A), 以及嘉道理农场暨植物园的航拍图和红外相机位点分布(B)
Fig. 1
Location of Kadoorie Farm and Botanic Garden in Hong Kong (A); Aerial photo of Kadoorie Farm and Botanic Garden with camera traps layout (B)
1.2 红外相机布置
在KFBG范围划分300 m × 300 m的网格, 在每个网格距离其中心25 m的范围内寻找一处适宜的红外相机架设位点, 各相机位点之间相距250- 350 m, 合计共有19个相机位点(图1, 图2)。在每个位点的动物路径两侧各架设1台红外相机, 两台相机之间的距离约2.5-4 m, 离地高度在30-50 cm之间, 以此获取豹猫身体两侧的花纹照片以进行个体识别(Mohamed et al, 2013; Chua et al, 2016); 调整两台相机镜头呈一个近似“八”字形的斜向, 以此减低闪光灯闪烁对照片的影响(Karanth & Nichols, 1998; Koopmans et al, 2021)。本研究所用红外相机为易安卫士L710, 拍照模式设置为3张连拍, 并在拍照后录制15 s视频, 灵敏度设置为高。相机的架设时间为2020年6月2日至2021年5月31日, 每间隔2个月检查1次相机位点, 更换相机电池和数据储存卡。
图2
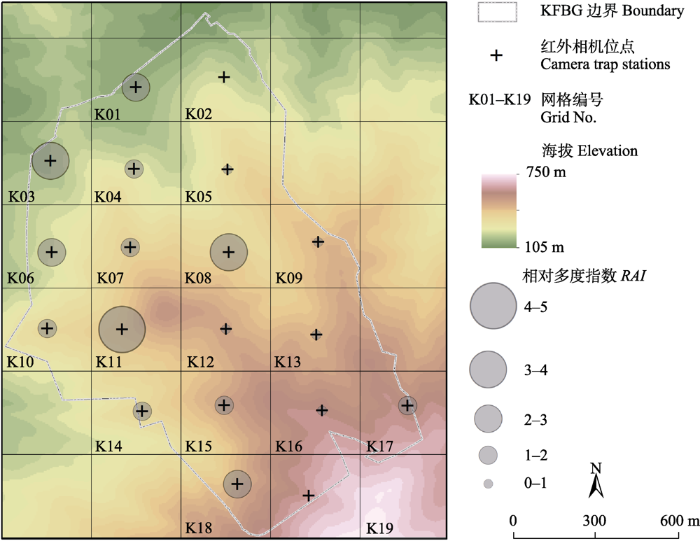
图2
豹猫相对多度指数在嘉道理农场暨植物园的空间分布
Fig. 2
Spatial distribution of RAI (relative abundance index) of leopard cats in Kadoorie Farm and Botanic Garden
1.3 数据筛选及相对多度指数的计算
1.4 个体识别方法
1.5 种群密度分析
表1 2020年6月至2021年5月各采样期所拍摄的豹猫事件结果统计
Table 1
| 采样期 Sampling period | ||||||
|---|---|---|---|---|---|---|
| 1 | 2 | 3 | 4 | 5 | 6 | |
| 采样天数 No. of sampling days | 2 Jun 2020-31 Jul 2020, 60 days | 1 Aug 2020-30 Sept 2020, 61 days | 1 Oct 2020-30 Nov 2020, 61 days | 1 Dec 2020-31 Jan 2021, 62 days | 1 Feb 2021-31 Mar 2021, 59 days | 1 Apr 2021-31 May 2021, 61 days |
| 有效拍摄事件次数 No. of capture events | 18 | 17 | 25 | 17 | 19 | 17 |
| 可识别个体的拍摄事件 No. of capture events of identified individuals | 15 | 9 | 12 | 5 | 11 | 8 |
| 豹猫个体数 No. of identified individuals of leopard cat | 4 | 6 | 6 | 3 | 5 | 4 |
选择空间标记-重捕模型(spatially explicit capture-recapture, SECR)进行种群密度估算。相对于传统的标记-重捕模型(non-spatial capture-recapture, CR), SECR仅需要获取所有红外相机位点以及重捕个体的精确位置, 便可通过模型估计种群密度(Efford et al, 2004; Borchers & Efford, 2008; Royle et al, 2014); 此外, SECR估算的密度值对采样面积敏感度不高, 并不要求采样面积为目标物种家域范围的数倍以上, 甚至采样面积仅有其家域范围的一半亦可得到较为准确的密度估算; 所以SECR在应用上的灵活性更高, 在近年得到广泛的应用(Sollmann et al, 2012; Zimmermann et al, 2013; 肖文宏等, 2019; Koopmans et al, 2021)。
将各个采样期的豹猫捕获历史和全部红外相机位点的坐标数据导入DENSITY 5.0软件(Efford, 2012;
1.6 活动节律分析
依据统计所得数据计算各个月份豹猫的相对多度指数, 以此分析豹猫的月份活动强度差异。此外, 基于核密度估计方法(kernel density estimation), 利用R 4.1.0软件的overlap包比较旱季(10月至翌年3月)和雨季(4-9月)之间的豹猫日活动节律差异程度; 使用activity包的compareCkern ()函数, 利用Wald检验(Wald Test)进行概率检验以分析两组数据差异的显著性(陈立军等, 2019a)。由于样本数量少于75个, 重叠系数(Δ)使用了Δ预测值(Ridout & Linkie, 2009)。考虑到在不同季节香港的日出时间/日落时间相差较大(最大相差约1.5 h), 在分析前我们使用maptools包和suntime函数对每个拍摄事件的时间根据当天的日出日落时间进行校正, 并将日出和日落调整为π/2和3π/2 (Nouvellet et al, 2012)。基于校正后的记录时间, 我们将豹猫的活动时间分为3个不同时间段: 日间(日出后1 h至日落前1 h之间)、夜间(日落后1 h至日出前1 h之间)、晨昏段(日出前后1 h之内以及日落前后1 h之内); 并以此分析豹猫的日活动节律(Ikeda et al, 2016)。
2 结果
2.1 相机捕获结果统计
图3
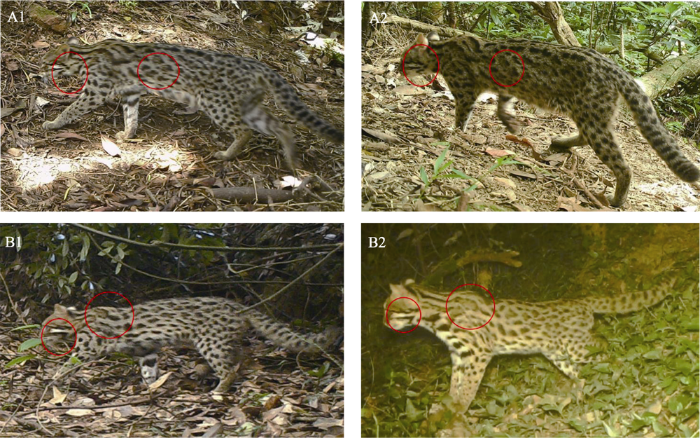
图3
两只豹猫个体LC-2 (A1, A2)和LC-3 (B1, B2)在两次不同拍摄事件的影像
Fig. 3
Two distinct individuals of leopard cat, LC-2 (A1, A2) and LC-3 (B1, B2) as part of two different camera-trap capture events
2.2 豹猫在KFBG的空间分布
通过对单个网格内豹猫的相对多度指数(RAI)计算, 我们获得豹猫在KFBG范围内的空间利用强度分布图(图2)。在全部19个网格中, 仅有2个网格(K02和K19)未拍摄到豹猫, 整体网格占有率(grid occupancy)为89.5%。但在进行野外工作时, 我们在距离K02网格中心约70 m和130 m各发现有1处豹猫的固定排便点; 可能由于K02相机位点四周杂草高且繁密, 以致豹猫不进入到红外相机拍摄范围之内。
结果表明, 基本上整个KFBG范围都有豹猫活动, 以中低海拔地区的豹猫活动频率相对较高(图2); 但RAI指数与相机位点海拔高度并未呈现明显的相关关系。网格K11 (RAI = 4.70)、K03 (RAI = 3.97)和K08 (RAI = 3.86)为豹猫利用最多的区域, 其他网格的RAI指数介于0.28-2.83之间。
2.3 种群密度估算
表2 基于空间标记-重捕模型的嘉道理农场暨植物园豹猫种群密度估算
Table 2
| 采样期 Sampling period | 探测函数模型 Detection model | 赤池信息量准则 AIC | 估计值 Estimates | 密度 Population density (inds./km2) | |
|---|---|---|---|---|---|
| 标准误差 SE | 95%置信区间 95% CI | ||||
| 采样期1 Sampling period 1 | 风险率 Hazard rate | 189.9 | 0.64 | 0.31 | 0.26-1.55 |
| 指数 Exponential | 190.7 | 0.66 | 0.36 | 0.24-1.79 | |
| 半正态 Half normal | 193.6 | 0.54 | 0.24 | 0.23-1.24 | |
| 采样期5 Sampling period 5 | 半正态 Half normal | 155.2 | 0.87 | 0.48 | 0.31-2.40 |
| 指数 Exponential | 155.5 | 0.82 | 0.42 | 0.32-2.10 | |
| 风险率 Hazard rate | 157.3 | 0.86 | 0.49 | 0.30-2.45 | |
2.4 豹猫的活动节律
本调查在连续12个月内获得的豹猫有效拍摄事件为113次, 旱季占61次(RAI = 1.82), 较雨季的52次(RAI = 1.56)稍多一些。豹猫在10月份的活动强度最高(RAI = 3.16), 但RAI指数未表现出明显的月份或雨/旱季相关性差异(图4)。
图4
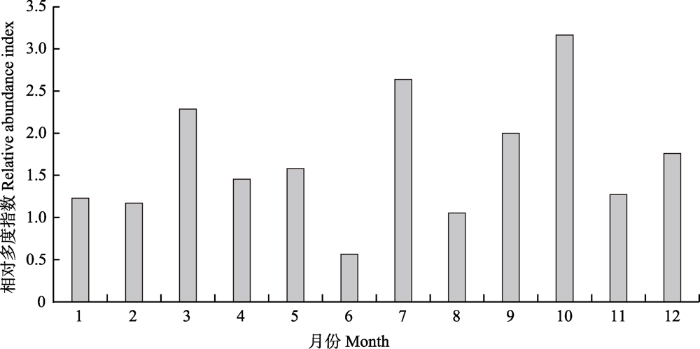
图4
不同月份豹猫的相对多度指数
Fig. 4
Monthly comparison of relative abundance index for leopard cats over a 12-month period
在日活动节律上, 雨季豹猫的日间活动(21次)和夜间活动(22次)频次相接近, 晨昏段则有9次记录。而在旱季, 豹猫的夜间和晨昏活动频率明显增多(分别占59%和23%), 日间活动比例明显减少(从雨季的40.4%下降到18.0%)。结果表明, 雨季KFBG的豹猫并无明显的日活动节律; 而在旱季则偏夜行-晨昏行性多一些, 但亦有一定的日间活动。核密度曲线分析显示, 旱季和雨季间豹猫的日活动节律差异无统计学意义, 即两季之间的日活动节律无显著分化(Δ= 0.82, 95%置信区间为0.69-0.93; P = 0.51, 图5)。
图5
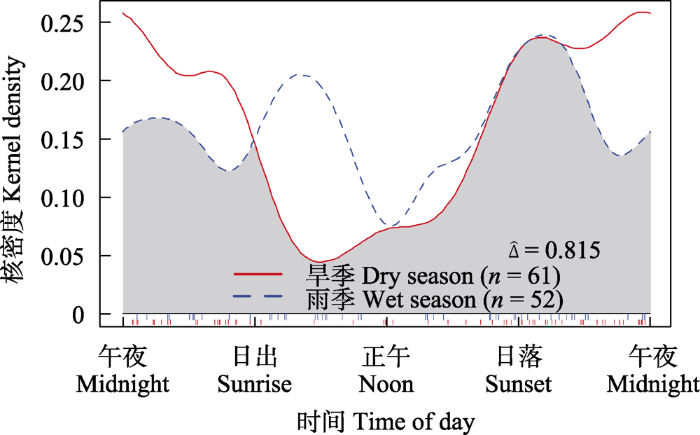
图5
雨季和旱季豹猫的日活动节律比较
Fig. 5
Comparison of leopard cat diel activity patterns between the dry and wet season
值得一提的是, KFBG为对公众开放的景点, 每日09:30-17:00为对游客开放时间。而在对外开放的这7.5 h里所记录的豹猫活动次数明显较低(17次, 约占总数的15%); 显示豹猫的日活动节律存在明显趋避人类的特点, 表明人类活动的强度对豹猫的日活动节律影响较大。
3 讨论
本次研究发现, KFBG的豹猫平均种群密度为0.64-0.87只/km2。对比其他地区同样利用红外相机数据结合标记-重捕模型进行的种群密度研究, KFBG的豹猫种群密度相对较高, 仅略低于新加坡德光岛(Pulau Tekong)的0.89 ± 0.17只/km2 (表3)。毋庸置疑, 各地区豹猫栖息的生境、保护力度、捕食者/猎物的多样性和丰富度、海拔和气候等环境因子均不相同, 其种群密度必然各不相同①(①刘建男 (2020) 108-109年度石虎保育行动纲领研拟与密度估算研究案成果报告书. 农业委员会特有生物研究保育中心, 台湾.)。不少研究发现, 人工林和次生林内豹猫种群密度和活动强度比天然林更高一些; 因为这些人为改造的生境中豹猫的主要食物源——鼠类的密度更高, 而且人工林和次生林中隐藏性高的杂灌丛生境比较多, 为豹猫提供了更多适宜的繁殖场所(Srivathsa et al, 2015; Chua et al, 2016; Park et al, 2019; Silmi et al, 2021)。Chua等(2016)甚至发现豹猫的种群密度与森林郁闭度以及距人工林的距离呈负相关关系。KFBG的中低海拔区有小面积的果园农地、动物救助设施、办公楼等; 这些区域人为活动较多, 鼠类和树麻雀的活动亦较为频繁。除了食物源较为丰富之外, 我们认为KFBG可以容纳更多豹猫个体的另一个解释是中级捕食者释放假说(mesopredator release hypothesis), 即顶级捕食者的消失会导致中级捕食者的生态释放进而提高种群数量(Crooks & Soulé, 1999; Ritchie & Johnson, 2009)。在香港, 虎、豹、大灵猫等原生中大型食肉类早已灭绝(Pei et al, 2010); 而现生的豹猫捕食者和竞争者只剩下某些大型猛禽以及蟒蛇, 但这些物种在KFBG并不常见(艾加里和陈辈乐, 2021)。其他一些中小型猫科动物的研究也有同样的发现, 如对于新加坡的豹猫(Chua et al, 2016)和巴拿马的虎猫(Moreno et al, 2006; Rodgers et al, 2014)的研究。
表3 不同地区利用红外相机数据和标记-重捕模型进行豹猫种群密度估算的比较
Table 3
| 研究地点 Location | 分析模型 Model selection | 密度估算(只/km2) Density estimate (inds./km2) | 资料来源 Sources |
|---|---|---|---|
| 香港嘉道理农场暨植物园, 采样期1 KFBG, Hong Kong, China, Sampling period 1 | SECR | 0.64 ± 0.31 (0.26-1.55) | 本研究 This study |
| 香港嘉道理农场暨植物园, 采样期5 KFBG, Hong Kong, China, Sampling period 5 | SECR | 0.87 ± 0.48 (0.31-2.40) | 本研究 This study |
| 台湾南投县南中寮 South of Zhongliao Township in Nantou County, Taiwan, China | CR | 0.34-0.39 | 刘建男, 2020①(① 刘建男 (2020) 108-109年度石虎保育行动纲领研拟与密度估算研究案成果报告书. 农业委员会特有生物研究保育中心, 台湾.) |
| 台湾南投县北中寮 North of Zhongliao Township in Nantou County, Taiwan, China | CR | 0.38-0.57 | 刘建男, 2020① |
| Sakaerat Biosphere Reserve, Thailand | SECR | 0.18 ± 0.04 (0.12-0.27) | Petersen et al, 2019 |
| Pulau Tekong, Singapore | CR | 0.89 ± 0.17 | Chua et al, 2016 |
| Bhadra Tiger Reserve, India | SECR | 0.10 ± 0.03 (0.05-0.17) | Srivathsa et al, 2015 |
| Biligiri Rangaswamy Temple Tiger Reserve, India | SECR | 0.05 ± 0.01 (0.02-0.07) | Srivathsa et al, 2015 |
| Khangchendzonga Biosphere Reserve, India | SECR | 0.17 ± 0.05 (0.09-0.31) | Bashir et al, 2013 |
| CR | 0.18-0.22 | Bashir et al, 2013 | |
| Tangkulap-Pinangah Forest Reserve, Malaysian Borneo | SECR | 0.12 ± 0.02 (0.10-0.16) | Mohamed et al, 2013 |
| Segaliud Lokan Forest Reserve, Malaysian Borneo | SECR | 0.17 ± 0.02 (0.13-0.21) | Mohamed et al, 2013 |
| Deramakot Forest Reserve, Malaysian Borneo | SECR | 0.10 ± 0.02 (0.07-0.13) | Mohamed et al, 2013 |
本研究进一步证实利用豹猫身体花纹的独特性与不变性, 可以对红外相机拍摄的豹猫照片进行个体识别, 进而通过标记-重捕模型推算其种群密度。利用SECR运行密度估算时, 个体重捕次数越多, 所得到的密度估算越准确(Efford, 2012)。但值得一提的是, 本次研究仅有约一半拍摄事件的照片可以清晰地看出豹猫身上的花纹从而进行个体识别(表1), 以至减少了重捕次数。透过对所有豹猫照片的仔细分析, 我们认为导致一些照片无法进行个体识别的原因主要是: (1)豹猫行走速度过快, 而红外相机快门速度较慢导致照片成像不够清晰, 尤其是在夜间拍摄的照片; (2)相机位点杂草和树枝比较多, 导致豹猫身上花纹容易被遮挡。结合本研究的经验, 我们提出以下建议: (1)采用触发速度、像素更高的红外相机, 而且选择LED白光补光的型号为佳; (2)在相机前面摆放合适的诱饵、诱剂, 以增加豹猫在相机镜头前的停留时间; (3)在符合研究设计要求的前提下, 可以选择豹猫的固定排便点作为相机位点; (4)相机位点应尽量选择在较为开阔的兽道或者人行小径, 可在预测豹猫行走路线的两侧摆设一些障碍物以引导豹猫通过预测道路, 以增加成功拍摄到豹猫两侧花纹的概率; (5)拍照与录像模式相结合, 因为录像模式有机会拍摄到更多不同角度/部位的花纹, 以提高个体识别率和准确度; (6)相机架设后的前2-4周先进行1-2次数据检视, 以掌握豹猫实际行走路线与拍摄角度、距离的关系以及是否有遮挡物等, 再进行适当调整以确保拍摄到最佳的体侧花纹照片。此外, 虽然一些研究提出SECR对采样面积要求不高(Zimmermann et al, 2013), 但我们依然建议红外相机的布设范围还是以超过目标物种的家域范围为宜, 以增加重捕次数。但如果受条件所限而未能扩大采样面积, 则可以近似长方形来布置红外相机的采样范围, 而且长边要大于目标物种的活动范围, 亦可以提高密度估算的精准度(Tobler & Powell, 2013)。
大多数研究报道豹猫的日活动节律为夜行性、夜行-晨昏行性为主(Lynam et al, 2013; Mohamed et al, 2013; Chua et al, 2016; Silmi et al, 2021); 但亦有部分地区的豹猫在白天亦非常活跃, 并未表现出明显的日活动节律(Rabinowitz, 1990; Grassman et al, 2005)。Chen等(2016)报道台湾地区的豹猫在雨季以夜行-晨昏行性为主, 在旱季则无明显的日活动节律; 我们的研究恰恰相反, 即雨季无明显的日活动节律, 旱季则偏夜行性为主, 而且表现出明显的趋避人类活动的行为。KFBG豹猫在雨季的白天活动较多, 可能是因为雨季期间游客比较少的缘故。上述不同研究数据显示, 豹猫是一种适应性很强的物种, 其日活动节律并不会一成不变, 会根据猎物的活动节律和其他因素(如猎物/天敌/竞争者的活动节律、人为活动强度等)进行调整(Rabinowitz, 1990; Grassman et al, 2005; Austin et al, 2007)。
我国是猫科动物大国, 有分布记录的猫科动物多达12种(蒋志刚等, 2016)。但目前绝大多数的野外生态学研究都集中在中大型猫科动物, 对于小型猫科动物关注度较低, 如云猫(Pardofelis marmorata)、豹猫等等。本文亦是已知中国大陆地区首次利用红外相机技术对豹猫种群密度进行估算的研究。当前, 红外相机技术在我国各自然保护区越来越普及, 甚至已经成为许多保护区常规的监测工具之一(肖治术, 2019); 但利用红外相机进行物种种群密度估算的运用尚不普及。我们建议各保护区可根据自身情况对区内一些可进行个体识别的重点物种进行种群密度分析和监测, 而不是简单地依赖存在局限性而且可比性不高的相对多度指数分析(陈立军等, 2019b), 以不断丰富和积累目标物种的基础生态学数据, 为制定相关保育措施提供更多的参考数据。
附录 Supplementary Material
附录1 嘉道理农场暨植物园土地使用图以及红外相机位点分布
Appendix 1 Land use map of Kadoorie Farm and Botanic Garden with camera traps layout
附录2 本研究中分析豹猫种群密度的原始数据
Appendix 2 Raw data for analysing the population density of leopard cat in this study
附录3 基于空间标记-重捕模型的嘉道理农场暨植物园豹猫种群密度估算
Appendix 3 Density estimates of leopard cat in Kadoorie Farm and Botanic Garden using spatial explicit capture-recapture model
参考文献
Checklist of Selected Wildlife at Kadoorie Farm and Botanic Garden, 3rd edn
嘉道理农场暨植物园野生动物名录(第三版)
A granular view of a snow leopard population using camera traps in Central China
DOI:10.1016/j.biocon.2016.02.023 URL [本文引用: 1]
Ecology and conservation of the leopard cat Prionailurus bengalensis and clouded leopard Neofelis nebulosa in Khao Yai National Park, Thailand
Estimating leopard cat Prionailurus bengalensis densities using photographic captures and recaptures
DOI:10.2981/12-098 URL [本文引用: 7]
Spatially explicit maximum likelihood methods for capture-recapture studies
Live-trapping capture-recapture studies of animal populations with fixed trap locations inevitably have a spatial component: animals close to traps are more likely to be caught than those far away. This is not addressed in conventional closed-population estimates of abundance and without the spatial component, rigorous estimates of density cannot be obtained. We propose new, flexible capture-recapture models that use the capture locations to estimate animal locations and spatially referenced capture probability. The models are likelihood-based and hence allow use of Akaike's information criterion or other likelihood-based methods of model selection. Density is an explicit parameter, and the evaluation of its dependence on spatial or temporal covariates is therefore straightforward. Additional (nonspatial) variation in capture probability may be modeled as in conventional capture-recapture. The method is tested by simulation, using a model in which capture probability depends only on location relative to traps. Point estimators are found to be unbiased and standard error estimators almost unbiased. The method is used to estimate the density of Red-eyed Vireos (Vireo olivaceus) from mist-netting data from the Patuxent Research Refuge, Maryland, U.S.A. Estimates agree well with those from an existing spatially explicit method based on inverse prediction. A variety of additional spatially explicit models are fitted; these include models with temporal stratification, behavioral response, and heterogeneous animal home ranges.
Application of camera- trapping data to study daily activity patterns of Galliformes in Guangdong Chebaling National Nature Reserve
DOI:10.17520/biods.2018178 URL [本文引用: 1]
应用红外相机数据研究动物活动节律——以广东车八岭保护区鸡形目鸟类为例
Limitations of relative abundance indices calculated from camera-trapping data
DOI:10.17520/biods.2018327 URL [本文引用: 2]
物种相对多度指数在红外相机数据分析中的应用及局限
Home ranges, movements and activity patterns of leopard cats (Prionailurus bengalensis) and threats to them in Taiwan
DOI:10.3106/041.041.0205 URL [本文引用: 1]
Population density, spatiotemporal use and diet of the leopard cat (Prionailurus bengalensis) in a human-modified succession forest landscape of Singapore
DOI:10.1007/s13364-015-0259-4 URL [本文引用: 7]
Mesopredator release and avifaunal extinctions in a fragmented system
DOI:10.1038/23028 URL [本文引用: 1]
DENSITY 5.0: Software for Spatially Explicit Capture-Recapture
DENSITY: Software for analysing capture-recapture data from passive detector arrays
Spatial organization and diet of the leopard cat (Prionailurus bengalensis) in north-central Thailand
DOI:10.1017/S095283690500659X URL [本文引用: 2]
A investigating on leopard cat in Anhui Province
安徽省豹猫的分布和数量
Seasonal and diel activity patterns of eight sympatric mammals in northern Japan revealed by an intensive camera-trap survey
Red List of China’s Vertebrates
DOI:10.17520/biods.2016076 URL [本文引用: 1]
中国脊椎动物红色名录
DOI:10.17520/biods.2016076 [本文引用: 1]
Estimation of tiger densities in India using photographic captures and recaptures
DOI:10.1890/0012-9658(1998)079[2852:EOTDII]2.0.CO;2 URL [本文引用: 4]
Wild bongo density estimation and population viability analysis improves conservation management
Terrestrial activity patterns of wild cats from camera-trapping
How small is too small? Camera trap survey areas and density estimates for ocelots in the Bolivian Chaco
Density and habitat use of the leopard cat (Prionailurus bengalensis) in three commercial forest reserves in Sabah, Malaysian Borneo
DOI:10.1644/11-MAMM-A-394.1 URL [本文引用: 6]
Competitive release in diets of ocelot (Leopardus pardalis) and puma (Puma concolor) after jaguar (Panthera onca) decline
DOI:10.1644/05-MAMM-A-360R2.1 URL [本文引用: 1]
Noisy clocks and silent sunrises: Measurement methods of daily activity pattern
DOI:10.1111/j.1469-7998.2011.00864.x URL [本文引用: 1]
Where to spot: Individual identification of leopard cats (Prionailurus bengalensis euptilurus) in South Korea
DOI:10.1186/s41610-018-0100-5 URL [本文引用: 2]
The larger mammal fauna of Hong Kong: Species survival in a highly degraded landscape
Estimating leopard cat Prionailurus bengalensis Kerr, 1792 (Carnivora: Felidae) density in a degraded tropical forest fragment in northeastern Thailand
DOI:10.11609/jott.4553.11.4.13448-13458 URL [本文引用: 2]
Notes on the behavior and movements of leopard cats, Felis bengalensis, in a dry tropical forest mosaic in Thailand
DOI:10.2307/2388557 URL [本文引用: 2]
Estimating overlap of daily activity patterns from camera trap data
DOI:10.1198/jabes.2009.08038 URL [本文引用: 1]
Predator interactions, mesopredator release and biodiversity conservation
Comparison of noninvasive genetics and camera trapping for estimating population density of ocelots (Leopardus pardalis) on Barro Colorado Island, Panama
DOI:10.1177/194008291400700408 URL [本文引用: 1]
Prionailurus bengalensis
A Field Guide to the Terrestrial Mammals of Hong Kong
香港陆上哺乳动物图鉴
Activity and ranging behavior of leopard cats (Prionailurus bengalensis) in an oil palm landscape
How does spatial study design influence density estimates from spatial capture- recapture models?
Estimating population sizes of leopard cats in the Western Ghats using camera surveys
DOI:10.1093/jmammal/gyv079 URL [本文引用: 4]
Estimating jaguar densities with camera traps: Problems with current designs and recommendations for future studies
DOI:10.1016/j.biocon.2012.12.009 URL [本文引用: 2]
The use of camera traps for estimating tiger and leopard populations in the high altitude mountains of Bhutan
DOI:10.1016/j.biocon.2008.11.023 URL [本文引用: 1]
A science-based approach to guide Amur leopard recovery in China
DOI:10.1016/j.biocon.2016.03.014 URL [本文引用: 1]
Abundance, sustainable utilization and conservation of leopard cat in Yunnan
Leopard cat (<I>Prionailurus bengalensis</I>) is a small carnivore widely distributed and diversified in eastern and southeastern, Asia. It is one of the important economic furbearing mammals in China. Yunnan, a frontier mountainous province, possesses the most abundant of leopard cat resources in China. There are five subspecies of leopard cat in China, two of them are distributed in Yunnan, <I>P</I>. <I>b</I>. <I>scripta </I>distributed in the North, and <I>P</I>. <I>b</I>. <I>bengalensis </I>in the South and Middle of Yunnan. According to the hides sold per 10 km<SUP>2</SUP> in specific administ rative divisions, from 1973 to 1987, there appeared three abundant areas. The high abundant area (1.9~2.1 hides purchased per 10 km<SUP>2</SUP> ) is in South and Southeast, Yunnan; middle abundant area (0.9~ 1.2 hides purchased per 10 km<SUP>2</SUP>), is in middle and southwestern Yunnan; and the last, lower abundant area (under 0.6 hides purchased per 10 km<SUP>2</SUP>), in the North and Xishuang banna,southern Yunnan. Based on the survey of 16 transectlines in 1992 and the analysis of hides of leopard cats in Yunnan was estimated about 90 000~170 000 animals. The data of hidest rade (from 1954 to1992) also gave us a clue that leopard cat resources would be sustainable in Yunnan if we keep the amount of harvest under 30 000 animals each year, for the average hides purchase during 39 year was 29 988, and showed a stable purchasing trend during these years. In order to make leopard cats a sustainable resources, it is important to put it in the protected animal lists, to enhance resources management and conservation, to establish monitoring systems.
云南豹猫资源量的可持续利用与保护
本文通过标本清理、野外样带数量调查和收购皮张的统计分析, 对云南豹猫的资源量、分布、致危因素、可持续利用、科学管理与保护作了研究。结果表明: 云南的豹猫分为2个亚种即:(1) 指名亚种(Prionailurus bengalensis bengalensis), 分布于云南南部和中部; (2) 川西亚种(P. b.scripta), 分布于云南北部。豹猫在云南各地的分布依数量的多少可分为3个密度区, 数量最多的地区(高密度区) 仅位于云南东南部。根据3种不同测算法的测算, 云南1992年的豹猫资源储量估计为9~17万只。如果每年的猎取量不超过1954~1992年云南豹猫36年的年均毛皮收购量(约3万张), 云南豹猫可以持续地利用而不会造成资源的破坏。把豹猫列入我国国家或省级重点保护野生动物名单、理顺豹猫皮收购、经营、流通和外贸出口的体制, 加强豹猫资源的管理与保护是当前对豹猫资源进行管理以及可持续利用的首要任务。
Capture-Recapture Removal Methods for Sampling Closed Population
Estimating abundance and density of Amur tigers along the Sino-Russian border
DOI:10.1111/1749-4877.12210
PMID:27136188
[本文引用: 1]

As an apex predator the Amur tiger (Panthera tigris altaica) could play a pivotal role in maintaining the integrity of forest ecosystems in Northeast Asia. Due to habitat loss and harvest over the past century, tigers rapidly declined in China and are now restricted to the Russian Far East and bordering habitat in nearby China. To facilitate restoration of the tiger in its historical range, reliable estimates of population size are essential to assess effectiveness of conservation interventions. Here we used camera trap data collected in Hunchun National Nature Reserve from April to June 2013 and 2014 to estimate tiger density and abundance using both maximum likelihood and Bayesian spatially explicit capture-recapture (SECR) methods. A minimum of 8 individuals were detected in both sample periods and the documentation of marking behavior and reproduction suggests the presence of a resident population. Using Bayesian SECR modeling within the 11 400 km(2) state space, density estimates were 0.33 and 0.40 individuals/100 km(2) in 2013 and 2014, respectively, corresponding to an estimated abundance of 38 and 45 animals for this transboundary Sino-Russian population. In a maximum likelihood framework, we estimated densities of 0.30 and 0.24 individuals/100 km(2) corresponding to abundances of 34 and 27, in 2013 and 2014, respectively. These density estimates are comparable to other published estimates for resident Amur tiger populations in the Russian Far East. This study reveals promising signs of tiger recovery in Northeast China, and demonstrates the importance of connectivity between the Russian and Chinese populations for recovering tigers in Northeast China. © 2016 International Society of Zoological Sciences, Institute of Zoology/Chinese Academy of Sciences and John Wiley & Sons Australia, Ltd.
Using capture- recapture models in wildlife camera-trapping monitoring and the study case
DOI:10.17520/biods.2018194 URL [本文引用: 3]
基于标记-重捕模型开展野生动物红外相机种群监测的方法及案例
DOI:10.17520/biods.2018194
[本文引用: 3]
红外相机技术的广泛应用推动了动物种群生态学研究方法的发展和革新, 特别是基于标记-重捕模型框架通过非损伤取样方式对物种数量和密度等种群参数的可靠估计, 为保护濒危物种和评估保护成效提供了有力的科学依据。对于身体上具有独特天然标记的动物(如多数猫科动物), 可依据红外相机拍摄身体上的独特斑点或条纹鉴别个体, 再运用标记-重捕模型, 估计动物种群数量、密度等参数。本文概述了标记-重捕模型的基本原理、特点以及国内外的应用, 特别是近年来发展出的空间标记-重捕模型。总结了从相机布设到数据分析的具体流程、操作原则, 并以青城山家猫为实例, 展示了应用红外相机数据通过空间标记-重捕模型估计种群密度和数量的基本步骤。最后展望了该模型在种群动态、景观廊道设计、资源选择等方面的应用和发展趋势。
Application of camera trapping to species inventory and assessment of wild animals across China’s protected areas
DOI:10.17520/biods.2018329 [本文引用: 1]
红外相机技术在我国自然保护地野生动物清查与评估中的应用
DOI:10.17520/biods.2018329 [本文引用: 1]
Optimizing the size of the area surveyed for monitoring a Eurasian lynx (Lynx lynx) population in the Swiss Alps by means of photographic capture-recapture
DOI:10.1111/1749-4877.12017
PMID:24020463
[本文引用: 3]
We studied the influence of surveyed area size on density estimates by means of camera-trapping in a low-density felid population (1-2 individuals/100 km(2) ). We applied non-spatial capture-recapture (CR) and spatial CR (SCR) models for Eurasian lynx during winter 2005/2006 in the northwestern Swiss Alps by sampling an area divided into 5 nested plots ranging from 65 to 760 km(2). CR model density estimates (95% CI) for models M0 and Mh decreased from 2.61 (1.55-3.68) and 3.6 (1.62-5.57) independent lynx/100 km(2), respectively, in the smallest to 1.20 (1.04-1.35) and 1.26 (0.89-1.63) independent lynx/100 km(2), respectively, in the largest area surveyed. SCR model density estimates also decreased with increasing sampling area but not significantly. High individual range overlaps in relatively small areas (the edge effect) is the most plausible reason for this positive bias in the CR models. Our results confirm that SCR models are much more robust to changes in trap array size than CR models, thus avoiding overestimation of density in smaller areas. However, when a study is concerned with monitoring population changes, large spatial efforts (area surveyed ≥760 km(2) ) are required to obtain reliable and precise density estimates with these population densities and recapture rates. © 2012 Wiley Publishing Asia Pty Ltd, ISZS and IOZ/CAS.
