


揭示宏观尺度生物多样性的维持机制长期以来一直是生态学和生物地理学的核心研究内容(Gaston, 2000; Anderson et al, 2011)。作为生物多样性的重要组分, β多样性度量了植物群落物种组成的时空变化(Whittaker, 1960), 可以为揭示生物多样性维持机制提供重要依据(陈圣宾等, 2010)。过去几十年来, 生态学家已经就植物β多样性的地理分布格局及其形成机制开展了大量卓有成效的研究, 并先后提出大量理论(Qian & Ricklefs, 2012; Tang et al, 2012; Chen et al, 2016; Page & Shanker, 2018), 这些理论大致可以归纳为生态位理论和中性理论两类。生态位理论主要强调气候、土壤等非生物因素的过滤作用、生物间相互作用(如竞争、互惠等)等生态位过程决定着植物β多样性格局(Chase & Leibold, 2003; Kraft et al, 2015; Long et al, 2015)。然而, 中性理论却认为扩散限制、生态漂变等中性过程影响着植物群落β多样性格局的形成(Hubbell, 2006)。目前, 大量研究证实生态位过程和中性过程共同控制着植物β多样性, 但是两者的相对重要性在不同生态系统类型、研究尺度、植物类群间存在显著差异(Steinitz et al, 2006; Legendre et al, 2009; Wang et al, 2021)。
传统植物多样性研究大多从物种多样性的角度开展, 然而物种多样性可能无法完全反映物种间进化、功能特征等的差异, 从而难以准确揭示植物群落构建的成因(Swenson et al, 2012; Purschke et al, 2013)。过去十几年来, 越来越多的研究开始选择系统发育与功能多样性这两个指标来探索植物多样性的维持机制(王均伟等, 2016; Hao et al, 2019; 秦浩等, 2019)。具体而言, 功能多样性可以反映物种自身生理生态过程及其对外部环境的适应策略的差异, 而系统发育多样性反映了物种的亲缘关系和进化历史(Webb et al, 2002; Petchey & Gaston, 2006)。有研究认为功能多样性和系统发育多样性与物种多样性存在高度相关(Losos, 2008)。然而近期的研究表明, 植物物种、功能与系统发育β多样性有着不同的地理分布格局, 并受到不同生态过程的调控(Bernard-Verdier et al, 2013; Wang et al, 2019)。与此同时, 植物物种、功能与系统发育β多样性的关系在不同生态系统类型、研究尺度和植物类群间存在显著差异。因此, 比较植物群落3个维度β多样性的地理分布格局及其调控机制的差异, 将有助于提升我们对植物多样性维持机制的认识(Cavender-Bares et al, 2009)。
青藏高原北部地区分布着大面积的戈壁荒漠, 这些戈壁荒漠生态系统正在遭受气候变化与人类活动的双重影响(Yao, 2019)。相较于我国其他荒漠生态系统, 青藏高原戈壁具有温度相对低、紫外辐射胁迫强、氧分压低、积温少等环境特征(蒋志刚, 2018), 境内植物可能形成了特殊的适应策略和物种共存机制。因此探讨青藏高原北部戈壁植物群落构建机制对预测荒漠生态系统对未来全球变化的响应有着重要意义。目前, 国内生态学家已经就该区域植物区系和物种组成、灌丛谱系结构、植物生理特性等开展了一系列卓有成效的研究(钟泽兵等, 2014; 龙婷等, 2017; 钟悦鸣等, 2017; 吴玉虎和史惠兰, 2018; 肖元明等, 2018)。然而, 受恶劣自然环境与交通条件等限制, 目前还没有专门针对青藏高原北部戈壁植物群落物种、功能与系统发育β多样性大尺度地理分布格局及其调控因素的研究, 特别是不同维度β多样性间的差异。
本研究在中国戈壁综合科学考察、中国黑戈壁生态本底调查等前期研究基础上, 对青藏高原北部主要戈壁植被分布区开展了系统的野外调查和室内分析工作, 获取了61个典型戈壁生境植物群落的物种、功能与系统发育多样性, 以及与之耦合的环境和空间变量数据, 以期探讨以下3个问题: (1)青藏高原北部戈壁植物群落的物种、功能和系统发育β多样性的空间分布格局; (2)各功能性状是否具有系统发育保守性; (3)生态位过程和中性过程对植物群落物种、功能和系统发育β多样性的影响。
1 材料与方法
1.1 研究区域
1.2 调查样点布设与植被调查
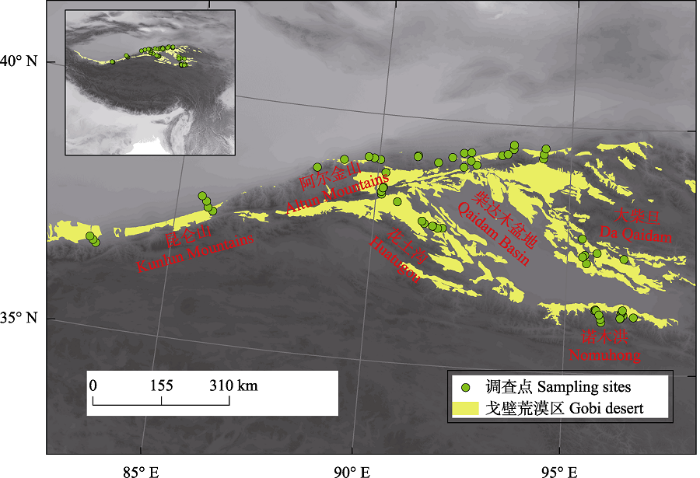
依据青藏高原北部戈壁区植被地理分布特征, 基于2014年中国戈壁生态系统定位观测项目开展的第一次生态本底调查资料设置调查线路, 调查线路尽可能覆盖研究区主要地形地貌和植被类型。于2015-2016年生长季对研究区的昆仑山山麓、阿尔金山山麓、柴达木盆地、花土沟、大柴旦等典型戈壁区进行系统的植被本底调查, 共设置调查样点61个(图1)。在每个调查点, 针对植被组成与生境水土分布情况, 设置3个10 m × 10 m的调查样方, 共计调查183个样方。依据方精云等(2009)群落调查技术规范, 调查和记录样方内所有植物种类、多度、盖度、平均高度等指标, 并记录样点地理坐标、地形特征以及地表砾石盖度等。本次调查包括了红砂、膜果麻黄、梭梭、合头草(Sympegma regelii)、沙拐枣(Calligonum mongolicum)、白刺(Nitrariatangutorum)、紫菀木(Asterothamnus alyssoides)等研究区的主要地带性优势群落类型, 共调查到植物44种, 分属15科35属(附录1), 其中小乔木1种, 灌木18种, 半灌木/小灌木10种, 一年生草本5种, 多年生草本10种。
图1
1.3 植物功能性状测定
针对叶片, 每个物种至少选择10株生长良好的个体, 采集30片健康成熟的叶片样品。采集样品的当天, 通过扫描仪(Epson V800)扫描叶片, 利用ImageJ 1.52a软件(Schneider et al, 2012)计算叶面积, 并测定鲜重。将叶片样品烘干至恒重后测定干重, 通过计算叶面积与叶干重的比值获得比叶面积。针对细根, 本研究通过逐渐移除木本植物茎(直径 ≤ 2 mm)干附近土壤的方式, 来寻找细根并采集样品; 同时, 整体采集草地植物样品, 通过分割法来获取细根。由于荒漠植物细根数量较少, 每个物种至少采集20个个体。使用蒸馏水将细根清洗干净, 利用根系分析系统(WinRhizo Pro STD4800)扫描得到根长数据, 再将根系样品烘干至恒重后测定干重, 通过计算根长和根系干重的比值获得细根比根长。将烘干的样品磨碎, 利用钼锑抗比色法测定叶片和细根磷含量, 使用元素分析仪(FLASH2000 CHNS/O, Thermo, American)测定叶片和细根氮含量。
为了减少功能性状指标间的共线性对功能多样性的影响, 我们对选择的8个功能性状进行主成分分析(principle component analysis, PCA), 并利用主成分变量来计算群落功能β多样性。同时, 本研究还基于单个功能性状计算了功能β多样性, 以更好地推断戈壁植物群落的构建机制。
1.4 环境变量
依据研究区气候特征, 本研究选择与植物多样性可能密切相关的5个气候变量来测度生境气候条件(Wang et al, 2012): 太阳辐射强度(solar radiation, SRAD)、年均温(mean annual temperature, MAT)、温度季节性(temperature seasonality, TS)、年降水量(mean annual precipitation, MAP)、降水季节性(precipitation seasonality, PS)。利用经纬度坐标, 从Worldclim网站(
本研究选择土壤含水量(soil moisture content, SMC)、有机碳含量(soil organic carbon content, SOC)、全氮含量(soil total nitrogen content, TN)、pH值以及地表砾石盖度(gravel coverage, GC)来表征戈壁的局域生境特征。在每个调查样方内, 根据土壤异质性情况使用土钻随机采集15-30份0-10 cm土层土壤样品, 混合后剔除石子、根系及杂质, 过2 mm土壤筛。一部分样品测定鲜重后烘干, 以测定土壤含水量。土壤有机碳含量利用重铬酸钾法测定, 土壤全氮含量利用凯氏定氮法测定, 土壤pH值利用pH计测定。
1.5 系统发育树的构建
1.6 系统发育信号检验
1.7 β多样性计算与零模型分析
其中, a为群落B与群落C的共有种的个体数量, b与c 分别为群落B与群落C的独有物种个体数
利用R语言“picante”包(Kembel et al, 2010)中的comdistnt和comdist函数, 通过计算多度加权的平均最近邻体距离(MNTD)以及平均成对距离(MPD)指数来测度系统发育和功能β多样性, 具体计算公式如下:
其中, nk1表示群落k1物种数, fi表示在群落k1中物种i的相对多度, minδik2表示群落k1中的物种i和群落k2中最近邻体性状距离或亲缘关系最近物种间的系统发育距离; nk2表示群落k2物种数, fj表示在群落k2中物种j的相对多度, minδjk1表示群落k2中的物种j和群落k1中最近邻体性状距离或亲缘关系最近物种间的系统发育距离。
其中,
为了进一步分析生态位过程和中性过程在戈壁植物群落构建中的相对重要性, 我们通过零模型分析方法计算了植物群落物种、功能和系统发育β多样性的标准效应(Gotelli & Graves, 1996)。针对物种β多样性, 本研究以区域物种库为基础, 在保证物种丰富度和物种个体数量不变的前提下, 通过随机置换物种多度999次, 得到随机物种多度矩阵, 进而计算物种β多样性期望值。针对功能与系统发育β多样性, 在确定物种丰富度和物种个体数量不变的前提下, 通过随机置换功能性状和系统发育距离矩阵物种999次构建零模型, 从而得到功能和系统发育β多样性期望值。最后通过以下公式计算得到物种、功能和系统发育β多样性的标准效应(standardized effect size, SES):
其中, Xobs为β多样性观测值, Xnull为999次零模型β多样性期望值, sd(Xnull)为999次零模型β多样性标准差。当SES显著大于或小于零值时, 表示植物群落构建中β多样性呈现非随机的结构, 生态位过程可能占主导; 当SES与零值在统计学上不存在显著差异时, 中性过程在群落构建中可能占据主导地位。最后, 本研究利用Wilcoxon test检验物种、功能和系统发育β多样性标准效应与零值的差异性。
1.8 数据统计与分析
本研究首先对局域生境变量(地表砾石盖度、土壤pH值、有机碳含量、全氮含量)、气候变量(太阳辐射强度、年均温、温度季节性、降水季节性)进行标准化(平均值为0, 标准差为1), 以消除各个变量间量纲差异的影响; 然后计算每个环境变量的欧式距离矩阵和地理距离矩阵。使用Mantel检验分析空间变量以及各个环境变量欧式距离与植物群落物种、功能与系统发育β多样性的相关性。本研究利用地理距离-β多样性回归曲线来反映植物群落物种、功能和系统发育相似性随着距离增加而衰减的格局。
最后, 利用基于距离矩阵的多元回归模型(multiple regressions on distance matrices, MRM)来明确植物群落物种、功能与系统发育β多样性的主要影响变量(Goslee & Urban, 2007)。同时, 利用MRM进行偏回归分析来进一步明确地理距离、环境差异对3个维度植物β多样性的相对影响。具体将植物β多样性变异分解为4部分: 地理距离和环境差异各自的单独及共同解释部分、未解释部分。
2 结果
2.1 系统发育信号
除了叶面积和根长检测到显著的系统发育信号(表1; P < 0.05)外, 比根长等其余6个功能性状均没有检测到显著的系统发育信号(P > 0.05)。此外, 8个功能性状的K值均小于1 (0.07-0.43)。
表1 8个功能性状的系统发育信号
Table 1
| 功能性状 Functional trait | Blomberg’s K | P |
|---|---|---|
| 叶片氮含量 Leaf nitrogen concentrations (LNC) | 0.10 | 0.29 |
| 叶片磷含量 Leaf phosphorus concentrations (LPC) | 0.10 | 0.32 |
| 叶面积 Leaf area (LA) | 0.43 | 0.03 |
| 比叶面积 Specific leaf area (SLA) | 0.08 | 0.52 |
| 细根氮含量 Fine root nitrogen concentrations (RNC) | 0.17 | 0.09 |
| 细根磷含量 Fine root phosphorus concentrations (RPC) | 0.07 | 0.66 |
| 根长 Root length (RL) | 0.41 | 0.02 |
| 比根长 Specific root length (SRL) | 0.19 | 0.10 |
2.2 戈壁植物群落物种、功能和系统发育β多样性距离衰减格局
除了平均系统发育距离外, 戈壁植物群落的物种、功能和系统发育β多样性均呈现出随着地理距离的增加而增大的变化趋势(图2a-c, 附录2a-b; P < 0.05), 表明青藏高原戈壁植物群落3个维度的β多样性均存在显著的距离衰减效应。不同维度的β多样性与地理距离的关系存在一定差异: 地理距离与植物群落功能β多样性的相关性最为密切, β多样性次之, 与系统发育β多样性的相关性最弱。
图2
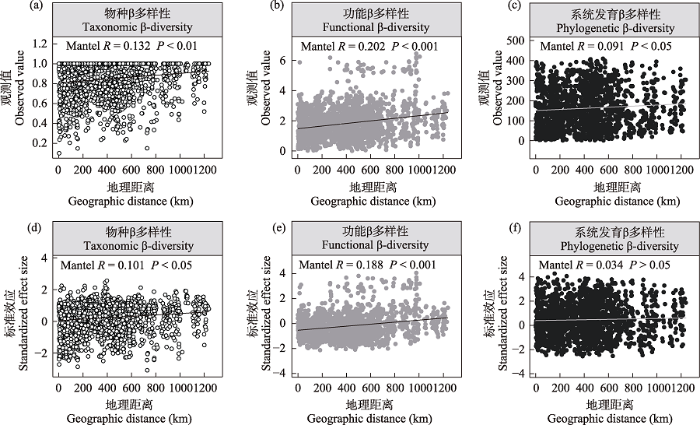
图2
青藏高原北部戈壁植物群落物种、功能(平均最近邻体性状距离)和系统发育(平均最近邻体系统发育距离) β多样性观测值(a-c)及其标准效应(d-e)随地理距离的变化趋势
Fig. 2
Variation in plant taxonomic, functional (mean nearest neighbor trait distance), and phylogenetic (mean nearest neighbor phylogenetic distance) β-diversity observed values (a-c) and their standardized effect sizes (d-e) along geographic distance in the gobi deserts of northern Qinghai-Tibet Plateau
2.3 戈壁植物群落物种、功能和系统发育β多样性与环境差异的关系
表2 青藏高原北部戈壁植物群落物种、功能(平均最近邻体性状距离)和系统发育(平均最近邻体系统发育距离) β多样性观测值及其标准效应与不同环境因素差异间的相关性
Table 2
| 环境差异 Environmental difference | 物种β多样性 Taxonomic β-diversity | 功能β多样性 Functional β-diversity | 系统发育β多样性 Phylogenetic β-diversity | |||
|---|---|---|---|---|---|---|
| 观测值 OV | 标准效应 SES | 观测值 OV | 标准效应 SES | 观测值 OV | 标准效应 SES | |
| 太阳辐射强度 Solar radiation | 0.140** | 0.167** | 0.102 | 0.104 | 0.021 | -0.0002 |
| 年均温 Annual mean temperature | 0.144** | 0.117** | 0.146* | 0.105 | -0.004 | -0.091 |
| 温度季节性 Temperature seasonality | 0.112* | 0.065 | 0.117 | 0.039 | 0.091 | 0.026 |
| 年降水量 Annual precipitation | 0.012 | 0.02 | -0.056 | -0.118 | -0.081 | -0.116 |
| 降水季节性 Precipitation seasonality | 0.055 | 0.105 | -0.071 | -0.098 | -0.02 | 0.003 |
| 地表砾石盖度 Gravel coverage | 0.268*** | 0.204*** | 0.372*** | 0.226*** | 0.35*** | 0.191*** |
| 土壤含水量 Soil moisture content | 0.295*** | 0.270*** | 0.431*** | 0.335*** | 0.27*** | 0.116 |
| 土壤氮含量 Soil total nitrogen content | 0.017 | 0.089 | -0.021 | 0.031 | 0.014 | 0.071 |
| 土壤有机碳含量 Soil organic carbon content | 0.104 | 0.123* | 0.199** | 0.175** | 0.013 | -0.056 |
| 土壤pH值 Soil pH | 0.323*** | 0.328*** | 0.353*** | 0.216** | 0.325*** | 0.183* |
* P < 0.05; ** P < 0.01; *** P < 0.001.
图3
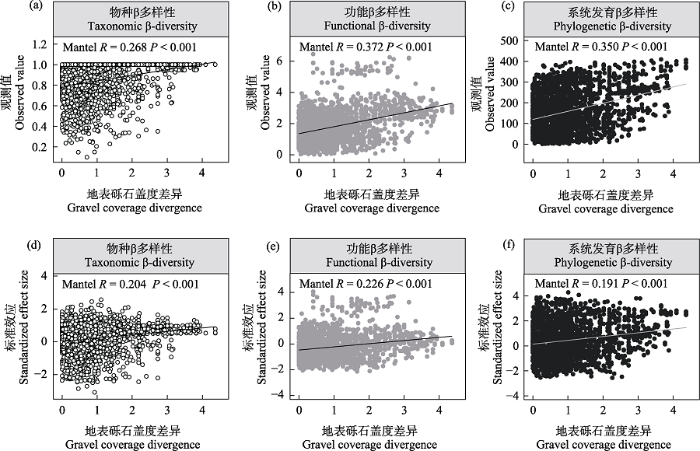
图3
青藏高原北部戈壁植物群落物种、功能(平均最近邻体性状距离)和系统发育(平均最近邻体系统发育距离) β多样性(a-c)及其标准效应(d-e)与地表砾石盖度差异的关系
Fig. 3
The relationships of plant taxonomic, functional (mean nearest neighbor trait distance), and phylogenetic (mean nearest neighbor phylogenetic distance) β-diversity observed value (a-c) and their standardized effect size (d-e) with gravel coverage divergence in the gobi deserts of northern Qinghai-Tibet Plateau
2.4 地理距离和环境差异对戈壁植物群落物种、功能和系统发育β多样性的相对影响
图4
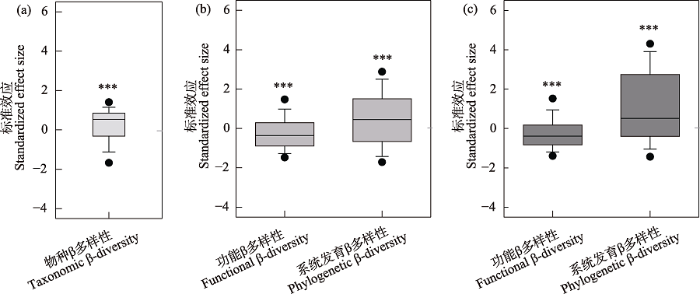
图4
青藏高原北部戈壁植物群落物种(a)、功能和系统发育β多样性(b-c)标准效应与零值的比较。(b)平均最近邻体性状距离和平均最近邻体系统发育距离; (c)平均成对性状距离和平均成对系统发育距离。*** P < 0.001。
Fig. 4
Comparison of the standardized effect size for plant taxonomic (a), functional, and phylogenetic β-diversity (b-c) with zero value across the gobi deserts of northern Qinghai-Tibet Plateau. (b) Mean nearest neighbor trait distance and mean nearest neighbor phylogenetic distance; (c) Mean pairwise trait distance and mean pairwise phylogenetic distance. *** P < 0.001.
图5
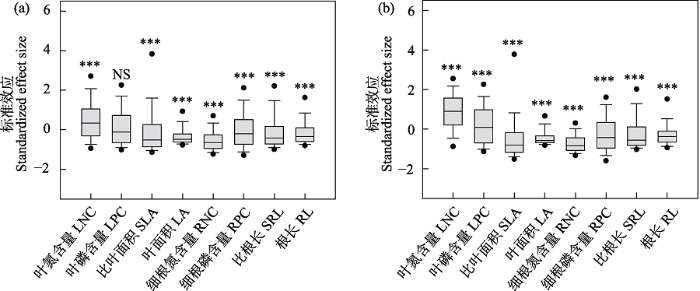
图5
单个功能性状β多样性标准效应与零值的比较。(a)平均最近邻体性状距离; (b)平均成对性状距离。NS, P > 0.05; ***, P < 0.001。
Fig. 5
Comparison of the standardized effect size for single functional trait β-diversity with zero value across the gobi deserts of northern Qinghai-Tibet Plateau. (a) Mean nearest neighbor trait distance; (b) Mean pairwise trait distance. LNC, Leaf nitrogen concentrations; LPC, Leaf phosphorus concentrations; SLA, Specific leaf area; LA, Leaf area; RNC, Fine root nitrogen concentrations; RPC, Fine root phosphorus concentrations; SRL, Specific root length; RL, Root length. NS, P > 0.05; ***, P < 0.001.
环境差异对戈壁植物群落的物种、功能和系统发育β多样性及其标准效应均有显著的解释力(图6, 附录5)。地理距离对戈壁植物群落的物种和功能β多样性及其标准效应都有显著影响, 但对系统发育β多样性及其标准效应均没有显著影响。更为重要的是, 环境差异对戈壁植物群落物种和功能β多样性及其标准效应的影响比地理距离更重要。此外, 环境差异对各个功能性状β多样性及其标准效应也存在着更强的影响, 但地理距离仅对比叶面积、细根磷含量、根长β多样性及其标准效应有显著影响(附录6, 附录7)。
图6
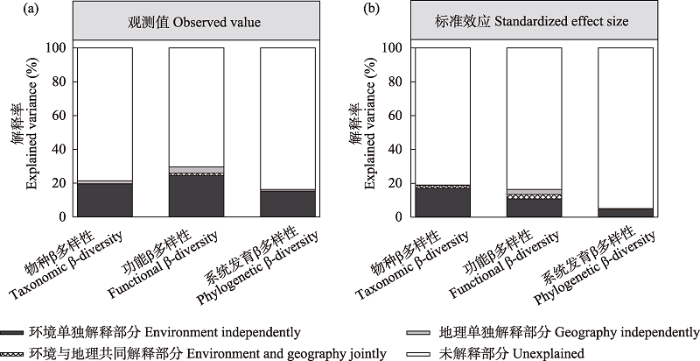
图6
青藏高原北部戈壁区环境差异与地理距离对植物群落物种、功能(平均最近邻体性状距离)和系统发育(平均最近邻体系统发育距离) β多样性观测值(a)及其标准效应(b)的解释
Fig. 6
The relative contribution of environmental and geographic distance in driving the vraiation in plant taxonomic, functional (mean nearest neighbor trait distance), and phylogenetic (mean nearest neighbor phylogenetic distance) β-diversity observed values (a) and their standardized effect sizes (b) across the gobi deserts of northern Qinghai-Tibet Plateau
3 讨论
3.1 生态位过程与中性过程对戈壁植物群落β多样性的相对影响
尽管生态位过程和中性过程被认为共同主导着植物群落构建, 但大量研究表明两个过程的相对重要性在不同生态系统类型、研究尺度和植物功能类群间存在显著差异(Legendre et al, 2009; Liu et al, 2015; Wang et al, 2021)。已有研究发现中性过程对热带雨林β多样性有着更强的影响, 而生态位过程在温带草地和森林中起主导作用(Tang et al, 2012; Myers et al, 2013)。与多数研究结果一致(Tuomisto et al, 2003; 秦浩等, 2019; Wang et al, 2019), 本研究中戈壁植物群落的物种、功能和系统发育β多样性均存在着显著的随距离衰减效应, 而扩散限制和生境过滤都会导致这种结果(王均伟等, 2016)。本研究中植物群落物种、功能和系统发育β多样性的标准效应与零值均存在显著差异, 说明生态位过程可能主导着戈壁植物群落的构建。方差分解结果进一步证实生境过滤可能对植物群落物种、功能和系统发育β多样性均有着比扩散限制更重要的影响。而且相较于温带森林和草地等生态系统(Myers et al, 2013; Wang et al, 2019; 周昌艳等, 2020), 生境过滤在戈壁荒漠植物群落β多样性格局形成过程中有着更为强烈的影响。这可能是由于戈壁荒漠中极端干旱和养分限制等环境胁迫对群落中的物种产生极强的过滤作用, 从而加强了生境过滤作用的重要性。
有研究指出, 功能和系统发育多样性格局是否一致主要取决于功能性状的系统发育保守程度(Webb et al, 2002)。若性状保守, 功能和系统发育多样性格局将保持一致, 反之则可能两者存在不同的格局(房帅等, 2014; 王均伟等, 2016)。本研究也发现植物功能β多样性整体表现为聚集, 而系统发育β多样性表现为离散。本文选择的8个功能性状整体上并未表现出系统发育保守性, 且除了叶氮含量外, 其余功能性状β多样性均表现为聚集, 说明戈壁植物群落的功能性状是趋同进化而来。极端干旱和养分限制等引起的生境过滤作用导致各个群落中物种功能性状整体趋同, 因此植物功能β多样性整体上表现为聚集。已有研究发现绝大多数戈壁植物属于寡种科及寡种属(夏延国等, 2013)。本文所调查的44个物种分属15科35属, 寡种科和寡种属物种占比分别为53.3%和82.9% (附录1), 表明研究区植物亲缘关系可能相对比较疏远。此外, 戈壁荒漠物种丰富度水平较低, 多数群落物种丰富度仅2-3。因此, 经生境过滤筛选进入到各个群落的物种尽管功能性状比较相似, 但亲缘关系并不相近, 如生境条件相似的膜果麻黄群落和梭梭群落间却有着非常大的系统发育距离。最终导致研究区植物功能和系统发育β多样性格局并不一致(Webb et al, 2002; Arnan et al, 2015)。
已有研究表明环境差异与地理距离未解释的部分可能反映了未考虑的变量, 尤其是生物相互作用等其他生态过程的影响(Gilbert & Lechowicz, 2004)。本研究中, 植物3个维度的β多样性, 尤其是系统发育β多样性未被环境和空间变量解释的比例大, 这说明生物相互作用等其他生态过程可能也会对植物多样性尤其是系统发育多样性有重要影响(Myers et al, 2013; Chi et al, 2014)。因此, 在研究区寡种科或寡种属植物物种高占比的影响下, 物种竞争排除、互惠共生等其他生态过程可能会导致功能性状存在一定差异的物种间亲缘关系比较疏远, 从而功能和系统发育多样性格局呈现出相反的趋势。总之, 本研究推测由于戈壁植物群落功能性状趋同进化, 生境过滤、物种竞争排除和互惠等群落构建过程可能对植物的物种、功能和系统发育β多样性有着不同的影响, 导致其呈现出不同的分布格局。
此外, 本研究还对单个功能性状的β多样性进行了分析(附录6, 附录7), 发现土壤含水量、地表砾石盖度等环境因子对叶片面积、细根氮含量、细根磷含量、根长、比根长等功能性状β多样性有着较大的解释率, 但对叶片氮含量、叶片磷含量、比叶面积等功能性状β多样性解释率较小。这一方面可能是因为除了本文所选择的气候、土壤因子外, 还有其他重要的环境因素也在驱动着植物功能β多样性格局的形成; 例如, 物种竞争和互惠、地下水位、深层土壤含水量、人为活动干扰等因素的作用(李新荣等, 2009; Zhang et al, 2017)。另一方面可能是本文所选择的功能性状并没有完全反映戈壁植物间的功能权衡差异, 在生态策略形成中具有重要作用的功能性状并没被全部考虑进来(周昌艳等, 2020)。未来的研究应该进一步引进更能准确代表植物对外界环境变化的响应的“硬性状” (刘晓娟和马克平, 2015), 如叶片光合速率、植物耐旱性、耐寒性等(Bartlett et al, 2016; Swenson et al, 2017), 并结合植物间功能基因差异, 综合考虑多重环境变量的影响, 以更好地揭示戈壁植物群落物种共存和群落构建机制(Swenson et al, 2017; Yang et al, 2018)。
3.2 局域生境因素是戈壁植物群落β多样性形成的主要驱动力
区域气候, 尤其是与水资源可利用性相关的气候变量被认为是决定干旱区植物多样性大尺度地理分布格局的决定性因素(Tang et al, 2012; Ulrich et al, 2014; 刘庆福等, 2015)。然而, 本研究发现地表砾石盖度、土壤含水量、土壤pH值等局域生境因素对植物群落物种、功能和系统发育β多样性均有着比气候因素更强的影响, 这表明局域生境因素可以通过补充限制(recruitment limitation)、资源竞争(resource competition)等生态过程来对植物β多样性产生比气候更为重要的影响(Grubb, 1977; Stevens & Carson, 2002)。这可能有以下几种解释: 首先, 局域生境因素和气候往往存在着显著相关性, 从而导致很难精确量化气候和局域生境因素各自的单独影响(Gaston, 2000; Gilbert & Lechowicz, 2004); 其次, 气候因素调节着陆地生态系统养分和化学循环过程(Fernandez-Going et al, 2013), 可以通过调控局域生境水分和养分可利用性来间接影响戈壁植物群落β多样性(Ruiz-Sinoga & Diaz, 2010); 第三, 干旱区零散起伏的局域地形会引起生境水土资源发生再分配, 从而导致了斑块镶嵌分布的植被分布格局, 这将进一步加剧局域生境水土资源异质性(Tongway & Ludwig, 2005; Reisner et al, 2013); 最后, 戈壁表层砾石覆盖度会影响地表水分下渗和蒸发, 从而可以通过调节生境水分和养分可利用性来影响植物群落多样性(Unger, 1971), 因此地表砾石盖度、土壤含水量等局域生境因素对植物群落有着更强烈的生境过滤作用(Zhang et al, 2017)。尽管本文这些发现与先前温带草地和荒漠生态系统的研究结果一致(Chi et al, 2014; Wang et al, 2019), 但并不支持全球尺度的研究结果(Qian & Ricklefs, 2012; Ulrich et al, 2014), 这可能说明气候和局域生境因素对植物群落的相对影响存在尺度依赖性(Legendre et al, 2009)。此外, 前期研究也发现不同生态过程对植物多样性的相对影响在不同尺度间存在差异(房帅等, 2014; 王均伟等, 2016)。本研究只分析了10 m采样尺度植物β多样性分布格局及其影响因素, 在其他采样尺度(20 m、50 m、100 m、1,000 m)可能会有不同的发现。因此, 未来研究应综合比较分析不同空间尺度上植物群落构建机制的差异。
附录 Supplementary Material
附录1 青藏高原北部61个戈壁植物群落调查点记录物种名录
Appendix 1 Plant species lists recording in 61 plant communities survey sites in the gobi gobi deserts of northern Qinghai-Tibet Plateau
附录2 青藏高原北部戈壁植物功能(平均成对性状距离)和系统发育(平均成对系统发育距离) β多样性观测值(a-b)及其标准效应(c-d)随地理距离的变化趋势
Appendix 2 Variation in plant functional (mean pairwise trait distance), and phylogenetic (mean pairwise phylogenetic distance) β-diversity observed value (a-c) and their standardized effect size (d-e) along geographic distacne in the gobi deserts of northern Qinghai-Tibet Plateau
附录3 青藏高原北部戈壁植物功能(平均成对性状距离)和系统发育(平均成对系统发育距离) β多样性观测值及其标准效应与不同环境因素差异间的相关性
Appendix 3 Mantel tests for the relationships of plant functional (mean pairwise trait distance), and phylogenetic (mean pairwise phylogenetic distance) β-diversity observed value and their standard effect size with different environmental factors in the gobi deserts of northern Qinghai-Tibet Plateau
附录4 青藏高原北部戈壁植物功能(平均成对性状距离)和系统发育(平均成对系统发育距离) β多样性观测值(a-b)及其标准效应(c-d)与地表砾石盖度差异的关系
Appendix 4 The relationships of plant functional (mean pairwise trait distance), and phylogenetic (mean pairwise phylogenetic distance) β-diversity observed value (a-b) and their standardized effect size (c-d) with gravel coverage divergence in the gobi deserts of northern Qinghai-Tibet Plateau
附录5 青藏高原北部戈壁区环境差异与地理距离对植物功能(平均成对性状距离)和系统发育(平均成对系统发育距离) β多样性观测值(a)及其标准效应(b)的解释
Appendix 5 The relative contribution of environmental and geographic distance in driving the vraiation in plant functional (mean pairwise trait distance), and phylogenetic (mean pairwise phylogenetic distance) β-diversity observed value (a) and their standardized effect size (b) across the gobi deserts of northern Qinghai-Tibet Plateau
附录6 青藏高原北部戈壁区环境差异与地理距离对各个功能性状β多样性(平均最近邻体性状距离)观测值(a)及其标准效应(b)的解释
Appendix 6 The relative contribution of environmental and geographic distance in driving the vraiation in each functional trait (mean nearest neighbor trait distance) β-diversity observed value (a) and their standardized effect size (b) across the gobi deserts of northern Qinghai-Tibet Plateau
附录7 青藏高原北部戈壁区环境差异与地理距离对各个功能性状β多样性(平均成对性状距离)观测值(a)及其标准效应(b)的解释
Appendix 7 The relative contribution of environmental and geographic distance in driving the vraiation in each functional trait (mean pairwise trait distance) β-diversity observed value (a) and their standardized effect size (b) across the gobi deserts of northern Qinghai-Tibet Plateau
参考文献
Navigating the multiple meanings of β diversity: A roadmap for the practicing ecologist
DOI:10.1111/j.1461-0248.2010.01552.x
PMID:21070562
[本文引用: 2]

A recent increase in studies of β diversity has yielded a confusing array of concepts, measures and methods. Here, we provide a roadmap of the most widely used and ecologically relevant approaches for analysis through a series of mission statements. We distinguish two types of β diversity: directional turnover along a gradient vs. non-directional variation. Different measures emphasize different properties of ecological data. Such properties include the degree of emphasis on presence/absence vs. relative abundance information and the inclusion vs. exclusion of joint absences. Judicious use of multiple measures in concert can uncover the underlying nature of patterns in β diversity for a given dataset. A case study of Indonesian coral assemblages shows the utility of a multi-faceted approach. We advocate careful consideration of relevant questions, matched by appropriate analyses. The rigorous application of null models will also help to reveal potential processes driving observed patterns in β diversity.© 2010 Blackwell Publishing Ltd/CNRS.
Partitioning the impact of environment and spatial structure on alpha and beta components of taxonomic, functional, and phylogenetic diversity in European ants
DOI:10.7717/peerj.1241 URL [本文引用: 1]
Drought tolerance as a driver of tropical forest assembly: Resolving spatial signatures for multiple processes
Spatial patterns in trait variation reflect underlying community assembly processes, allowing us to test hypotheses about their trait and environmental drivers by identifying the strongest correlates of characteristic spatial patterns. For 43 evergreen tree species (> 1 cm dbh) in a 20-ha seasonal tropical rainforest plot in Xishuangbanna, China, we compared the ability of drought-tolerance traits, other physiological traits, and commonly measured functional traits to predict the spatial patterns expected from the assembly processes of habitat associations, niche-overlap-based competition, and hierarchical competition. We distinguished the neighborhood-scale (0-20 m) patterns expected from competition from larger-scale habitat associations with a wavelet method. Species' drought tolerance and habitat variables related to soil water supply were strong drivers of habitat associations, and drought tolerance showed a significant spatial signal for influencing competition. Overall, the traits most strongly associated with habitat, as quantified using multivariate models, were leaf density, leaf turgor loss point (π(tlp); also known as the leaf wilting point), and stem hydraulic conductivity (r2 range for the best fit models = 0.27-0.36). At neighborhood scales, species spatial associations were positively correlated with similarity in π(tlp), consistent with predictions for hierarchical competition. Although the correlation between π(tlp) and interspecific spatial associations was weak (r2 < 0.01), this showed a persistent influence of drought tolerance on neighborhood interactions and community assembly. Quantifying the full impact of traits on competitive interactions in forests may require incorporating plasticity among individuals within species, especially among specific life stages, and moving beyond individual traits to integrate the impact of multiple traits on whole-plant performance and resource demand.
betapart: An R package for the study of beta diversity
DOI:10.1111/j.2041-210X.2012.00224.x URL [本文引用: 1]
Partitioning phylogenetic and functional diversity into alpha and beta components along an environmental gradient in a Mediterranean rangeland
DOI:10.1111/jvs.12048 URL [本文引用: 1]
Testing for phylogenetic signal in comparative data: Behavioral traits are more labile
The primary rationale for the use of phylogenetically based statistical methods is that phylogenetic signal, the tendency for related species to resemble each other, is ubiquitous. Whether this assertion is true for a given trait in a given lineage is an empirical question, but general tools for detecting and quantifying phylogenetic signal are inadequately developed. We present new methods for continuous-valued characters that can be implemented with either phylogenetically independent contrasts or generalized least-squares models. First, a simple randomization procedure allows one to test the null hypothesis of no pattern of similarity among relatives. The test demonstrates correct Type I error rate at a nominal alpha = 0.05 and good power (0.8) for simulated datasets with 20 or more species. Second, we derive a descriptive statistic, K, which allows valid comparisons of the amount of phylogenetic signal across traits and trees. Third, we provide two biologically motivated branch-length transformations, one based on the Ornstein-Uhlenbeck (OU) model of stabilizing selection, the other based on a new model in which character evolution can accelerate or decelerate (ACDC) in rate (e.g., as may occur during or after an adaptive radiation). Maximum likelihood estimation of the OU (d) and ACDC (g) parameters can serve as tests for phylogenetic signal because an estimate of d or g near zero implies that a phylogeny with little hierarchical structure (a star) offers a good fit to the data. Transformations that improve the fit of a tree to comparative data will increase power to detect phylogenetic signal and may also be preferable for further comparative analyses, such as of correlated character evolution. Application of the methods to data from the literature revealed that, for trees with 20 or more species, 92% of traits exhibited significant phylogenetic signal (randomization test), including behavioral and ecological ones that are thought to be relatively evolutionarily malleable (e.g., highly adaptive) and/or subject to relatively strong environmental (nongenetic) effects or high levels of measurement error. Irrespective of sample size, most traits (but not body size, on average) showed less signal than expected given the topology, branch lengths, and a Brownian motion model of evolution (i.e., K was less than one), which may be attributed to adaptation and/or measurement error in the broad sense (including errors in estimates of phenotypes, branch lengths, and topology). Analysis of variance of log K for all 121 traits (from 35 trees) indicated that behavioral traits exhibit lower signal than body size, morphological, life-history, or physiological traits. In addition, physiological traits (corrected for body size) showed less signal than did body size itself. For trees with 20 or more species, the estimated OU (25% of traits) and/or ACDC (40%) transformation parameter differed significantly from both zero and unity, indicating that a hierarchical tree with less (or occasionally more) structure than the original better fit the data and so could be preferred for comparative analyses.
The merging of community ecology and phylogenetic biology
DOI:10.1111/j.1461-0248.2009.01314.x
PMID:19473217
[本文引用: 1]
The increasing availability of phylogenetic data, computing power and informatics tools has facilitated a rapid expansion of studies that apply phylogenetic data and methods to community ecology. Several key areas are reviewed in which phylogenetic information helps to resolve long-standing controversies in community ecology, challenges previous assumptions, and opens new areas of investigation. In particular, studies in phylogenetic community ecology have helped to reveal the multitude of processes driving community assembly and have demonstrated the importance of evolution in the assembly process. Phylogenetic approaches have also increased understanding of the consequences of community interactions for speciation, adaptation and extinction. Finally, phylogenetic community structure and composition holds promise for predicting ecosystem processes and impacts of global change. Major challenges to advancing these areas remain. In particular, determining the extent to which ecologically relevant traits are phylogenetically conserved or convergent, and over what temporal scale, is critical to understanding the causes of community phylogenetic structure and its evolutionary and ecosystem consequences. Harnessing phylogenetic information to understand and forecast changes in diversity and dynamics of communities is a critical step in managing and restoring the Earth's biota in a time of rapid global change.
A review of beta diversity studies
DOI:10.3724/SP.J.1003.2010.323
[本文引用: 1]
<p>Beta diversity is an important component of biological diversity, measuring compositional change in species assemblages across temporal and spatial scales. Beta diversity concerns not only a number of ecological and evolutionary issues, but can also guide the selection of protected areas and help to optimize conservation networks. It has thus become a hot topic in biodiversity research in recent years. Researchers have used various measures and analytical methods to investigate patterns of beta diversity and its underlying mechanisms for various taxa and in different regions. Here, we reviewed literature from the past decade pertaining to the following aspects of beta diversity: metrics, temporal and spatial patterns, determinants and applications in biodiversity conservation. Whittaker introduced the term beta diversity in 1960, but defined it vaguely. As the concept of beta diversity evolved, a high variety of measures were developed to quantify the concept. The comparison of results from different studies may be hindered by the variety of measures used to quantify beta diversity. Presently, the most popular methods for measuring beta diversity are similarity/ dissimilarity coefficients such as Jaccard index and Sørensen index. In the last few years, several methods to quantify beta diversity have emerged, some of which are worth noting. Beta diversity depends on temporal scale, spatial scale and taxonomic scale, and decreases with increasing analytical grain size. There is no consensus among scientists that beta diversity decreases with latitude, i.e. that it is higher in tropics and lower near the poles. Beta diversity is high within mountain ranges and at the interface of biogeographic realms; thus, larger/more reserves are needed in these regions to cover the entire gradient of species turnover. Studies on beta diversity across temporal scales have shown that climatic change has resulted in shifts in species composition through time, and that the migration of species between different continents/regions has led to biotic homogenization. Based on a thorough review of beta diversity literature, we think the following questions might be the focus of future research: (1) the influence of evolutionary history and biological characteristics of different taxonomic groups on their beta diversity; (2) the influence of temporal/spatial scales on beta diversity and its determinants; and (3) the effect of anthropogenic activities on beta diversity.</p>
Beta多样性研究进展
DOI:10.3724/SP.J.1003.2010.323
[本文引用: 1]
Beta多样性度量时空尺度上物种组成的变化, 是生物多样性的重要组成部分, 与许多生态学和进化生物学问题密切相关, 并且其信息可用于保护区选址和布局规划, 因此在最近10年间成为生物多样性研究的热点问题之一。多年来, 学者们利用各种度量方式和分析方法, 在不同地理区域, 对许多生物类群beta多样性的时空格局和形成机制进行了大量研究。本文主要从beta多样性的度量方法、时空格局、形成机制及其在生物多样性保护中的应用等几个方面, 总结了最近10多年来相关研究的进展。Whittaker(1960)最初提出beta多样性概念时就缺乏严格的定义, 随着概念的不断演化, 度量方法也同样呈现出多样化, 而度量手段的多样化非常不利于不同研究之间的比较。目前应用最普遍的度量方法是采用相似性指数, 如Jaccard和Sørensen指数。最近几年, 新的度量方法还在不断出现, 其中一些方法非常值得注意。Beta多样性具有时空尺度和分类尺度依赖性, 一般随分析粒度(grain)的增加而降低。虽然有些研究表明beta多样性随纬度增加而降低, 但学者们并没有达成共识。山区和生物地理区的交界处beta多样性都比较高, 因而需要在这些地区增加保护区的面积或者数量以囊括物种变化梯度。对时间尺度上beta多样性的研究表明, 气候变化确实导致了物种组成在时间上的变化, 并且物种在不同大陆和地区间的迁移导致了生物同质化。扩散过程和生态位过程共同决定了beta多样性, 只是这两个过程的相对重要性依尺度、地理区域和物种类群的不同而有所差异。综上所述, 我们认为未来beta多样性研究的热点问题是:(1)不同生物类群的进化历史和生物学特征对beta多样性的影响; (2)不同的时空尺度对beta多样性及其维持机制的影响; (3)人类活动对beta多样性的影响。
Effects of environment and space on species turnover of woody plants across multiple forest dynamic plots in East Asia
Patterns of phylogenetic beta diversity in China’s grasslands in relation to geographical and environmental distance
DOI:10.1016/j.baae.2014.07.003 URL [本文引用: 2]
A handbook of protocols for standardised and easy measurement of plant functional traits worldwide
DOI:10.1071/BT02124 URL [本文引用: 1]
Methods and protocols for plant community inventory
DOI:10.3724/SP.J.1003.2009.09253 URL [本文引用: 1]
植物群落清查的主要内容、方法和技术规范
DOI:10.3724/SP.J.1003.2009.09253
[本文引用: 1]
植物群落是不同植物在长期环境变化中相互作用、相互适应而形成的组合。它提供着人类赖以生存的主要物质资源, 维系着地球生态系统的健康和功能, 也为各种动物和其他生物提供食物来源和栖息地, 是人类生存和发展不可或缺的物质基础, 具有不可替代的作用。我国植物群落类型多样, 在世界上首屈一指, 但我国至今尚没有一次全面和系统的植物群落清查, 不仅影响了人们对我国植物资源的了解、利用和保护, 也不利于我国生态学、环境科学和地理学等相关学科的发展。采用统一的方法体系和技术规范开展我国植物群落的清查工作势在必行, 并具有紧迫性。本文基于作者长期的野外工作实践和国内外的群落调查方法, 首先简要定义了与植物群落清查有关的重要概念, 在此基础上, 论述了调查样地的设置原则和体系、群落清查的技术指标和方法、主要优势种生态属性的测定方法和规范, 并介绍了大样地调查的主要步骤。通过本文的介绍、归纳和总结, 试图为制定我国植物群落清查的技术规范提供基础材料和技术储备。
Functional and phylogenetic structures of woody plants in broad-leaved Korean pine mixed forest in Changbai Mountains, Jilin, China
长白山阔叶红松林木本植物系统发育与功能性状结构
Climate interacts with soil to produce beta diversity in Californian plant communities
Spatially distinct communities can arise through interactions and feedbacks between abiotic and biotic factors. We suggest that, for plants, patches of infertile soils such as serpentine may support more distinct communities from those in the surrounding non-serpentine matrix in regions where the climate is more productive (i.e., warmer and/or wetter). Where both soil fertility and climatic productivity are high, communities may be dominated by plants with fast-growing functional traits, whereas where either soils or climate impose low productivity, species with stress-tolerant functional traits may predominate. As a result, both species and functional composition may show higher dissimilarity between patch and matrix in productive climates. This pattern may be reinforced by positive feedbacks, in which higher plant growth under favorable climate and soil conditions leads to higher soil fertility, further enhancing plant growth. For 96 pairs of sites across a 200-km latitudinal gradient in California, we found that the species and functional dissimilarities between communities on infertile serpentine and fertile non-serpentine soils were higher in more productive (wetter) regions. Woody species had more stress-tolerant functional traits on serpentine than non-serpentine soil, and as rainfall increased, woody species functional composition changed toward fast-growing traits on non-serpentine, but not on serpentine soils. Soil organic matter increased with rainfall, but only on non-serpentine soils, and the difference in organic matter between soils was positively correlated with plant community dissimilarity. These results illustrate a novel mechanism wherein climatic productivity is associated with higher species, functional, and landscape-level dissimilarity (beta diversity).
Global patterns in biodiversity
DOI:10.1038/35012228 URL [本文引用: 2]
Neutrality, niches, and dispersal in a temperate forest understory
The ecodist package for dissimilarity-based analysis of ecological data
The maintenance of species-richness in plant communities: The importance of the regeneration niche
DOI:10.1111/j.1469-185X.1977.tb01347.x URL [本文引用: 1]
Discriminating among forest communities based on taxonomic, phylogenetic and trait distances
DOI:10.1016/j.foreco.2019.03.006 URL [本文引用: 1]
Neutral theory and the evolution of ecological equivalence
DOI:10.1890/0012-9658(2006)87[1387:NTATEO]2.0.CO;2 URL [本文引用: 1]
Exploring the distribution patterns and conservation Approaches of biodiversity on the Qinghai- Tibetan Plateau
DOI:10.17520/biods.2018064 URL [本文引用: 1]
探索青藏高原生物多样性分布格局与保育途径
DOI:10.17520/biods.2018064 [本文引用: 1]
V.PhyloMaker: An R package that can generate very large phylogenies for vascular plants
DOI:10.1111/ecog.04434
[本文引用: 2]
We present V.PhyloMaker, a freely available package for R designed to generate phylogenies for vascular plants. The mega-tree implemented in V.PhyloMaker (i.e. GBOTB.extended.tre), which was derived from two recently published mega-trees and includes 74 533 species and all families of extant vascular plants, is the largest dated phylogeny for vascular plants. V.PhyloMaker can generate phylogenies for very large species lists (the largest species list that we tested included 314 686 species). V.PhyloMaker generates phylogenies at a fast speed, much faster than other phylogeny-generating packages. Our tests of V.PhyloMaker show that generating a phylogeny for 60 000 species requires less than six hours. V.PhyloMaker includes an approach to attach genera or species to their close relatives in a phylogeny. We provide a simple example in this paper to show how to use V.PhyloMaker to generate phylogenies.
Picante: R tools for integrating phylogenies and ecology
DOI:10.1093/bioinformatics/btq166 URL [本文引用: 1]
Community assembly, coexistence and the environmental filtering metaphor
DOI:10.1111/1365-2435.12345 URL [本文引用: 1]
Partitioning beta diversity in a subtropical broad-leaved forest of China
The classical environmental control model assumes that species distribution is determined by the spatial variation of underlying habitat conditions. This niche-based model has recently been challenged by the neutral theory of biodiversity which assumes that ecological drift is a key process regulating species coexistence. Understanding the mechanisms that maintain biodiversity in communities critically depends on our ability to decompose the variation of diversity into the contributions of different processes affecting it. Here we investigated the effects of pure habitat, pure spatial, and spatially structured habitat processes on the distributions of species richness and species composition in a recently established 24-ha stem-mapping plot in the subtropical evergreen broad-leaved forest of Gutianshan National Nature Reserve in East China. We used the new spatial analysis method of principal coordinates of neighbor matrices (PCNM) to disentangle the contributions of these processes. The results showed that (1) habitat and space jointly explained approximately 53% of the variation in richness and approximately 65% of the variation in species composition, depending on the scale (sampling unit size); (2) tree diversity (richness and composition) in the Gutianshan forest was dominantly controlled by spatially structured habitat (24%) and habitat-independent spatial component (29%); the spatially independent habitat contributed a negligible effect (6%); (3) distributions of richness and species composition were strongly affected by altitude and terrain convexity, while the effects of slope and aspect were weak; (4) the spatial distribution of diversity in the forest was dominated by broad-scaled spatial variation; (5) environmental control on the one hand and unexplained spatial variation on the other (unmeasured environmental variables and neutral processes) corresponded to spatial structures with different scales in the Gutianshan forest plot; and (6) five habitat types were recognized; a few species were statistically significant indicators of three of these habitats, whereas two habitats had no significant indicator species. The results suggest that the diversity of the forest is equally governed by environmental control (30%) and neutral processes (29%). In the fine-scale analysis (10 x 10 m cells), neutral processes dominated (43%) over environmental control (20%).
The response of shrub species richness and abundance patterns to environmental change in Alxa Plateau: The premise of shrubs diversity conservation in extremely arid gobi regions
阿拉善高原灌木种的丰富度和多度格局对环境因子变化的响应: 极端干旱戈壁地区灌木多样性保育的前提
The explanation of climatic hypotheses to community species diversity patterns in Inner Mongolia grasslands
DOI:10.17520/biods.2015011 URL [本文引用: 1]
气候假说对内蒙古草原群落物种多样性格局的解释
DOI:10.17520/biods.2015011
[本文引用: 1]
物种丰富度的地理格局是宏观生态学和生物地理学的中心议题之一。本文基于内蒙古草原192个野外样地的调查数据, 结合各样地年平均气温、年降水量等9个气候因子, 探讨内蒙古草原物种丰富度格局及其主导因素, 以确定气候假说在该区的适用性。结果表明: (1)内蒙古草原物种丰富度经度格局显著, 呈现沿经度升高而增加的趋势, 同时由于经纬度的共线性, 也呈现出沿纬度升高而增加的趋势。(2)方差分解显示, 能量单独解释率为2.7%, 水分单独解释率为11.4%, 水分和能量共同解释率为46.3%, 未解释部分为39.6%, 可见能量与水分的共同作用在物种丰富度格局形成中占主导地位, 支持水热动态假说。这说明水热动态假说适用于解释内蒙古草原物种丰富度 格局。
Plant functional traits—Concepts, Applications and future directions
DOI:10.1360/N052014-00244 URL [本文引用: 1]
植物功能性状研究进展
Contribution of environmental filtering and dispersal limitation to species turnover of temperate deciduous broad-leaved forests in China
DOI:10.1111/avsc.12101 URL [本文引用: 1]
Plant diversity and its environmental explaination in gobi district of northern Qinghai-Tibet Plateau, northwestern China
青藏高原北部戈壁区植物多样性及其环境解释
Community assembly in a tropical cloud forest related to specific leaf area and maximum species height
DOI:10.1111/jvs.12256 URL [本文引用: 1]
Phylogenetic niche conservatism, phylogenetic signal and the relationship between phylogenetic relatedness and ecological similarity among species
DOI:10.1111/j.1461-0248.2008.01229.x URL [本文引用: 1]
Beta-diversity in temperate and tropical forests reflects dissimilar mechanisms of community assembly
DOI:10.1111/ele.12021 URL [本文引用: 3]
Environment and dispersal influence changes in species composition at different scales in woody plants of the Western Ghats, India
DOI:10.1111/jvs.12586 URL [本文引用: 1]
New handbook for standardised measurement of plant functional traits worldwide
DOI:10.1071/BT12225 URL [本文引用: 1]
Functional diversity: Back to basics and looking forward
Functional diversity is a component of biodiversity that generally concerns the range of things that organisms do in communities and ecosystems. Here, we review how functional diversity can explain and predict the impact of organisms on ecosystems and thereby provide a mechanistic link between the two. Critical points in developing predictive measures of functional diversity are the choice of functional traits with which organisms are distinguished, how the diversity of that trait information is summarized into a measure of functional diversity, and that the measures of functional diversity are validated through quantitative analyses and experimental tests. There is a vast amount of trait information available for plant species and a substantial amount for animals. Choosing which traits to include in a particular measure of functional diversity will depend on the specific aims of a particular study. Quantitative methods for choosing traits and for assigning weighting to traits are being developed, but need much more work before we can be confident about trait choice. The number of ways of measuring functional diversity is growing rapidly. We divide them into four main groups. The first, the number of functional groups or types, has significant problems and researchers are more frequently using measures that do not require species to be grouped. Of these, some measure diversity by summarizing distances between species in trait space, some by estimating the size of the dendrogram required to describe the difference, and some include information about species' abundances. We show some new and important differences between these, as well as what they indicate about the responses of assemblages to loss of individuals. There is good experimental and analytical evidence that functional diversity can provide a link between organisms and ecosystems but greater validation of measures is required. We suggest that non-significant results have a range of alternate explanations that do not necessarily contradict positive effects of functional diversity. Finally, we suggest areas for development of techniques used to measure functional diversity, highlight some exciting questions that are being addressed using ideas about functional diversity, and suggest some directions for novel research.
Contrasting changes in taxonomic, phylogenetic and functional diversity during a long-term succession: Insights into assembly processes
DOI:10.1111/1365-2745.12098 URL [本文引用: 1]
Disentangling the effects of geographic distance and environmental dissimilarity on global patterns of species turnover
DOI:10.1111/j.1466-8238.2011.00672.x URL [本文引用: 2]
Altitudinal patterns of taxonomic, phylogenetic and functional diversity of forest communities in Mount Guandi, Shanxi, China
DOI:10.17521/cjpe.2018.0088 URL [本文引用: 2]
山西关帝山森林群落物种、谱系和功能多样性海拔格局
DOI:10.17521/cjpe.2018.0088
[本文引用: 2]
探索和揭示生物多样性的空间格局和维持机制是生态学和生物地理学研究的热点内容, 但综合物种、系统进化和功能属性等方面的多样性海拔格局研究很少。该文以关帝山森林群落为研究对象, 综合物种、谱系和功能α和β多样性指数, 旨在初步探讨关帝山森林群落多样性海拔格局及其维持机制。研究结果表明: 随着海拔的升高(1 409-2 150 m), 关帝山森林群落物种丰富度指数(S)、谱系多样性指数(PD)和功能丰富度指数(FRic)整体上表现出上升的趋势, 特别是海拔1 800 m以上区域。随着海拔的升高, 总β多样性(β<sub>total</sub>)和更替(β<sub>repl</sub>)上升趋势明显, 而丰富度差异(β<sub>rich</sub>)则逐渐下降。不同生活型植物的物种、谱系和功能多样性海拔格局差异较大。随着海拔的升高, 草本植物S和物种多样性指数(H′)上升趋势高于木本植物。影响草本植物S分布的主要因素是地形因子, 而影响木本植物S分布的主要因素是历史过程。随着海拔的升高, 木本植物β<sub>total</sub>上升趋势要比草本植物明显。随着海拔的升高, 木本植物β<sub>repl</sub>和β<sub>rich</sub>分别表现出单峰格局和“U”形格局, 而草本植物β<sub>repl</sub>和β<sub>rich</sub>则分别表现出单调递增和单调递减的格局。随着环境差异和地理距离的增加, 群落间物种、谱系和功能β多样性显著增加。环境差异(环境过滤)对木本植物的β多样性具有相对较强的作用; 而环境差异(环境过滤)和地理距离(扩散限制)共同作用于草本植物的β多样性。
Conditions favouring Bromus tectorum dominance of endangered sagebrush steppe ecosystems
DOI:10.1111/1365-2664.12097 URL [本文引用: 1]
phytools: An R package for phylogenetic comparative biology (and other things)
DOI:10.1111/j.2041-210X.2011.00169.x URL [本文引用: 1]
Soil degradation factors along a Mediterranean pluviometric gradient in Southern Spain
DOI:10.1016/j.geomorph.2010.02.003 URL [本文引用: 1]
NIH Image to ImageJ: 25 years of image analysis
For the past 25 years NIH Image and ImageJ software have been pioneers as open tools for the analysis of scientific images. We discuss the origins, challenges and solutions of these two programs, and how their history can serve to advise and inform other software projects.
Environment, dispersal and patterns of species similarity
DOI:10.1111/j.1365-2699.2006.01473.x URL [本文引用: 1]
Resource quantity, not resource heterogeneity, maintains plant diversity
DOI:10.1046/j.1461-0248.2002.00333.x URL [本文引用: 1]
Phylogenetic and functional alpha and beta diversity in temperate and tropical tree communities
DOI:10.1890/11-0402.1 URL [本文引用: 1]
Tree co-occurrence and transcriptomic response to drought
DOI:10.1038/s41467-017-02034-w
PMID:29222461
[本文引用: 2]
The distribution and co-occurrence of species are partly the outcome of their interactions with environmental drivers. Drought is a key driver related to the distribution of plant species. Drought events continue to increase in frequency and severity and identifying those aspects of plant function that are related to drought is critical. Here, we perform a community-level analysis of gene expression in relation to experimental drought and relate the similarity in gene set enrichment across species to their natural co-occurrence. Species with similar gene set enrichment in response to experimental drought tend to non-randomly co-occur in a natural stand. We demonstrate that similarity in the transcriptomic response of species to drought is a significantly better indicator of natural co-occurrence than measures of functional trait similarity and phylogenetic relatedness and that transcriptomics has the capacity to greatly enhance ecological investigations of species distributions and community structure.
Geography, environment, and spatial turnover of species in China’s grasslands
DOI:10.1111/j.1600-0587.2012.07713.x URL [本文引用: 3]
Dispersal, environment, and floristic variation of western Amazonian forests
The distribution of plant species, the species compositions of different sites, and the factors that affect them in tropical rain forests are not well understood. The main hypotheses are that species composition is either (i) uniform over large areas, (ii) random but spatially autocorrelated because of dispersal limitation, or (iii) patchy and environmentally determined. Here we test these hypotheses, using a large data set from western Amazonia. The uniformity hypothesis gains no support, but the other hypotheses do. Environmental determinism explains a larger proportion of the variation in floristic differences between sites than does dispersal limitation; together, these processes explain 70 to 75% of the variation. Consequently, it is important that management planning for conservation and resource use take into account both habitat heterogeneity and biogeographic differences.
Climate and soil attributes determine plant species turnover in global drylands
DOI:10.1111/jbi.12377 URL [本文引用: 2]
Soil profile gravel layers. II. Effect on growth and water use by a hybrid forage sorghum
DOI:10.2136/sssaj1971.03615995003500060035x URL [本文引用: 1]
Different ecological processes determined the alpha and beta components of taxonomic, functional, and phylogenetic diversity for plant communities in dryland regions of Northwest China
DOI:10.7717/peerj.6220 URL [本文引用: 4]
Divergent roles of environmental and spatial factors in shaping plant β-diversity of different growth forms in drylands
DOI:10.1016/j.gecco.2021.e01487 URL [本文引用: 2]
Phylogenetic and functional beta diversity in a broad-leaved Korean pine mixed forest in Changbai Mountains, northeastern China
长白山阔叶红松林系统发育和功能性状beta多样性
Relative role of contemporary environment versus history in shaping diversity patterns of China’s woody plants
DOI:10.1111/j.1600-0587.2011.06781.x URL [本文引用: 1]
Phylogenies and community ecology
DOI:10.1146/annurev.ecolsys.33.010802.150448 URL [本文引用: 3]
Vegetation of the Siskiyou Mountains, Oregon and California
DOI:10.2307/1943563 URL [本文引用: 1]
The seed plant flora of the Qaidam Basin and its contiguous mountainous region in Qinghai Province
柴达木盆地及其毗邻山地植物区系研究
Plant species diversity and floral characters in the black gobi desert of China
中国黑戈壁地区植物区系及其物种多样性研究
Phylogenetic structure of desert shrub community in Qaidam Basin
柴达木盆地荒漠灌丛群落谱系结构研究
Why functional traits do not predict tree demographic rates
DOI:10.1016/j.tree.2018.03.003 URL [本文引用: 1]
Tackling on environmental changes in Tibetan Plateau with focus on water, ecosystem and adaptation
DOI:10.1016/j.scib.2019.03.033 URL [本文引用: 1]
Spatial pattern of plant species diversity and the influencing factors in a gobi desert within the Heihe River basin, Northwest China
DOI:10.1007/s40333-017-0056-9 URL [本文引用: 2]
Composition of seed plant species and floristic features in the gobi area of the northern Qinghai-Tibet Plateau of China
中国青藏高原北部戈壁区种子植物物种组成及其区系特征
The biomass allocation patterns of desert shrub vegetation in the Qaidam Basin, Qinghai, China
柴达木盆地几种荒漠灌丛植被的生物量分配格局
Canopy structure is an important factor driving local-scale woody plant functional beta diversity
DOI:10.17520/biods.2020092 URL [本文引用: 2]
林冠结构是局域尺度木本植物功能性状beta多样性形成的重要驱动力
DOI:10.17520/biods.2020092
[本文引用: 2]
功能性状beta多样性反映了群落间功能性状组成的差异, 解析其形成机制是群落生态学研究的核心内容之一。本研究以云南西双版纳热带季节雨林20 ha动态监测样地为研究对象, 测定木本植物11个重要的功能性状, 采用多度加权的平均最近邻体性状距离度量不同取样尺度的功能性状beta多样性, 基于距离矩阵的多元回归方法解析林冠结构差异、环境异质性、空间距离在功能性状beta多样性格局形成中的相对作用。结果表明, 对于所有木本植物个体(DBH ≥ 1 cm)而言, 同时考虑林冠结构、环境和空间距离的模型为解释功能性状beta多样性格局的最优模型; 在3个不同取样尺度上, 林冠结构差异和环境距离都对功能性状beta多样性具有较大的解释力, 且随着取样尺度的增大而上升, 空间距离的作用基本可以忽略。本研究证实了林冠结构是局域尺度木本植物功能性状beta多样性格局形成的重要驱动力, 这一发现更新了环境异质性和空间距离是驱动功能性状beta多样性格局形成的主要因素的传统认知, 为将来研究功能性状beta多样性形成机制提供新的视角, 并证实了取样尺度在解析木本植物功能性状beta多样性格局形成机制中的重要性。
