


仿真(或称为模拟, simulation), 泛指基于实验或训练目的, 从一个真实系统中抽象其运行规律, 通过建模来表征其关键特性或者行为、功能, 并用数学方式予以系统化与公式化, 对关键特征做出模拟。在模拟过程中, 模型(model)表示被模拟系统自身, 而仿真则表示该系统的时序行为。一般认为仿真系统最早出现在20世纪初期, 用于模拟在真实情况下难以实现的场景。例如, 利用林克仪表飞行模拟训练器, 短时间内集中训练出具备实战能力的飞行员, 减少真实训练场景下飞行员的伤亡, 这种仿真一般称为物理仿真阶段。在20世纪50、60年代, 随着计算机的出现产生了数字仿真技术, 并逐渐被广泛应用于高能物理学实验、机械制造、航空航天等多个领域。随着信息技术、计算机技术、计算机网络技术、图形图像处理技术等飞速发展, 人们开始在计算机中描述和建立客观世界中的事物以及它们之间的关系, 从而发展出虚拟仿真技术。虚拟仿真技术基于计算机的强大计算能力, 通过建立复杂模型, 利用迭代方式模拟真实场景在不同预设条件下的发展方向并预测其未知变化趋势。该技术已经被广泛应用于各个研究领域。
在广义生物学领域, 仿真系统已经被广泛应用于细胞转化过程仿真、蛋白质结构预测及器官模拟等多个具有复杂结构关系的混沌系统中。自2018年AlphaFold项目发布以来(AlQuraishi, 2019), 经过4年发展, 已经可以利用仿真系统和人工智能算法准确预测海量蛋白质结构(Tunyasuvunakool et al, 2021), 包括植物、细菌、真菌在内的100万个物种、超过20亿个蛋白质结构, 其中80%的结构可信度达到了足以支撑研究实验的水平, 35%达到了高置信度(DeepMind, 2022), 且数据全部免费开放, 为相关领域研究人员进一步分析蛋白质的理化性质提供了有力的基础数据保障。在人体器官模拟领域, 通过微生理系统模型(microphysiological systems)和微流器官芯片(microfluidic organ chip)可以模拟组织发生和许多生物学功能, 包括药物代谢和细胞毒性反应, 以及在细胞和组织水平上模拟各种疾病状态(Ingber, 2022)。该技术已在体外再现了人体肝脏-胰岛交互作用特点及其在生理和病理条件下的糖调控响应(Tao et al, 2022), 或利用3D打印技术重建肝脏组织模型用以模拟肝组织构建过程和体内移植等(Liu et al, 2021)。
在上述研究领域已有的成功案例中, 仿真系统大都用来模拟实验手段难以实施的复杂系统。而生态系统作为典型的复杂系统, 将仿真应用在生态学相关研究中具有天然契合性, 也已然获得了广泛的应用。本文主要从物种丰度和种间关系多样性等角度介绍仿真系统在物种多样性研究中的应用。
1 仿真系统在物种多样性研究中的应用
1.1 生物多样性研究与物种多样性指数
生物多样性指生物、生态环境因子相互作用形成的复杂结构及由此导致的包括种间关系、生物/非生物互作等一系列生态过程的总和, 由遗传多样性、物种多样性和生态系统多样性3个层次组成(马克平, 1993)。在全球变化和生物多样性丧失加速的背景下, 生物多样性研究与保护已成为21世纪全球焦点问题和面临的挑战之一(
为了从多角度评价物种多样性特征, 在Fisher指数(Fisher’s index) (Fisher et al, 1943)提出后近80年间, 学者们已经提出了包括Shannon指数(Shannon’s index) (Shannon, 1948; Spellerberg & Fedor, 2003)、Simpson指数(Simpson’s index) (Simpson, 1949)、Pielou指数(Pielou’s index) (Pielou, 1966)、Hill指数(Hill’s numbers) (Hill, 1973)、Hurlbert指数(Hurlbert’s index) (Hurlbert, 1971)等数十种物种多样性评价指标, 从生境内特征(within habitat diversity, α多样性)、生境间(between habitat diversity, β多样性)及更大区域或大陆(regional diversity, γ多样性) 3个尺度评价物种多样性的丰富度、均匀度、稀有性及完整性等特征。然而, 这些指标都需要尽量完善的物种分布数据作为支持。尽管科学家尽了最大努力, 但获取完整物种分布数据困难, 目前尚无很好的方法解决这一问题(Chase & Knight, 2013; Murphy & Lenoir, 2021)。
1.2 数据缺失导致的物种多样性研究困难
物种分布是生态学研究的基础, 是生物地理学和进化生物学研究的必备条件。物种多样性纬度梯度格局、拉伯波特法则、群落构建过程与维持稳定机制等生态学研究的重要假说皆以物种分布为基本数据单元。简言之, 计算上述生物多样性指数都需基于详实、准确的物种分布和种群密度数据。但可获得的真实分布数据存在的各种缺陷(如物种识别错误、坐标误差、采样偏差及数据缺失等)都会影响数据分析过程和最终结论。从亚历山大·洪堡(Alexander Humboldt, 1769-1859)算起, 人类文明有计划、有目的性地记录物种分布数据仅有200多年历史, 相对于物种多样性格局形成时间(十几到数百万年)具有极大偏差。尽管科学家们建立了全球生物多样性信息网络(GBIF)等数据共享平台(纪力强等, 2004; GBIF, 2022), 但现存物种分布数据的记录受到自然条件、采样地点可到达性、物种可被观察到的概率等多方面限制, 距离能完美地支撑物种多样性分布格局等相关研究尚有很大差距(Hughes et al, 2021a)。此外, 物种分布范围并非一成不变: 物种分布在短时间尺度下会受到环境变化的影响, 而在长时间尺度下, 则受到物种因进化所导致的环境适应性变化所影响。这些都会导致物种多样性数据缺失, 使研究人员难以准确开展生物多样性评价等研究。因此, 使用物种实际分布数据解析多样性格局并验证相关假说将具有很大不确定性。为此, 研究中需要引入虚拟物种概念。虚拟物种是建立在真实或虚拟环境信息上的人工生命, 是简化、抽象的物种。它具有数据易获得、数据质量可控、避免过度模拟等优势, 目前已被广泛用于评估物种特性、抽样偏差、地理信息、出现/缺失标准等对物种分布模型性能的影响(Meynard & Kaplan, 2013; Miller, 2014; Qiao et al, 2016a, 2017; Feng & Qiao, 2022)。诚然, 科学问题的解决最终依赖真实物种数据, 然而受限于人力、资金、数据获取技术等多种因素的制约, 在很多大尺度生态学研究与可预见的未来我们都无法获得理想的数据。因此, 虚拟物种成为了大尺度研究中不可或缺的重要工具, 有利于解决真实数据尚不能解决的科学问题。那么, 如何利用数值模拟方法建立虚拟物种, 预测其分布范围并模拟其扩散规律, 已成为科学家面临的重要问题之一。
1.3 物种多样性研究与数值模拟
自然状态下物种分布和种群密度受到非生物性因素(温度、降水等)、生物性因素(种间关系、初级生产力等)及可到达性(山脉、河流、海洋等天然屏障)等各种因素在不同时空尺度下的影响, 同时这些因素之间又存在复杂的交互作用(Peterson et al, 2011)。这些都导致难以准确地描述物种多样性分布格局、分析格局形成过程中的影响因素以及预测未来物种多样性变化等。而数值模拟方法具有全程可控、细节可追溯等内在优势, 将其引入到生物多样性研究中可以弥补物种数据不足、采样偏差以及历史数据缺失等缺陷。
在物种多样性分布格局研究中引入数值模拟, 需要根据模拟需要, 将影响物种分布格局的各种因素和规则逐一抽象化, 并映射到模拟系统对应的模块中(Qiao et al, 2016b)。数值模拟的过程首先需要明确希望讨论的生态学问题, 设置合适的目标函数(或零假设与备择假设); 在此基础上, 我们需要在广泛搜集数据的基础上, 根据物种共同特点提取出抽象的概念建立虚拟物种, 并结合科学问题建立合理的、能用数学公式表达的规则; 在概念模型建立以后, 需要设置模型中的每一个参数并运行模型, 如果时间和计算能力允许, 最理想状态是建立一个参数全集; 接下来, 需要对每一个参数组合运行模型, 将得到的结果与经验数据进行比较, 直至得到满意的模拟结果。图1展示了建立一个经典数值模拟系统的基本流程。如果将物种多样性格局的形成过程形容成一台戏剧, 则物种是其中的角色, 物种分布范围是舞台, 而决定物种分布格局形成的因素则是整个戏剧的脚本。模拟系统所做的工作则是针对这3个元素分别抽象建模, 并有机结合在一起, 形成一台完整的戏剧。
图1
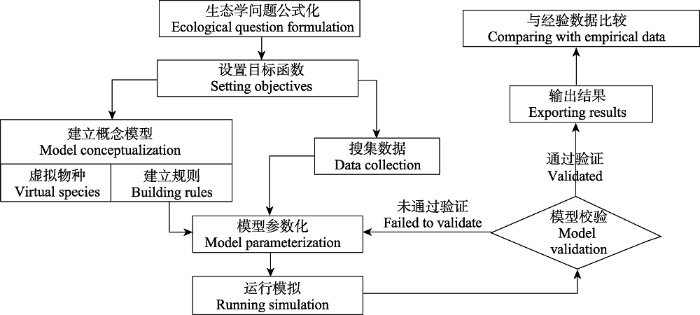
图1
用数值模拟模型重建生态问题的规范流程
Fig. 1
Canonical flowchart for designing a numerical simulation model to reconstruct a ecological question
1.3.1 构建虚拟世界
建立虚拟物种的研究通常伴随在探讨模型性能的工作中。例如根据物种对多环境因子的反应曲线建立基于哈钦森超体积生态位的虚拟物种, 并用其讨论生态位因子分析(ecological niche factor analysis, ENFA)和广义线性模型(generalised linear model, GLM)在预测物种分布过程中的效果(Hirzel et al, 2001); 利用最小体积椭球体(minimum volume ellipsoid, MVE)在多维空间中建立虚拟生态位, 并映射到地理空间形成虚拟物种的方法研究生态位模型对格林内尔生态位(Grinnellian niche)、埃尔顿生态位(Eltonian niche)和哈钦森生态位(Hutchinsonian niche)的解释能力(Qiao et al, 2015; Soberón & Peterson, 2020)、探讨对属及其以上分类阶元的生态位建模可能性(Qiao et al, 2017; Smith et al, 2019)以及基于个体的生态进化系统来模拟固着生物在具有不同程度和规模的不稳定性环境中的进化(Furness et al, 2021)等。为了让虚拟物种应用到更多研究场合, 已经开发出了virtualspecies (Leroy et al, 2016)、NicheA (Qiao et al, 2016a)、REvoSim (Garwood et al, 2019)、sdmvspecies (Duan et al, 2015)及SDMtune (Vignali et al, 2020)等一系列工具用于批量创建虚拟物种; 为了便于在不同研究中共用相同虚拟物种以相互印证, 也发布了700,000次随机观察的标准虚拟物种库(Garzon-Lopez et al, 2016)。这些都可用于物种分布模型测试、物种分布格局分析等。
在完成虚拟物种构建后, 为了探讨物种多样性分布格局, 需要构建虚拟场景进一步对物种分布进行模拟。一般来说, 物种分布主要受到温度、降水等非生物性因素、种间关系等生物性因素以及由地形与人类活动等隔离因素导致的物种可扩散(dispersible)能力等3类因素影响(Soberón & Nakamura, 2009)。这3类因素发挥作用的时空尺度并不一致。其中, 非生物性因素强调物种环境适应性, 作用于较大区域或全球尺度, 而生物性因素则强调在局地/群落尺度下种间关系等因素对物种分布的影响。可扩散性则根据研究问题不同, 作用于从全球到局地多个尺度。因此, 在设计虚拟场景时, 需要根据科学问题分别设计。
首先, 需要构建非生物性因素的虚拟场景。目前常规手段是使用地球系统模型(earth system models, ESM)或其前身全球气候模型(global climate models, GCM)来构建非生物性因素主导的虚拟环境。ESM的核心方法继承了GCM的大气和海洋成分, 添加了全球碳循环、动态植被、大气化学、海洋生物地球化学和大陆冰盖等多种因素, 并无需预先输入确定的大气成分(如气溶胶和温室气体等)即可以模拟这些成分随时间的变化, 以及如何响应人类活动和不断变化的气候条件(Hajima et al, 2014)。因此, ESM能够更完整地代表人类对气候的影响, 例如砍伐森林和温室气体排放。利用ESM重建历史气候及预测不同排放场景下的未来气候, 已经被广泛应用于历史生物地理学以及全球变化生态学等多方面研究中(Trisos et al, 2020; Henson et al, 2021; Tittensor et al, 2021)。
在完成对物种生态位和非生物性因素建模后, 需要加入生物性因素和物种本身扩散能力两类因素才能完整地模拟物种分布在动态环境中的变化情况。与非生物性因素相对应, 生物性因素强调影响种群规模等与生物相关的因素, 特别是生物间相互作用。生物性因素的影响主要发生在两个不同层面: 种间效应是物种间直接相互作用, 而种内效应代表物种内个体间相互作用。种内效应逻辑相对简单, 一般使用Robert May种群增长模型及其变体(May, 1974, 1976; Ginzburg et al, 2010)即可实现对种群密度的分析和模拟; 而种间关系则复杂得多, 需要用到物种相互作用模型来分析, 以确定群落中某个位置是否被两个不同物种占据, 以及它们彼此间的相互作用(Hardin, 1960)。两个物种之间的作用结果可以使用方程式来预测, 其中最著名的模型之一是Lotka-Volterra模型(Volterra, 1928; Lotka, 1932)。该模型将两个物种的种群密度、环境承载能力和种间互作关系关联, 并给出互相排斥或共存的结果。当然, 竞争只是复杂种间关系中的一种, 取食、捕食、寄生、共生、传粉等种间关系均需要选择相应的模型来进行分析和推演, 而当多种关系关联在一起形成复杂群落时, 则需要相应的复杂动力学模型来预测群落结构、种群动态以及物种分布等(Rota et al, 2016; Devarajan et al, 2020; Seshagiri & Kalyani, 2020)。
同样, 物种能否通过扩散及时地改变其分布范围, 从而在变化的环境中找到新适生区, 是在全球变暖背景下研究气候变化对生物多样性格局影响的重要因素。传统上通常使用环志和微型传感器(大型脊椎动物)、飞行磨吊飞(昆虫)、风洞(植物)及同位素跟踪(昆虫/植物)等实验手段来研究特定物种的飞行能力, 探讨其分布对环境变化的响应。然而这些手段受时间、人力、经费等多种因素影响, 只能针对某些物种, 而无法做到大规模应用, 因此需要利用已有数据建模, 并利用其他可获得性特征来预测更多物种的扩散能力。利用模型预测物种扩散能力的研究在各个生物类群中均有展开, 如利用植物种子扩散特征(风、河流、动物、自身弹射等)、植物生活型(乔木、灌木、草本)、种子质量及种子释放高度和不同组合的终端速度作为解释变量, 利用线性混合模型来解释变量并预测超过500种扩散类型的植物的最大扩散距离(Cain et al, 2000; Tamme et al, 2014); 利用系统发育信息和形态特征(翼尖长度、喙深度等)来预测鸟类最大出生扩散距离(Dawideit et al, 2009); 以及利用家域范围、地理分布大小和体重来预测哺乳动物出生扩散距离等(Whitmee & Orme, 2013)。
1.3.2 虚拟世界在物种多样性格局研究中的案例
在上文中已经系统介绍了构建针对物种多样性建立虚拟世界所需的必要元素, 包括物种环境生态位、扩散能力、种间关系及变化的环境等。考虑到各类元素对物种分布格局影响的时空尺度不同, 可以有选择的整合部分或全部因素来进行模拟。
半个多世纪以前, Robert T. Paine就利用虚拟物种构建群落食物网结构, 从纯数学角度讨论了食物网复杂度与物种多样性的关系(Paine, 1966)。尽管其研究不能称之为严格意义上的仿真模拟, 但也为该领域奠定了理论和方法学基础。后续诸多研究, 如探讨复杂食物网中的隔离与子网对其稳定性的影响(Stouffer & Bascompte, 2011)、利用食物网复杂度等相关理论评价网络隔离对生态稳定性的影响(McDonald-Madden et al, 2016)等, 都是在群落尺度上利用数值模拟讨论种间关系复杂度对物种多样性影响的典型案例。在跨群落尺度上, May等(2018)利用mobsim软件包在空间明确的景观中模拟了不同物种的个体丰度和分布, 定义了多个群落关键属性(个体总数、物种丰度分布和种内空间聚集程度等), 推导出生物多样性相关指标并比较了多个群落结构在不同采样模式和强度下生物多样性相关指标的表现。在保护地规划方面, 数值模拟可以利用人工智能方法对保护区进行优先排序, 量化区域和生物多样性保护的成本和收益之间的权衡, 实现在有限预算下规划比随机或人为选择更有效的保护策略(Silvestro et al, 2022)。在更大时空尺度上已经完成了区域或全球尺度的物种扩散与生态位演化模拟, 分析了物种生态位宽度、扩散能力、环境变化速率与物种灭绝和新物种形成的关系(Qiao et al, 2016b); 模拟环境因素在物种多样性纬度梯度形成过程中的作用(Saupe et al, 2019a, b), 模拟过去80万年南美洲鸟类多样性形成过程, 证实了地形和气候驱动物种进化和物种多样性形成过程(Rangel et al, 2018), 以及模拟物种在奥陶纪晚期、上新世到更新世等地质历史时期的扩散过程, 讨论地形因素对物种灭绝的影响(Saupe et al, 2020)等, 这些都是模拟系统在物种多样性分布格局等相关研究中的典型案例。Hagen等(2021) 还开发了专门对生物多样性形成过程进行生态进化模拟的通用引擎gen3sis。
2 在物种多样性格局研究中应用数值模拟的优缺点
基于数值模拟的虚拟世界是将信息科学技术和生态学研究进行交叉, 充分利用计算机运算能力来重现复杂生态学过程。基于超级计算机的数值模拟系统具有较强的灵活性, 其不受时间、空间、条件限制, 可以从时间上大大缩短需要几十年甚至上亿年的生态进程; 通过改变模型结构和参数, 能方便地解释通过实验手段无法验证的科学问题并验证未知的结构和过程; 通过完整的参数组合, 数值模拟系统可以处理某些带随机因素的复杂系统, 如各种排放场景下全球气候变化对物种多样性格局的影响等。
然而, 数值模拟系统也并非完美或无所不能。由于多数虚拟世界模拟的是未知状态, 缺乏统一可信的测量尺度。模拟过程中用到的物种生态位、扩散模式、种间互作以及环境变化等因素都是由建模者建立, 其与真实情况的匹配程度受到模型精度、建模者对模拟系统熟悉程度、计算机算力等多种因素影响, 因此, 模拟结果往往是复杂度、运算时间与建模难度多方妥协的结果。特别是当处理多物种建模工作时, 种群密度是个典型的马尔科夫链过程(当前状态受到且仅受到上一个状态影响), 而种间互作关系又与种群密度直接相关, 这些都导致对其建模过程中无法高效使用计算科学领域的并行计算等手段, 因此运行效率低, 占据资源多, 无法进行大规模数值模拟。
此外, 如果研究者在建模过程中被自己预先设计的结果影响, 会导致结果主观性较强, 产生有倾向性的模拟结果。“没有免费的午餐”原理表明, 当建模的目标函数是全集时, 任何一种模型效果都不会好于随机模型。即“所有模型都是错的, 但有部分模型是有用的”。当模拟模型尽可能多地考虑到生态系统真实发生的事件后, 就必然要引入更多参数, 而通过参数调控则可以人为控制模拟系统走向。当然, 这种人为控制在一定程度上可以认为是对特定生态系统的模拟, 但超过一定限度则会被认为是因人工痕迹过于明显而导致模拟失败。
另外, 数值模拟系统的结果需要和真实数据进行比较, 从而验证其有效性。但之所以使用数值模拟, 正是因为时空条件限制导致真实数据偏差和不足, 从而无法解释某些自然现象。所以, 模拟结果与真实数据相比较只能在小范围内进行。然而, 小范围内效果良好的模拟能否有效地拓展到更大的未知时空尺度, 这些都是模拟系统在实际研究中可能存在的不足。
3 展望
物种多样性格局变化是一个漫长而复杂的过程。理解这些过程随时间的变化机制需要整合宏观进化、古生物学、生物地理学、群落生态学等多学科理论与研究手段。对大尺度生物多样性格局的研究已达到全球范围, 关于生物多样性格局形成的驱动因素已经很难通过绘制物种地理分布图或采用传统相关分析获得。事实上, 宏观生态学现在正将重点从寻找生态学现象与环境因素相关性, 转移到从因果关系角度预测和解释观察到的生物多样性模式上来。模拟系统以其速度快、可模拟模式多及全过程记录等特点, 为突破现有生物多样性研究中数据积累困难、采样偏差大、格局变化过程不清晰等现有瓶颈提供了一个新的视角和解决方式。与此同时, 随着科技发展, 以“空天地一体化”为代表的数据获取新手段也层出不穷, 科学家获取的真实生物多样性数据越来越多。如何将新获得的数据用于验证数值模拟结果并改进模型, 与此同时, 改进后的模型如何进一步指导数据获取技术革新, 让真实数据与数值模拟两个领域相互促进, 达到螺旋式上升, 将是数值模拟系统在未来物种多样性格局研究中最重要的发展方向。
参考文献
AlphaFold at CASP13
DOI:10.1093/bioinformatics/btz422
PMID:31116374
[本文引用: 1]

Computational prediction of protein structure from sequence is broadly viewed as a foundational problem of biochemistry and one of the most difficult challenges in bioinformatics. Once every two years the Critical Assessment of protein Structure Prediction (CASP) experiments are held to assess the state of the art in the field in a blind fashion, by presenting predictor groups with protein sequences whose structures have been solved but have not yet been made publicly available. The first CASP was organized in 1994, and the latest, CASP13, took place last December, when for the first time the industrial laboratory DeepMind entered the competition. DeepMind's entry, AlphaFold, placed first in the Free Modeling (FM) category, which assesses methods on their ability to predict novel protein folds (the Zhang group placed first in the Template-Based Modeling (TBM) category, which assess methods on predicting proteins whose folds are related to ones already in the Protein Data Bank.) DeepMind's success generated significant public interest. Their approach builds on two ideas developed in the academic community during the preceding decade: (i) the use of co-evolutionary analysis to map residue co-variation in protein sequence to physical contact in protein structure, and (ii) the application of deep neural networks to robustly identify patterns in protein sequence and co-evolutionary couplings and convert them into contact maps. In this Letter, we contextualize the significance of DeepMind's entry within the broader history of CASP, relate AlphaFold's methodological advances to prior work, and speculate on the future of this important problem.© The Author(s) 2019. Published by Oxford University Press. All rights reserved. For permissions, please e-mail: journals.permissions@oup.com.
Long-distance seed dispersal in plant populations
Long-distance seed dispersal influences many key aspects of the biology of plants, including spread of invasive species, metapopulation dynamics, and diversity and dynamics in plant communities. However, because long-distance seed dispersal is inherently hard to measure, there are few data sets that characterize the tails of seed dispersal curves. This paper is structured around two lines of argument. First, we argue that long-distance seed dispersal is of critical importance and, hence, that we must collect better data from the tails of seed dispersal curves. To make the case for the importance of long-distance seed dispersal, we review existing data and models of long-distance seed dispersal, focusing on situations in which seeds that travel long distances have a critical impact (colonization of islands, Holocene migrations, response to global change, metapopulation biology). Second, we argue that genetic methods provide a broadly applicable way to monitor long-distance seed dispersal; to place this argument in context, we review genetic estimates of plant migration rates. At present, several promising genetic approaches for estimating long-distance seed dispersal are under active development, including assignment methods, likelihood methods, genealogical methods, and genealogical/demographic methods. We close the paper by discussing important but as yet largely unexplored areas for future research.
Accelerated modern human-induced species losses: Entering the sixth mass extinction
DOI:10.1126/sciadv.1400253 URL [本文引用: 1]
Scale-dependent effect sizes of ecological drivers on biodiversity: Why standardised sampling is not enough
DOI:10.1111/ele.12112 URL [本文引用: 1]
Ecomorphological predictors of natal dispersal distances in birds
DOI:10.1111/j.1365-2656.2008.01504.x
PMID:19040685
[本文引用: 1]
1. Dispersal is one of the key ecological parameters but it is very difficult to quantify directly. As a consequence, empirical studies often ignore dispersal or use indirect measures. 2. Ringing data have previously been used to estimate the natal dispersal distances of 47 British passerine bird species. This provides an excellent opportunity to examine the potential of various indirect measures to predict natal dispersal distances in British birds. 3. We use a phylogenetic comparative framework and single- and multipredictor models including ecomorphological, behavioural or ecological traits to predict natal dispersal distance. 4. A multipredictor model that includes Kipp's distance (a measure of wing tip length), bill depth and tail graduation explains 45% of the interspecific variation in natal dispersal distance. These morphological characters all relate to aerodynamics with stronger flyers dispersing further. 5. However, an index of migration is a strong (but less informative) correlate of dispersal distance and Kipp's distance and bill depth are strong correlates of migration. Thus, we cannot disentangle whether these ecomorphological traits influence dispersal distance directly or whether the relationship between ecomorphology and dispersal is mediated through migratory behaviour. 6. Notwithstanding uncertainties regarding the causal links between dispersal distance and wing morphology, we suggest that two ecomorphological traits, Kipp's distance and bill depth, may provide a useful surrogate.
Multi-species occupancy models: Review, roadmap, and recommendations
DOI:10.1111/ecog.04957 URL [本文引用: 1]
Changing trends and persisting biases in three decades of conservation science
DOI:10.1016/j.gecco.2017.01.008 URL [本文引用: 1]
Global state of biodiversity and loss
DOI:10.1146/annurev.energy.28.050302.105532 URL [本文引用: 1]
SDMvspecies: A software for creating virtual species for species distribution modelling
DOI:10.1111/ecog.01080 URL [本文引用: 1]
Most ‘global reviews of species’ responses to climate change are not truly global
DOI:10.1111/ddi.12517 URL [本文引用: 1]
Accounting for dispersal using simulated data improves understanding of species abundance patterns
DOI:10.1111/geb.13412 URL [本文引用: 1]
The relation between the number of species and the number of individuals in a random sample of an animal population
DOI:10.2307/1411 URL [本文引用: 1]
Evolutionary simulations clarify and reconcile biodiversity- disturbance models
RE voSim: Organism-level simulation of macro and microevolution
DOI:10.1111/pala.12420 URL [本文引用: 1]
A virtual species set for robust and reproducible species distribution modelling tests
DOI:10.1016/j.dib.2016.02.058
PMID:27014734
[本文引用: 1]
Predicting species potential and future distribution has become a relevant tool in biodiversity monitoring and conservation. In this data article we present the suitability map of a virtual species generated based on two bioclimatic variables, and a dataset containing more than 700,000 random observations at the extent of Europe. The dataset includes spatial attributes such as: distance to roads, protected areas, country codes, and the habitat suitability of two spatially clustered species (grassland and forest species) and a wide-spread species.
The May threshold and life-history allometry
DOI:10.1098/rsbl.2010.0452
PMID:20591855
[本文引用: 1]
One of Robert May's classic results was finding that population dynamics become chaotic when the average lifetime rate of reproduction exceeds a certain value. Populations whose reproductive rates exceed this May threshold probably become extinct. The May threshold in each case depends upon the shape of the density-dependence curve, which differs among models of population growth. However, species of different sizes and generation times that share a roughly similar density-dependence curve will also share a similar May threshold. Here, we argue that this fact predicts a striking allometric regularity among animal taxa: lifetime reproductive rate should be roughly independent of body size. Such independence has been observed in diverse taxa, but has usually been ascribed to a fortuitous combination of physiologically based life-history allometries. We suggest, instead, that the ecological elimination of unstable populations within groups that share a value of the May threshold is a likely cause of this allometry.
gen3sis: A general engine for eco-evolutionary simulations of the processes that shape Earth’s biodiversity
DOI:10.1371/journal.pbio.3001340 URL [本文引用: 1]
Modeling in Earth system science up to and beyond IPCC AR5
DOI:10.1186/2197-4284-1-1 URL [本文引用: 1]
The competitive exclusion principle: An idea that took a century to be born has implications in ecology, economics, and genetics
Future phytoplankton diversity in a changing climate
DOI:10.1038/s41467-021-25699-w
PMID:34508102
[本文引用: 1]
The future response of marine ecosystem diversity to continued anthropogenic forcing is poorly constrained. Phytoplankton are a diverse set of organisms that form the base of the marine ecosystem. Currently, ocean biogeochemistry and ecosystem models used for climate change projections typically include only 2-3 phytoplankton types and are, therefore, too simple to adequately assess the potential for changes in plankton community structure. Here, we analyse a complex ecosystem model with 35 phytoplankton types to evaluate the changes in phytoplankton community composition, turnover and size structure over the 21st century. We find that the rate of turnover in the phytoplankton community becomes faster during this century, that is, the community structure becomes increasingly unstable in response to climate change. Combined with alterations to phytoplankton diversity, our results imply a loss of ecological resilience with likely knock-on effects on the productivity and functioning of the marine environment.© 2021. The Author(s).
Diversity and evenness: A unifying notation and its consequences
DOI:10.2307/1934352 URL [本文引用: 1]
Assessing habitat- suitability models with a virtual species
DOI:10.1016/S0304-3800(01)00396-9 URL [本文引用: 1]
Extinction targets are not SMART (specific, measurable, ambitious, realistic, and time bound)
DOI:10.1093/biosci/biaa148 URL [本文引用: 1]
Sampling biases shape our view of the natural world
DOI:10.1111/ecog.05926 URL [本文引用: 1]
Effectively and accurately mapping global biodiversity patterns for different regions and taxa
DOI:10.1111/geb.13304 URL [本文引用: 1]
The nonconcept of species diversity: A critique and alternative parameters
DOI:10.2307/1934145
PMID:28973811
[本文引用: 1]
The recent literature on species diversity contains many semantic, conceptual, and technical problems. It is suggested that, as a result of these problems, species diversity has become a meaningless concept, that the term be abandoned, and that ecologists take a more critical approach to species-number relations and rely less on information theoretic and other analogies. As multispecific collections of organisms possess numerous statistical properties which conform to the conventional criteria for diversity indices, such collections are not intrinsically arrangeable in linear order along some diversity scale. Several such properties or "species composition parameters" having straightforward biological interpretations are presented as alternatives to the diversity approach. The two most basic of these are simply ▵ =[n/n-1][ ( _i/_N) ] =the proportion of potential interindividual encounters which is interspecific (as opposed to intraspecific), assuming every individual in the collection can encounter all other individuals, E(S ) = [1-( )/( )] =the expected number of species in a sample of n individuals selected at random from a collection containing N individuals, S species, and N individuals in the ith species.© 1971 by the Ecological Society of America.
Human organs-on-chips for disease modelling, drug development and personalized medicine
DOI:10.1038/s41576-022-00466-9 URL [本文引用: 1]
virtualspecies, an R package to generate virtual species distributions
3D liver tissue model with branched vascular networks by multimaterial bioprinting
Contribution to the mathematical theory of capture
On the concept of biodiversity
试论生物多样性的概念
mobsim: An R package for the simulation and measurement of biodiversity across spatial scales
DOI:10.1111/2041-210X.12986 URL [本文引用: 1]
Biological populations with nonoverlapping generations: Stable points, stable cycles, and chaos
Some of the simplest nonlinear difference equations describing the growth of biological populations with nonoverlapping generations can exhibit a remarkable spectrum of dynamical behavior, from stable equilibrium points, to stable cyclic oscillations between 2 population points, to stable cycles with 4, 8, 16,... points, through to a chaotic regime in which (depending on the initial population value) cycles of any period, or even totally aperiodic but boundedpopulation fluctuations, can occur. This rich dynamical structure is overlooked in conventional linearized analyses; its existence in such fully deterministic nonlinear difference equations is a fact of considerable mathematical and ecological interest.
Simple mathematical models with very complicated dynamics
DOI:10.1038/261459a0 URL [本文引用: 1]
Using food-web theory to conserve ecosystems
DOI:10.1038/ncomms10245
PMID:26776253
[本文引用: 1]
Food-web theory can be a powerful guide to the management of complex ecosystems. However, we show that indices of species importance common in food-web and network theory can be a poor guide to ecosystem management, resulting in significantly more extinctions than necessary. We use Bayesian Networks and Constrained Combinatorial Optimization to find optimal management strategies for a wide range of real and hypothetical food webs. This Artificial Intelligence approach provides the ability to test the performance of any index for prioritizing species management in a network. While no single network theory index provides an appropriate guide to management for all food webs, a modified version of the Google PageRank algorithm reliably minimizes the chance and severity of negative outcomes. Our analysis shows that by prioritizing ecosystem management based on the network-wide impact of species protection rather than species loss, we can substantially improve conservation outcomes.
Using virtual species to study species distributions and model performance
DOI:10.1111/jbi.12006 URL [本文引用: 1]
Virtual species distribution models: Using simulated data to evaluate aspects of model performance
Sampling units derived from geopolitical boundaries bias biodiversity analyses
DOI:10.1111/geb.13352 URL [本文引用: 1]
Food web complexity and species diversity
DOI:10.1086/282400 URL [本文引用: 1]
The measurement of diversity in different types of biological collections
DOI:10.1016/0022-5193(66)90013-0 URL [本文引用: 1]
NicheA: Creating virtual species and ecological niches in multivariate environmental scenarios
DOI:10.1111/ecog.01961 URL [本文引用: 2]
Using data from related species to overcome spatial sampling bias and associated limitations in ecological niche modelling
DOI:10.1111/2041-210X.12832 URL [本文引用: 2]
Impacts of niche breadth and dispersal ability on macroevolutionary patterns
DOI:10.1086/687201 URL [本文引用: 2]
No silver bullets in correlative ecological niche modelling: Insights from testing among many potential algorithms for niche estimation
DOI:10.1111/2041-210X.12397 URL [本文引用: 1]
Modeling the ecology and evolution of biodiversity: Biogeographical cradles, museums, and graves
DOI:10.1126/science.aar5452 URL [本文引用: 1]
A multispecies occupancy model for two or more interacting species
DOI:10.1111/2041-210X.12587 URL [本文引用: 1]
Non-random latitudinal gradients in range size and niche breadth predicted by spatial patterns of climate
DOI:10.1111/geb.12904 URL [本文引用: 1]
Spatio-temporal climate change contributes to latitudinal diversity gradients
Extinction intensity during Ordovician and Cenozoic glaciations explained by cooling and palaeogeography
DOI:10.1038/s41561-019-0504-6 URL [本文引用: 1]
Ecological models on multi species interaction within unlimited resources
DOI:10.1007/s40819-020-00847-w URL [本文引用: 1]
A mathematical theory of communication
DOI:10.1002/j.1538-7305.1948.tb01338.x URL [本文引用: 1]
Improving biodiversity protection through artificial intelligence
DOI:10.1038/s41893-022-00851-6
PMID:35614933
[本文引用: 1]
Over a million species face extinction, urging the need for conservation policies that maximize the protection of biodiversity to sustain its manifold contributions to people. Here we present a novel framework for spatial conservation prioritization based on reinforcement learning that consistently outperforms available state-of-the-art software using simulated and empirical data. Our methodology, CAPTAIN (Conservation Area Prioritization Through Artificial INtelligence), quantifies the trade-off between the costs and benefits of area and biodiversity protection, allowing the exploration of multiple biodiversity metrics. Under a limited budget, our model protects substantially more species from extinction than areas selected randomly or naively (such as based on species richness). CAPTAIN achieves substantially better solutions with empirical data than alternative software, meeting conservation targets more reliably and generating more interpretable prioritization maps. Regular biodiversity monitoring, even with a degree of inaccuracy characteristic of citizen science surveys, substantially improves biodiversity outcomes. Artificial intelligence holds great promise for improving the conservation and sustainable use of biological and ecosystem values in a rapidly changing and resourcelimited world.
Niche estimation above and below the species level
DOI:10.1016/j.tree.2018.10.012 URL [本文引用: 1]
Niches and distributional areas: Concepts, methods, and assumptions
DOI:10.1073/pnas.0901637106 URL [本文引用: 1]
What is the shape of the fundamental Grinnellian niche?
DOI:10.1007/s12080-019-0432-5 URL [本文引用: 1]
A tribute to Claude Shannon (1916-2001) and a plea for more rigorous use of species richness, species diversity and the ‘Shannon-Wiener’ index
DOI:10.1046/j.1466-822X.2003.00015.x URL [本文引用: 1]
Compartmentalization increases food-web persistence
Predicting species’ maximum dispersal distances from simple plant traits
Many studies have shown plant species' dispersal distances to be strongly related to life-history traits, but how well different traits can predict dispersal distances is not yet known. We used cross-validation techniques and a global data set (576 plant species) to measure the predictive power of simple plant traits to estimate species' maximum dispersal distances. Including dispersal syndrome (wind, animal, ant, ballistic, and no special syndrome), growth form (tree, shrub, herb), seed mass, seed release height, and terminal velocity in different combinations as explanatory variables we constructed models to explain variation in measured maximum dispersal distances and evaluated their power to predict maximum dispersal distances. Predictions are more accurate, but also limited to a particular set of species, if data on more specific traits, such as terminal velocity, are available. The best model (R2 = 0.60) included dispersal syndrome, growth form, and terminal velocity as fixed effects. Reasonable predictions of maximum dispersal distance (R2 = 0.53) are also possible when using only the simplest and most commonly measured traits; dispersal syndrome and growth form together with species taxonomy data. We provide a function (dispeRsal) to be run in the software package R. This enables researchers to estimate maximum dispersal distances with confidence intervals for plant species using measured traits as predictors. Easily obtainable trait data, such as dispersal syndrome (inferred from seed morphology) and growth form, enable predictions to be made for a large number of species.
Microengineered multi-organoid system from hiPSCs to recapitulate human liver-islet axis in normal and type 2 diabetes
DOI:10.1002/advs.202103495 URL [本文引用: 1]
Next-generation ensemble projections reveal higher climate risks for marine ecosystems
DOI:10.1038/s41558-021-01173-9
PMID:34745348
[本文引用: 1]
Projections of climate change impacts on marine ecosystems have revealed long-term declines in global marine animal biomass and unevenly distributed impacts on fisheries. Here we apply an enhanced suite of global marine ecosystem models from the Fisheries and Marine Ecosystem Model Intercomparison Project (Fish-MIP), forced by new-generation Earth system model outputs from Phase 6 of the Coupled Model Intercomparison Project (CMIP6), to provide insights into how projected climate change will affect future ocean ecosystems. Compared with the previous generation CMIP5-forced Fish-MIP ensemble, the new ensemble ecosystem simulations show a greater decline in mean global ocean animal biomass under both strong-mitigation and high-emissions scenarios due to elevated warming, despite greater uncertainty in net primary production in the high-emissions scenario. Regional shifts in the direction of biomass changes highlight the continued and urgent need to reduce uncertainty in the projected responses of marine ecosystems to climate change to help support adaptation planning.© The Author(s) 2021.
The projected timing of abrupt ecological disruption from climate change
DOI:10.1038/s41586-020-2189-9 URL [本文引用: 1]
Highly accurate protein structure prediction for the human proteome
DOI:10.1038/s41586-021-03828-1 URL [本文引用: 1]
SDMtune: An R package to tune and evaluate species distribution models
DOI:10.1002/ece3.6786
PMID:33144979
[本文引用: 1]
Balancing model complexity is a key challenge of modern computational ecology, particularly so since the spread of machine learning algorithms. Species distribution models are often implemented using a wide variety of machine learning algorithms that can be fine-tuned to achieve the best model prediction while avoiding overfitting. We have released, a new R package that aims to facilitate training, tuning, and evaluation of species distribution models in a unified framework. The main innovations of this package are its functions to perform data-driven variable selection, and a novel genetic algorithm to tune model hyperparameters. Real-time and interactive charts are displayed during the execution of several functions to help users understand the effect of removing a variable or varying model hyperparameters on model performance. supports three different metrics to evaluate model performance: the area under the receiver operating characteristic curve, the true skill statistic, and Akaike's information criterion corrected for small sample sizes. It implements four statistical methods: artificial neural networks, boosted regression trees, maximum entropy modeling, and random forest. Moreover, it includes functions to display the outputs and create a final report. therefore represents a new, unified and user-friendly framework for the still-growing field of species distribution modeling.© 2020 The Authors. Ecology and Evolution published by John Wiley & Sons Ltd.
Variations and fluctuations of the number of individuals in animal species living together
DOI:10.1093/icesjms/3.1.3 URL [本文引用: 1]
Predicting dispersal distance in mammals: A trait-based approach
DOI:10.1111/j.1365-2656.2012.02030.x
PMID:22924343
[本文引用: 1]
Dispersal is one of the principal mechanisms influencing ecological and evolutionary processes but quantitative empirical data are unfortunately scarce. As dispersal is likely to influence population responses to climate change, whether by adaptation or by migration, there is an urgent need to obtain estimates of dispersal distance. Cross-species correlative approaches identifying predictors of dispersal distance can provide much-needed insights into this data-scarce area. Here, we describe the compilation of a new data set of natal dispersal distances and use it to test life-history predictors of dispersal distance in mammals and examine the strength of the phylogenetic signal in dispersal distance. We find that both maximum and median dispersal distances have strong phylogenetic signals. No single model performs best in describing either maximum or median dispersal distances when phylogeny is taken into account but many models show high explanatory power, suggesting that dispersal distance per generation can be estimated for mammals with comparatively little data availability. Home range area, geographic range size and body mass are identified as the most important terms across models. Cross-validation of models supports the ability of these variables to predict dispersal distances, suggesting that models may be extended to species where dispersal distance is unknown.© 2012 The Authors. Journal of Animal Ecology © 2012 British Ecological Society.
