


目前人类活动已严重改变了地球上的非生物和生物条件, 并且导致了显著的气候变化(Butchart et al, 2010; Waters et al, 2016), 气候变化是生物多样性丧失的最大威胁之一(Vitousek, 1994)。气候变化会以多种方式改变生物多样性维持的过程, 其中许多过程是不可预测的(Woodward et al, 2010; Cardinale et al, 2012; Forster et al, 2012)。其影响可以遍及整个生态系统, 并改变其功能(Frauendorf et al, 2019; Wieczynski et al, 2019), 生物也可以通过呼吸产生的碳循环形成对气候变化的反馈。估算气候变化导致的生态系统功能改变需要对气候变化如何影响生物多样性有更深入的了解(Bardgett et al, 2008; Kuypers et al, 2018)。
一般用来表征物种多样性的指标有三个, 即alpha、beta和gamma多样性(Whittaker, 1960)。目前alpha (即特定地区或群落的物种丰富度)和gamma多样性(即一个区域的物种多样性)受到了广泛的关注, 而对于beta多样性的研究相对比较薄弱。Beta多样性表示不同群落间的物种组成变化, 它通过计算群落之间的物种差异将alpha和gamma多样性联系起来, 根据群落beta多样性格局的差异, 人们可以推断出群落构建机制在不同群落中的作用, 并且它在揭示跨尺度生物多样性模式的各种生态过程中起着重要作用(Socolar et al, 2016)。沿海拔梯度的beta多样性模式已得到了广泛的研究(吴永杰等, 2013; Teittinen et al, 2016; Vilmi et al, 2019), 可是其研究对象主要为动物和植物(斯幸峰等, 2017)。相比于动植物, 目前对在许多生态过程中起重要作用的微生物(如细菌等)的研究相对较少。其中, 对土壤微生物的海拔模式的研究数量虽然不断增加, 但相比之下水体微生物的研究仍然是相对较少的。因此, 目前对于水体微生物的多样性的海拔分布格局及其驱动因素仍然不很明确。其中一个焦点问题是溪流微生物的beta多样性是否存在一般的海拔分布模式? 如果存在, 其主要驱动因素是什么?
目前, 我们通过传统的beta多样性指数无法识别造成群落差异的原因是因为物种的替换还是得失。为了更好地了解群落差异的潜在模式, 可以将总beta多样性分解为周转和嵌套两个组分, 即beta多样性分解。根据群落间beta多样性来源的相关理论, 2010年Andrés Baselga首次系统地提出了beta多样性划分的一般框架: 基于Sørensen相异性指数, beta多样性可分解成物种周转(turnover, 即物种替换, 其中一个物种替换另一物种而不改变其丰富度)和嵌套(nestedness, 即由于物种得失而导致的物种丰富度差异)两个组分(Baselga, 2010)。造成物种周转发生的机制源自环境过滤、空间和历史事件; 而嵌套过程则源自物种稀疏或其他生态过程, 例如人为干扰或物理屏障, 导致物种贫乏地区的生物群落成为该地区物种丰富度最高群落的子集。在保护生物学中, beta多样性中周转和嵌套组分相对比例的大小分别意味着不同的保护措施: 当beta多样性以周转组分为主时需要同时保护多个位点, 当以嵌套组分为主时可以优先保护物种多样性较高的位点(Gutierrezcanovas et al, 2013)。因此, 分析beta多样性的周转和嵌套过程有利于更好地理解海拔梯度上的群落构建机制(Wang et al, 2012; Mori et al, 2015), 并使生物多样性保护战略更加有效。
细菌在许多生态过程中起重要作用, 越来越多的研究表明细菌的时间和空间分布模式(即生物地理模式)与大型动植物具有一定的相似性, 如距离衰减模式(Martiny et al, 2006; Hanson et al, 2012)。目前的研究已经确定海拔分布模式同样存在于细菌群落中, 但对于其形成的潜在过程却了解很少。目前仍然不太明确驱动细菌生物地理模式的过程是什么, 需要进一步研究。我们研究了西藏横断山区怒江和澜沧江流域的入江溪流中细菌群落的beta多样性及其分解组分。怒江和澜沧江流域的气候条件有着显著差异: 澜沧江流域的气候整体表现为干燥和寒冷, 而怒江流域的气候则为湿润和温暖。我们的采样地点有着明显的海拔和纬度梯度, 相比于只有海拔梯度的研究, 纬度梯度进一步加强了各个地点之间的气候变化。研究的目的是在上述有着显著差异的气候条件下, 探究两个流域中细菌群落的beta多样性及其分解组分沿海拔梯度的分布格局及影响因素。为此, 我们拟探究以下三个问题: (1)两个流域中的细菌beta多样性及其分解组分的海拔分布模式是否有差异? (2)细菌的beta多样性沿着海拔梯度的分布模式及其主要驱动因素是什么? (3)气候变化是否会影响细菌的beta多样性及其分解组分? 通过分析细菌群落数据, 可为气候变化和环境梯度影响生物多样性的形成提供重要见解。
1 材料与方法
1.1 样品采集
青藏高原横断山区是世界生物多样性研究热点区域之一(Myers et al, 2000), 沿着横断山脉有三条相互平行的江(被联合国教科文组织列为世界遗产), 分别为怒江、澜沧江和金沙江。2014年10月, 我们对澜沧江和怒江流域的89条入江溪流进行了采样(图1a): 37条流入澜沧江, 52条流入怒江。尽管两条江在采样区域中是平行的, 但是该区域具有显著的气候差异: 比如, 澜沧江的降水量为420-718 mm, 年平均温度为11.2-17.6℃, 气候较为干燥和寒冷; 而怒江的降水量为632-1,021 mm, 年平均温度为14.2-22.2℃, 气候整体上表现为湿润和温暖。根据Wang等(2011)的方法进行样品采集, 每个采样点根据溪流的宽度分为5或10个横断面, 从每个断面的浅滩随机收集20块石头, 使用无菌海绵将石头表面的生物膜刮下后收集到采样瓶中, 然后立即将样品在-18℃冷冻。
1.2 理化数据
理化数据根据Wang等(2011)的方法进行收集。使用GPS设备记录每个样点的经度、纬度和海拔。收集河流的宽度、深度、郁蔽度、当前流速和基质粒径等数据, 还测量了水温、pH和电导率。从每个采样点采集原位水样, 然后在-18℃中保存, 在实验室中分析水体化学成分及金属离子含量。在下文中, 这些理化因子作为环境因素。有关每个站点的气候因子的信息是从CHELSA Bioclim (www.chelsa-climate.org)收集的, 在统计分析中, 年平均温度、年温度范围、年降水量和降水季节变化被用作气候解释因素。
1.3 生物群落分析
对于细菌群落, 我们根据Wang等(2017)的方法进行分析。使用苯酚氯仿方法从生物膜中提取基因组DNA (Zhou et al, 1996)。使用V4区的细菌通用引物515F和806R, 一式3份扩增细菌16S rRNA。提取的样品DNA先用琼脂糖凝胶电泳检测, 确定合格之后再通过PCR检测。PCR扩增在25 mL反应液中进行反应, 反应液包含10 × AccuPrime PCR缓冲液(包括dNTP) (Invitrogen, Grand Island, NY)共计2.5 mL、0.4 mM正向和反向引物、10 ng模板DNA以及0.2 mL AccuPrime High-Fidelity Taq聚合酶。每个样品进行3次重复扩增, 并在PCR扩增后混合, 以最大程度地减少扩增过程的潜在误差。热循环条件如下: 在94℃下变性1 min; 随后进行在94℃下20 s, 53℃下25 s和68℃下45s的30个循环; 最后在68℃下延伸10 min, 最终得到符合MiSeq测序要求的目标DNA。将要在同一MiSeq中测序的样品的PCR产物以相同的摩尔浓度合并。合并的混合物用QIAquick凝胶提取试剂盒(QIAGEN Sciences, Germantown, MD, USA)纯化, 然后用PicoGreen (Eugene, OR, USA)定量。根据《MiSeq试剂盒制备指南》(Illumina, San Diego, CA, USA)制备用于测序的样品库。然后进行测序。所有16S rRNA焦磷酸测序数据使用QIIME V1.9.0 (Caporaso et al, 2010)进行分析。测序结果去除引物序列之后, 使用FLASH进行序列拼接(Magoc & Salzberg, 2011)。此外, 使用UCLUST方法进行物种操作单元(OTU)的聚类(Edgar, 2010), 并将物种操作单元之间的相似性等于或大于97%的有效序列归为同一分类单元。使用RDP分类器(Wang et al, 2007)去除注释为叶绿体和古细菌的OTU。为保证测序深度一致, 从OTU表中随机抽取10,000条序列组成一个新的OTU表用于随后的统计分析。
1.4 数据统计分析
首先, 采用Baselga (2010)的beta多样性分解方法分析细菌群落的beta多样性及其周转和嵌套两个组成部分。该方法通过物种组成矩阵计算得到3个不同的矩阵, 分别为: (1)使用Sørensen相异性指数计算总beta多样性; (2)使用Simpson相异性指数计算物种周转; (3)从总beta多样性中减去物种周转, 来估算物种的嵌套过程。在R语言中通过betapart软件包的beta.pair函数, 使用0/1物种数据计算beta多样性指数。
图1

图1
本研究在澜沧江和怒江的89条入江溪流的采样点。(a)研究区位于青藏高原东南部生物多样性热点地区。总共有37条采样溪流流入澜沧江(即澜沧江流域), 52条采样溪流流入怒江(即怒江流域)。NMDS图显示了两个流域中细菌总beta多样性(b)、周转组分(c)和嵌套组分(d)的差异。红色点和黑色点分别代表澜沧江和怒江流域的采样点。* P ≤ 0.05; ** P ≤ 0.01; *** P ≤ 0.001。
Fig. 1
The sample sites of this study along the 89 streams of Lancang River and the Nujiang River. (a) The study area is located in the biodiversity hotspot of south-eastern Tibetan Plateau. In total, 37 streams flow into the Lancang River, while 52 sampled streams flow into the Nujiang River. NMDS plots illustrate the differences in bacterial total beta diversity (b), turnover (c) and nestedness components (d) across the Lancang and Nujiang catchments. The red dots and black dots indicate the sample sites in Langcang and Nujiang catchment, respectively. * P ≤ 0.05; ** P ≤ 0.01; *** P ≤ 0.001.
其次, 使用非度量多维尺度(non-metric multidimensional scaling, NMDS)分析(Minchin, 1987)和置换多元方差(PERMANOVA)分析(Anderson, 2001)来检验细菌beta多样性及其分解组分在两个流域间的差异显著性。然后, 通过欧氏距离来计算海拔距离, 使用线性模型和Mantel检验研究每个流域中细菌群落的beta多样性及其分解组分与海拔变化的关系。使用基于矩阵分析的多元回归(multiple regression on distance matrices, MRM)分析(Legendre et al, 1994), 量化beta多样性的每个组分与环境和气候因素矩阵的相关性。在统计分析之前, 对除pH以外的其他所有环境和气候因素进行对数转化, 使其更符合正态分布。对于多种金属离子, 我们使用主成分分析(principal component analysis, PCA)来降低金属离子的维度, 然后使用第一和第二轴(即PC1和PC2)表示金属离子。使用Pearson相关系数评估解释因子之间的共线性, 并从模型中删除具有高相关系数(Pearson r > 0.7)的因子。考虑了以下两组主要解释因素: 环境和气候组分, 计算获得每个组分的欧式距离矩阵。先进行一次MRM分析, 删除不重要的因子, 然后重新进行MRM分析。通过矩阵置换测试了999次偏回归的显著性。
最后, 通过方差分解分析(variation partitioning analyses, VPA; Anderson & Cribble, 1998)揭示环境、气候和空间因素对细菌beta多样性及其分解组分变异的影响。对于空间因素, 使用邻体矩阵主坐标(principal coordinates of neighbour matrices, PCNM)分析(Borcard & Legendre, 2002)将空间距离矩阵表示为正交特征向量集, 将得到的主坐标都用作空间因子。结合怒江和澜沧江两个流域与细菌的beta多样性及其分解组分, 形成6个不同的组合: 澜沧江-总beta多样性、澜沧江-周转组分、澜沧江-嵌套组分、怒江-总beta多样性、怒江-周转组分和怒江-嵌套组分,分别与对应的解释因素进行方差分解分析, 结果采用R2adj表示。在R语言(R Core Team, 2018)中进行上述所有的统计分析, 使用的软件包有vegan、ggplot 2和ecodist等。
2 结果
图2
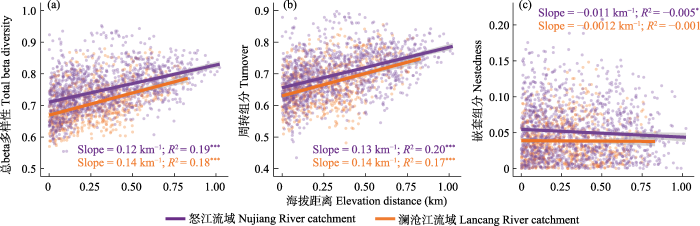
图2
澜沧江和怒江流域细菌总beta多样性(a)、周转组分(b)和嵌套组分(c)与海拔距离的关系。其显著性水平分别为: * P ≤ 0.05, ** P ≤ 0.01, *** P ≤ 0.001。
Fig. 2
Plots showing the relationship between (a) bacterial total beta diversity, (b) turnover and (c) nestedness components and elevational distance in Lancang and Nujiang catchments. * P ≤ 0.05; ** P ≤ 0.01; *** P ≤ 0.001.
在MRM分析中, 气候和环境因素是澜沧江和怒江两个流域中细菌总beta多样性及周转过程的重要预测因素(图3, P < 0.05)。对于两个流域的细菌总beta多样性和周转组分, 所有的显著因子均为正相关, 其中环境因子中相关性最高的为海拔(表1, R2 = 0.408, P < 0.001), 而气候因子中相关性最高的为年平均气温(表1, R2 = 0.417, P < 0.001)。而且对于总beta多样性和周转组分显著的因子比较相似。但对于嵌套组分, 其与气候和环境因子均表现出较低的相关性, 其中澜沧江流域中无显著因子, 怒江流域中虽然有显著因子, 但相关性都比较小, 如温度范围和降水季节变化的相关性分别为-0.150和-0.112。
图3
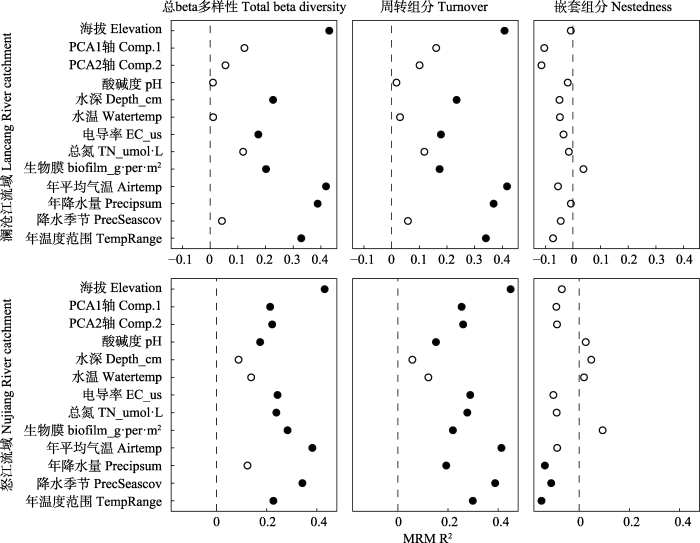
图3
环境和气候因子对澜沧江和怒江两个流域的细菌总beta多样性、周转组分和嵌套组分影响的基于矩阵分析的多元回归(MRM)分析。其中实心和空心的点分别代表显著相关(P < 0.05)和不显著相关性(P > 0.05)。
Fig. 3
The environmental and climate factors related to the variance in bacterial beta diversity and its components in Lancang River and Nujiang River catchments, identified with multiple regression on distance matrices (MRM). Filled shapes and empty shapes indicate significant relationship (P < 0.05) and non-significant relationship (P > 0.05), respectively. Comp.1 and Comp.2 indicate principal component analysis (PCA) was performed to reduce the dimensions of measured metal and metalloid concentrations, and the first two axes were used as proxies for these elements. Depth, Stream depth; EC_ us, Electrical conductivity; TN, Total nitrogen; Airtemp, Mean annual temperature; Precipsum, Annual precipitation; PrecSeascov, Precipitation seasonality conditions; TempRange, Annual temperature range.
表1 环境和气候因子与最终模型的偏回归系数(R2)解释的两个流域中细菌总beta多样性、周转和嵌套组分
Table 1
| 澜沧江流域 Lancang catchment | 怒江流域 Nujiang catchment | |||||
|---|---|---|---|---|---|---|
| 总beta多样性 Total beta diversity | 周转组分 Turnover | 嵌套组分 Nestedness | 总beta多样性 Total beta diversity | 周转组分 Turnover | 嵌套组分 Nestedness | |
| 环境因子 Local factors | ||||||
| 海拔 Elevation | 0.43*** | 0.41*** | 0.43*** | 0.45*** | ||
| PCA1轴 Comp.1 | 0.21* | 0.25* | ||||
| PCA2轴 Comp.2 | 0.22* | 0.26* | ||||
| 酸碱度 pH | 0.17* | 0.15* | ||||
| 水深 Stream depth | 0.23** | 0.23*** | ||||
| 水温 Water temperature | ||||||
| 电导率 Electrical conductivity | 0.17* | 0.18* | 0.24** | 0.29*** | ||
| 总氮 Total nitrogen | 0.24** | 0.28*** | ||||
| 生物膜 Biofilm | 0.20* | 0.17* | 0.28** | 0.22** | ||
| 气候因子 Climate factors | ||||||
| 年平均气温 Mean annual temperature | 0.42*** | 0.42*** | 0.38*** | 0.41*** | ||
| 年降水量 Annual precipitation | 0.39*** | 0.37*** | 0.19* | -0.14* | ||
| 降水季节 Precipitation seasonality conditions | 0.34*** | 0.39*** | -0.11* | |||
| 年温度范围 Annual temperature range | 0.33* | 0.34** | 0.23** | 0.3** | -0.15** | |
* P ≤ 0.05, ** P ≤ 0.01 and *** P ≤ 0.001. Comp.1和Comp.2: 对金属离子进行主成分分析之后, 提取前两个轴代表这些离子。Comp.1 and Comp.2, Principal component analysis (PCA) was performed to reduce the dimensions of measured metal and metalloid concentrations, the first two axes were used as proxies for these elements.
最后, 通过方差分解方法定量分析环境、气候以及空间因素对两个流域中细菌beta多样性变异的解释度。从图4中可以看到, 这3种因子分别共同解释了澜沧江和怒江流域中细菌总beta多样性40%和36%的变化, 对周转组分共解释了45%和38%, 对嵌套过程共解释了33%和33%。这一结果暗示着可能还有其他重要因素影响着横断山脉细菌beta多样性格局。对于澜沧江流域, 细菌的总beta多样性和周转组分主要被环境因子解释, 解释度分别为11%和13%。环境、气候以及空间3种因素的共同解释度也比较大, 分别为10%和12%。嵌套组分主要受到空间因子的影响, 解释度为18%。对于怒江流域, 细菌的总beta多样性和周转组分同样主要受到环境因子的影响以及3种因子的共同影响, 其中, 3种因子共同解释了其变化的16%和19%。嵌套过程同样主要受到空间因子的影响(20%)。
3 讨论
beta多样性可表征不同地理区域之间的物种组成变化, 是研究群落结构以及物种组成与环境因子间关系的重要指标(Qian et al, 2004)。周转和嵌套过程是驱动生物群落beta多样性的两个主要机制, 单独分析组成beta多样性的这两个过程, 有助于我们更好地理解海拔梯度上的群落构建机制。我们基于Baselga (2010)的多样性分解方法, 探索了细菌沿海拔梯度的beta多样性形成的驱动机制。结果表明, 细菌的beta多样性随海拔梯度的变化模式符合经典的海拔距离衰减模式, 其中周转组分占总beta多样性的比例比较大。周转组分主要受到环境过滤和空间扩散的影响, 而嵌套组分主要受到扩散限制的影响。此外, 我们发现, 恶劣环境会增加细菌的beta多样性和周转率, 并且会导致更强的环境筛选去影响细菌群落的物种组成。
3.1 两个流域中细菌群落beta多样性分解组分的海拔分布模式
研究发现, 随着海拔距离的增加, 细菌beta多样性分解组分的差异增大(图2)。我们计算的细菌beta多样性分解组分随海拔的变化模式与典型的海拔距离衰减模式相同。出现这种模式可能是因为特定的细菌群落会出现在适宜生存的海拔高度以及栖息地中, 导致其在整个海拔梯度上分布不均匀。同时, 由于我们的采样地点为入江溪流, 水体相对比较独立, 物种的扩散具有很强的限制性, 距离衰减关系会更强(Barberan & Casamayor, 2010)。目前已经有类似的海拔梯度分布模式在一些物种中被研究(Swenson et al, 2010; Wang et al, 2012; Bishop et al, 2015)。与Bishop等(2015)提出的结果相似, 我们发现周转组分占总beta多样性的成分比较大。在特定的海拔高度下, 细菌群落会通过演替出新的细菌来应对环境选择。细菌对于环境的适应性分布是造成细菌总beta多样性和周转过程沿海拔梯度出现显著海拔距离衰减模式的重要原因。我们发现的物种周转过程为细菌总beta多样性形成的主要驱动力, 凸显了将整个山区作为生物多样性库的重要性, 生物保护要针对整个海拔梯度内的物种。对于嵌套组分, 我们没有观察到显著的海拔距离衰减模式(P > 0.01)。如果观察到嵌套组分占总beta多样性的成分比较大, 那么生物保护只需要针对物种丰富度最高的海拔高度即可(Socolar et al, 2016)。
图4
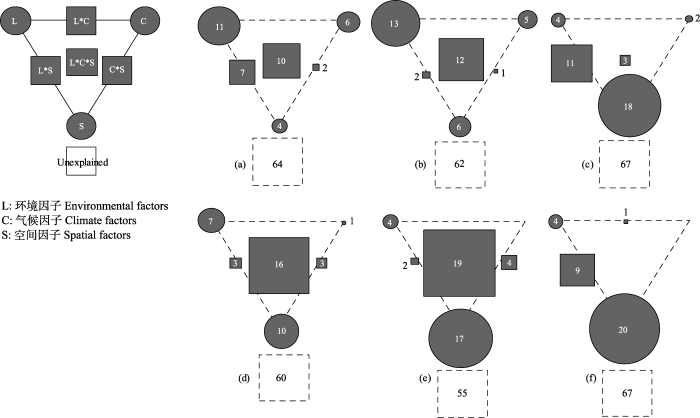
图4
当地环境因子(L)、气候因子(C)和空间因子(S)对两个流域细菌beta多样性、周转组分和嵌套组分的解释比例(小于0的值未显示)。左上方的面板是一般示意图。每类因子的单独解释由三角形的三个角表示。三角形的边和中心分别表示由两个或三个因素共同解释的变异百分比。(a)、(b)、(c)分别为澜沧江流域的细菌总beta多样性、周转组分和嵌套组分; (d)、(e)、(f)分别为怒江流域的细菌总beta多样性、周转组分和嵌套组分。
Fig. 4
The relative importance of environmental (L), climate (C) and spatial (S) factors in explaining the variance in bacterial beta diversity and its components in Nujiang River and Lancang River catchments. The top-left panel is the general outline. The pure variation explained by each factor is represented by the edges of the triangle. The sides and middle of the triangles indicate the percentages of variation explained by interactions of two or all factors, respectively. (a) Total beta diversity, (b) Turnover component and (c) Nestedness component in Lancang catchment. (d) Total beta diversity, (e) Turnover component and (f) Nestedness component in Nujiang catchment.
我们还发现, 细菌在相对恶劣的环境中具有更高的beta多样性以及周转组分。通常认为海拔对于细菌群落beta多样性分布的影响为间接影响, 即通过对气候和环境等因素的作用对群落产生影响。随着海拔的升高, 气温会逐渐下降。与低海拔相比, 高海拔地区的环境相对比较恶劣, 从图2可以发现, 在澜沧江和怒江流域, 细菌总beta多样性随着海拔距离的增加而增加。此外, 相对于气候温暖湿润的怒江流域, 比较干燥寒冷的澜沧江流域中细菌beta多样性更高, 其均值为0.735, 随海拔距离变化的斜率也更大, 为0.14/km (> 0.12/km)。对于周转组分, 也表现出同样的规律, 澜沧江流域细菌周转组分随海拔变化的斜率为0.14/km (> 0.13/km)。在距离衰减模型中, 更高的斜率代表着群落的物种组成是更强烈的环境选择的结果(Hanson et al, 2012)。这表明, 尽管距离衰减是一个普遍现象, 但其强度可能因气候而异。
3.2 两个流域中细菌群落beta多样性分解组分与解释因子的关系
我们使用MRM探究了各种因子对beta多样性及其周转和嵌套组分的影响。结果表明, 海拔与细菌总beta多样性和周转组分具有最高的相关性(表2, R2 = 0.408, P < 0.001)。表明海拔是影响细菌群落物种组成的主要因素。此外, 其他环境因子和气候因子对于细菌beta多样性和其周转过程也有较强的相关性。环境因子中, 总氮、金属离子含量, 水深, pH等对beta多样性有较强的作用, 这一结果表明溪流生态系统受环境因子的调控(Heino et al, 2014)。我们的发现与之前的研究结果相似, 例如在水体化学因子中, pH值对细菌的影响最大, 而栖息地因素的重要性则较小(Lear et al, 2009); 营养盐(例如总氮)会限制细菌的生物量, 因此总氮与细菌多样性多呈显著的相关性(Carr et al, 2005)。气候因子中, 大部分因子都与细菌beta多样性和其周转过程有较强的相关性。但是从图2我们可以看出, 不同的气候条件下, 细菌的beta多样性随海拔梯度的变化模式并没有发生改变。我们认为气候变化会影响到当地细菌的物种组成, 但并不能影响细菌在两个流域中的空间分布格局。这也表明细菌对于气候变化的适应能力比较强, 所以气候发生变化时, 细菌可以很好地适应环境(Wang et al, 2012)。
通过方差分解分析, 我们发现环境、气候和空间因素对细菌beta多样性及其分解组分有较强的影响。其中环境和气候因子主要影响细菌的总beta多样性以及周转组分, 并且在每个流域中, 影响的比例大致相同。对于澜沧江和怒江流域来说, 总beta多样性可以被环境和气候因子单独解释的总和分别为17%以及8%, 周转组分可以被解释18%和4%, 这说明在适当的条件下, 群落的物种组成会被环境因素过滤, 当地环境和气候因子在决定物种多样性和群落组成方面起着重要作用。空间因子对于细菌的总beta多样性以及周转组分也有影响, 例如总beta多样性在两个流域可以被空间因子解释4%和10%, 这表明beta多样性的海拔梯度分布除了受环境过滤的影响, 还受到扩散限制等过程的影响。之前的研究结果也发现, 在全球范围内栖息地异质性导致海洋细菌的beta多样性不同(Alahuhta et al, 2017); 空间和环境因素都极大地影响了底栖细菌的组成和生物多样性(Sun et al, 2011)。对于嵌套组分, 我们发现主要受到空间因子的影响, 空间因子可以单独解释怒江和澜沧江流域嵌套组分的18%和20%, 目前大多数研究都是用空间因子代表扩散能力, 所以我们认为嵌套模式主要受到扩散限制的影响, 并且当物种间空间隔离足够大的时候, 嵌套组分在形成beta多样性的过程中会起主导作用。
我们还发现, 在不同气候条件的两个流域中, 环境与气候因素的影响有所不同(图4), 对于温暖湿润的怒江流域与干燥寒冷的澜沧江流域来说, 环境因子的影响从7%增加到11%; 气候因子的影响从1%增加到5%, 空间因子的影响从10%减少到4%。由此可见, 对于更恶劣的环境, 环境和气候因子对于细菌的beta多样性的影响更大。由此我们推断, 相比于较好的环境, 恶劣环境中细菌群落的物种组成受环境筛选的影响更强。与我们的研究结果相似, Chase (2007)发现相对恶劣的条件可能会成为更强大的环境过滤器, 而在更适宜的条件下, 可能有更多的随机事件发生而影响群落的物种组成。
综上所述, 澜沧江和怒江流域中细菌群落结构显著不同。随着海拔的增加, 细菌的总beta多样性和周转组分也随之增加, 周转组分占总beta多样性的成分比较大。细菌的高周转率可能意味着生物多样性保护必须针对多个地点。细菌的总beta多样性和周转过程主要受到环境过滤的影响, 但嵌套过程主要受到扩散限制的影响。总体而言, 恶劣环境会增加细菌的beta多样性和周转率, 并且会导致更强的环境筛选去影响细菌群落的物种组成。到目前为止, 对溪流中微生物beta多样性分解的研究较少, 我们的研究为气候变化下细菌群落的生物地理分布格局以及群落组成提供了新的见解, 并且具体地揭示了在更广泛的环境梯度中细菌的beta多样性受何种生态过程的驱动, 进一步证明了beta多样性分解的方法在研究生物多样性分布以及形成过程中的重要性。
参考文献
Global variation in the beta diversity of lake macrophytes is driven by environmental heterogeneity rather than latitude
A new method for non‐parametric multivariate analysis of variance
Partitioning the variation among spatial, temporal and environmental components in a multivariate data set
Global phylogenetic community structure and β-diversity patterns in surface bacterioplankton metacommunities
Microbial contributions to climate change through carbon cycle feedbacks
DOI:10.1038/ismej.2008.58
URL
PMID:18615117
[本文引用: 1]

There is considerable interest in understanding the biological mechanisms that regulate carbon exchanges between the land and atmosphere, and how these exchanges respond to climate change. An understanding of soil microbial ecology is central to our ability to assess terrestrial carbon cycle-climate feedbacks, but the complexity of the soil microbial community and the many ways that it can be affected by climate and other global changes hampers our ability to draw firm conclusions on this topic. In this paper, we argue that to understand the potential negative and positive contributions of soil microbes to land-atmosphere carbon exchange and global warming requires explicit consideration of both direct and indirect impacts of climate change on microorganisms. Moreover, we argue that this requires consideration of complex interactions and feedbacks that occur between microbes, plants and their physical environment in the context of climate change, and the influence of other global changes which have the capacity to amplify climate-driven effects on soil microbes. Overall, we emphasize the urgent need for greater understanding of how soil microbial ecology contributes to land-atmosphere carbon exchange in the context of climate change, and identify some challenges for the future. In particular, we highlight the need for a multifactor experimental approach to understand how soil microbes and their activities respond to climate change and consequences for carbon cycle feedbacks.
Partitioning the turnover and nestedness components of beta diversity
Contrasting species and functional beta diversity in montane ant assemblages
All-scale spatial analysis of ecological data by means of principal coordinates of neighbour matrices
Global biodiversity: Indicators of recent declines
DOI:10.1126/science.1187512
URL
PMID:20430971
[本文引用: 1]
In 2002, world leaders committed, through the Convention on Biological Diversity, to achieve a significant reduction in the rate of biodiversity loss by 2010. We compiled 31 indicators to report on progress toward this target. Most indicators of the state of biodiversity (covering species' population trends, extinction risk, habitat extent and condition, and community composition) showed declines, with no significant recent reductions in rate, whereas indicators of pressures on biodiversity (including resource consumption, invasive alien species, nitrogen pollution, overexploitation, and climate change impacts) showed increases. Despite some local successes and increasing responses (including extent and biodiversity coverage of protected areas, sustainable forest management, policy responses to invasive alien species, and biodiversity-related aid), the rate of biodiversity loss does not appear to be slowing.
QIIME allows analysis of high-throughput community sequencing data
Biodiversity loss and its impact on humanity
DOI:10.1038/nature11148
URL
PMID:22678280
[本文引用: 1]
The most unique feature of Earth is the existence of life, and the most extraordinary feature of life is its diversity. Approximately 9 million types of plants, animals, protists and fungi inhabit the Earth. So, too, do 7 billion people. Two decades ago, at the first Earth Summit, the vast majority of the world's nations declared that human actions were dismantling the Earth's ecosystems, eliminating genes, species and biological traits at an alarming rate. This observation led to the question of how such loss of biological diversity will alter the functioning of ecosystems and their ability to provide society with the goods and services needed to prosper.
Bacteria and algae in stream periphyton along a nutrient gradient
Drought mediates the importance of stochastic community assembly
Search and clustering orders of magnitude faster than BLAST
Warming-induced reductions in body size are greater in aquatic than terrestrial species
Evaluating ecosystem effects of climate change on tropical island streams using high spatial and temporal resolution sampling regimes
Contrasting effects of natural and anthropogenic stressors on beta diversity in river organisms
Beyond biogeographic patterns: Processes shaping the microbial landscape
Microbial diversity and community-environment relationnships in boreal streams
The microbial nitrogen-cycling network
DOI:10.1038/nrmicro.2018.9
URL
PMID:29398704
[本文引用: 1]
Nitrogen is an essential component of all living organisms and the main nutrient limiting life on our planet. By far, the largest inventory of freely accessible nitrogen is atmospheric dinitrogen, but most organisms rely on more bioavailable forms of nitrogen, such as ammonium and nitrate, for growth. The availability of these substrates depends on diverse nitrogen-transforming reactions that are carried out by complex networks of metabolically versatile microorganisms. In this Review, we summarize our current understanding of the microbial nitrogen-cycling network, including novel processes, their underlying biochemical pathways, the involved microorganisms, their environmental importance and industrial applications.
Biofilm bacterial community structure in streams affected by acid mine drainage
Modeling brain evolution from behavior: A permutational regression approach
DOI:10.1111/j.1558-5646.1994.tb02191.x
URL
PMID:28568410
[本文引用: 1]
This paper has two complementary purposes: first, to present a method to perform multiple regression on distance matrices, with permutation testing appropriate for path-length matrices representing evolutionary trees, and then, to apply this method to study the joint evolution of brain, behavior and other characteristics in marsupials. To understand the computation method, consider that the dependent matrix is unfolded as a vector y; similarly, consider X to be a table containing the independent matrices, also unfolded as vectors. A multiple regression is computed to express y as a function of X. The parameters of this regression (R(2) and partial regression coefficients) are tested by permutations, as follows. When the dependent matrix variable y represents a simple distance or similarity matrix, permutations are performed in the same manner as the Mantel permutational test. When it is an ultrametric matrix representing a dendrogram, we use the double-permutation method (Lapointe and Legendre 1990, 1991). When it is a path-length matrix representing an additive tree (cladogram), we use the triple-permutation method (Lapointe and Legendre 1992). The independent matrix variables in X are kept fixed with respect to one another during the permutations. Selection of predictors can be accomplished by forward selection, backward elimination, or a stepwise procedure. A phylogenetic tree, derived from marsupial brain morphology data (28 species), is compared to trees depicting the evolution of diet, sociability, locomotion, and habitat in these animals, as well as their taxonomy and geographical relationships. A model is derived in which brain evolution can be predicted from taxonomy, diet, sociability and locomotion (R(2) = 0.75). A new tree, derived from the
FLASH: Fast length adjustment of short reads to improve genome assemblies
DOI:10.1093/bioinformatics/btr507
URL
PMID:21903629
[本文引用: 1]
99% of the time on simulated reads with an error rate of
Microbial biogeography: Putting microorganisms on the map
An evaluation of the relative robustness of techniques for ecological ordination
Functional redundancy of multiple forest taxa along an elevational gradient: Predicting the consequences of non‐random species loss
Biodiversity hotspots for conservation priorities
Beta diversity of angiosperms in temperate floras of eastern Asia and eastern North America
DOI:10.1111/ele.2005.8.issue-1 URL [本文引用: 1]
R: A Language and Environment for Statistical Computing
Beta-diversity partitioning: Methods, applications and perspectives
DOI:10.17520/biods.2017024 URL [本文引用: 2]
Beta多样性分解: 方法, 应用与展望
How should beta-diversity inform biodiversity conservation?
DOI:10.1016/j.tree.2015.11.005
URL
PMID:26701706
[本文引用: 2]
To design robust protected area networks, accurately measure species losses, or understand the processes that maintain species diversity, conservation science must consider the organization of biodiversity in space. Central is beta-diversity--the component of regional diversity that accumulates from compositional differences between local species assemblages. We review how beta-diversity is impacted by human activities, including farming, selective logging, urbanization, species invasions, overhunting, and climate change. Beta-diversity increases, decreases, or remains unchanged by these impacts, depending on the balance of processes that cause species composition to become more different (biotic heterogenization) or more similar (biotic homogenization) between sites. While maintaining high beta-diversity is not always a desirable conservation outcome, understanding beta-diversity is essential for protecting regional diversity and can directly assist conservation planning.
Spatial heterogeneity of bacterial community structure in the sediments of the Pearl River estuary
Deterministic tropical tree community turnover: Evidence from patterns of functional beta diversity along an elevational gradient
The roles of elevation and local environmental factors as drivers of diatom diversity in subarctic streams
DOI:10.1111/fwb.2016.61.issue-9 URL [本文引用: 1]
Ecological processes underlying the community assembly of aquatic microscopic and macroscopic organisms under contrasting climates in the Tibetan Plateau biodiversity hotspot
Beyond global warming: Ecology and global change
DOI:10.2307/1941591 URL [本文引用: 1]
Regional and global elevational patterns of microbial species richness and evenness
Contrasting patterns in elevational diversity between microorganisms and macroorganisms
DOI:10.1111/j.1365-2699.2010.02423.x
URL
Location Laojun Mountain, Yunnan province, China.Methods The sampling scheme included 26 sites spaced at elevational intervals of 89 m from 1820 to 4050 m elevation along a stony stream. Macroinvertebrate and diatom richness were determined based on the morphology of the specimens. Taxonomic richness for bacteria was quantified using a molecular fingerprinting method. Over 50 environmental variables were measured at each site to quantify environmental variables that could correlate with the patterns of diversity. We used eigenvector-based spatial filters with multiple regressions to account for spatial autocorrelation.Results The bacterial richness followed an unexpected monotonic increase with elevation. Diatoms decreased monotonically, and macroinvertebrate richness showed a clear unimodal pattern with elevation. The unimodal richness pattern for macroinvertebrates was best explained by the mid-domain effect (r(2) = 0.72). The diatom richness was best explained by the variation in nutrient supply, and the increase in bacterial richness with elevation may be related to an increased carbon supply.Main conclusions We found contrasting patterns in elevational diversity among the three studied multi-trophic groups comprising unicellular and multicellular aquatic taxa. We also found that there may be fundamental differences in the mechanisms underlying these species diversity patterns.]]>
Patterns of elevational beta diversity in micro- and macroorganisms
DOI:10.1111/j.1466-8238.2011.00718.x
URL
[本文引用: 3]
Aim While ecologists have long been interested in diversity in mountain regions, elevational patterns in beta diversity are still rarely studied across different life forms ranging from micro- to macroorganisms. Also, it is not known whether the patterns in turnover among organism groups are affected by the degree to which the environment is modified by human activities. Location Laojun Mountain, Yunnan Province, China. Methods The beta diversity patterns of benthic microorganisms (i.e. diatoms and bacteria) and macroorganisms (i.e. macroinvertebrates) in a stony stream were simultaneously investigated between elevations of 1820 and 4050 m. Data were analysed by using a distance-based approach and variation partitioning based on canonical redundancy analysis. Results Analyses of community dissimilarities between adjacent sampling sites showed comparable small-scale beta diversity along the elevational gradient for the organism groups. However, bacteria clearly showed the lowest elevational turnover when analyses were conducted simultaneously for all pairwise sites. Variation partitioning indicated that species turnover was mostly related to environmental heterogeneity and spatial gradients including horizontal distance and elevation, while purely human impacts were shown to be less important. Main conclusions The elevational beta diversity at large scales was lower for bacteria than for eukaryotic microorganisms or macroorganisms, perhaps indicative of high dispersal ability and good adaptability of bacteria to harsh environmental conditions. However, the small-scale beta diversity did not differ among the groups. Elevation was the major driver for the turnover of eukaryotic organisms, while the turnover of bacteria was correlated more with environmental variation.
Naïve Bayesian classifier for rapid assignment of rRNA sequences into the new bacterial taxonomy
DOI:10.1128/AEM.00062-07
URL
PMID:17586664
[本文引用: 1]
The Ribosomal Database Project (RDP) Classifier, a naive Bayesian classifier, can rapidly and accurately classify bacterial 16S rRNA sequences into the new higher-order taxonomy proposed in Bergey's Taxonomic Outline of the Prokaryotes (2nd ed., release 5.0, Springer-Verlag, New York, NY, 2004). It provides taxonomic assignments from domain to genus, with confidence estimates for each assignment. The majority of classifications (98%) were of high estimated confidence (> or = 95%) and high accuracy (98%). In addition to being tested with the corpus of 5,014 type strain sequences from Bergey's outline, the RDP Classifier was tested with a corpus of 23,095 rRNA sequences as assigned by the NCBI into their alternative higher-order taxonomy. The results from leave-one-out testing on both corpora show that the overall accuracies at all levels of confidence for near-full-length and 400-base segments were 89% or above down to the genus level, and the majority of the classification errors appear to be due to anomalies in the current taxonomies. For shorter rRNA segments, such as those that might be generated by pyrosequencing, the error rate varied greatly over the length of the 16S rRNA gene, with segments around the V2 and V4 variable regions giving the lowest error rates. The RDP Classifier is suitable both for the analysis of single rRNA sequences and for the analysis of libraries of thousands of sequences. Another related tool, RDP Library Compare, was developed to facilitate microbial-community comparison based on 16S rRNA gene sequence libraries. It combines the RDP Classifier with a statistical test to flag taxa differentially represented between samples. The RDP Classifier and RDP Library Compare are available online at http://rdp.cme.msu.edu/.
The Anthropocene is functionally and stratigraphically distinct from the Holocene
Vegetation of the Siskiyou Mountains, Oregon and California
DOI:10.2307/1943563 URL [本文引用: 1]
Climate shapes and shifts functional biodiversity in forests worldwide
Climate change and freshwater ecosystems: Impacts across multiple levels of organization
DOI:10.1098/rstb.2010.0055 URL [本文引用: 1]
Species richness patterns and mechanisms along the elevational gradients
物种丰富度垂直分布格局及影响机制
