


多度(abundance)是在一定区域内特定物种个体的多少, 是种群和群落的重要参数。物种多度的动态变化及其维持机制是生态学研究的经典问题(孙儒泳, 2001)。物种多度分为绝对数量和相对多度(relative abundance), 但大多数野生动物种群的个体绝对数量难以调查, 通常采用取样调查法估计(孙儒泳, 2001)。相对多度不是估计种群个体的绝对数量, 而是衡量单位空间内动物数量多少的相对指标, 通常采用动物的直接数量(个体数)或间接数量(动物粪便和皮毛收购数量等)与调查强度(捕获时间、样线长度或数量)的比值表示(Kawanishi et al, 1999; 孙儒泳, 2001)。相对多度被广泛地用于种群快速评估、入侵物种管理以及种群动态的预测(Sollmann et al, 2013)等方面。
随着红外相机技术在野生动物监测调查中的广泛应用, 应用红外相机数据估计动物种群数量的需求越来越多, 基于红外相机数据计算物种相对多度的方法也应运而生。目前, 应用红外相机数据估计种群数量的指标为相对多度指数(relative abundance index, RAI)。相对多度指数是单位调查时间(拍摄天数)中某一物种独立有效照片的数量, 即物种拍摄率(Carbone et al, 2001; Rovero & Marshall, 2009)。基于红外相机数据的RAI作为一种简单、便利的表征动物相对多度大小的指标, 广泛用于生物多样性本底清查和物种编目(李晟等, 2014)。但RAI易受物种自身特征、探测率和环境因素的影响(MacKenzie et al, 2002), 其在野生动物数量调查中的应用需要结合其他种群数量估计方法, 验证与绝对数量或与种群密度之间的相互关系(Carbone et al, 2001)。当前, 基于红外相机数据有效估计某一物种的种群数量或相对多度是种群生态学的重要内容(Sollmann et al, 2013)。本文总结了国内外应用红外相机数据计算RAI的有关方法, 介绍了RAI的不同计算方法在我国野生动物种群调查中的应用情况, 分析了不同计算方法的优势与局限性, 为相关研究提供借鉴。
1 相对多度指数的类型及计算方法
相对多度指数的计算不要求进行个体识别, 因此应用广泛(Sollmann et al, 2013)。基于红外相机数据估算种群数量的RAI方法已有多种, 归纳起来可分为以下4种类型(Carbone et al, 2001; Bengsen et al, 2011; Sollmann et al, 2013)。
第一种为RAI_1。指拍摄目标物种1张有效照片所需要的天数, 即天数与有效照片数量的比例来计算(Carbone et al, 2001):
式中, Trapdayi为相机位点i的拍摄天数, Ni为相机位点i拍摄的某一物种的有效照片数。
第二种为RAI_2。用每天拍摄目标物种的独立有效照片数量来衡量, 即 RAI_1的倒数:
通常RAI_2随着动物种群数量的增加而增加,且易于理解, 是最常用的计算方法(O’Brien et al, 2003)。在RAI_2的计算中一般以每100天为单位, 即每100个相机日所获取目标物种的独立有效照片数(Kawanishi et al, 1999; Azlan & Sharma, 2006)。
根据调查的时间差异, 不同研究对RAI_2的计算公式进行了修改, 例如时间更改为1,000 d (李晟等, 2016, 公式(3))和1 d (Li et al, 2010, 公式(4))等; 在夜行性物种的研究中以捕获夜(trap night)代替捕获天数, RAI_2为物种的独立有效照片数与捕获夜(Azlan & Sharma, 2006)的比值, 以1,000 h (1,000 trap hours)为单位(裴家骐等, 1997, 公式(5))。虽然RAI_2有不同的表述方式, 但均以调查时间单元的照片数为单位。
第三种为RAI_3。采用综合指数(general index)方法(Engeman, 2005), 计算每个相机位点每天拍摄的目标物种的独立有效照片数(Bengsen et al, 2011)。该方法的优点是可以获得某一位点的相对多度的变化情况(Bengsen et al, 2011)。计算公式为:
式中, d为相机位点数, sj为拍摄天数, xij为j位点i天拍摄的独立有效照片数。
第四种为RAI_4。由武鹏峰等(2012)和Liu等(2013)基于Kawanishi等(1999)和Azlan和Sharma (2006)的研究提出物种相对丰富度指数(species abundance index), 即目标物种独立有效照片数占所有物种独立有效照片总数的比例:
式中, Ai为目标物种的独立有效照片数, N为所有物种的独立有效照片数。但在一些研究中, RAI_4计算公式变换为物种的独立有效照片数占所有物种独立有效照片总数的百分比(章书声等, 2012; 刁鲲鹏等, 2017; 孙佳欣等, 2018)。
2 RAI在我国野生动物编目调查中的应用
我们通过中国知网和Web of Science数据库分别检索“红外相机”、“自动触发相机”、“物种编目”、“生物多样性”、“infrared camera”、“remote camera”、“species inventory”和“biodiversity”等检索词, 设定搜索时间范围为1994年1月至2018年11月, 汇总我国历年发表的基于红外相机调查的动物编目论文, 其中涉及RAI的论文总数为109篇, 第一篇发表于1997年(图1)。按照RAI类型对论文进行分类统计, 国内基于红外相机数据计算RAI的论文主要使用RAI_2和RAI_4两种类型。其中RAI_2为单位抽样时间内所拍摄的独立有效照片数, 抽样时间分为1,000 h、1,000 d、100 d和1 d。按抽样时间可分为4个亚类型, RAI_2的单位分别对应为“1,000/Th”、 “1,000/Td”、“100/Td”和“100%/Td”。RAI_4为调查区域内每个物种独立有效照片数量占所有物种独立有效照片数量的比例, 可分为2个亚类型。第一亚类型为每100或1,000份独立有效照片中的物种的照片数(100/Np或1,000/Np); 第二亚类型为物种的独立有效照片数占所有物种独立有效照片总数的比例(百分比, 100%/Np) (图1)。
图1
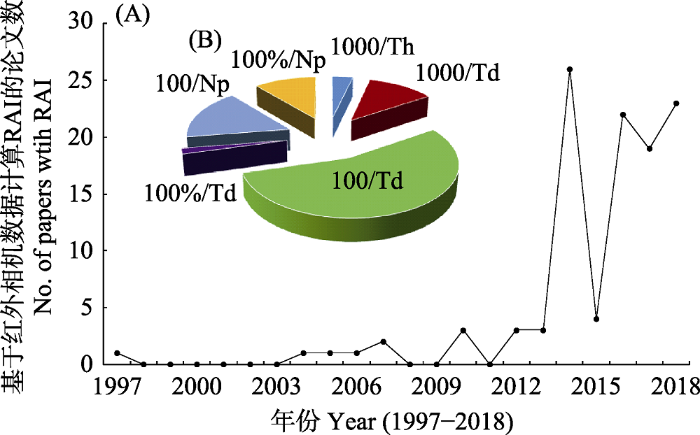
图1
我国基于红外相机数据计算相对多度指数(RAI)的编目论文统计分析(1997-2018)。(A)不同年份发表关于RAI的编目论文总数(N = 109); (B)不同RAI类型的文章比例, 以单位抽样时间内所拍摄的独立有效照片数来获得RAI_2 (N = 79), 包括以1,000 h为单位的论文(1000/Th, N = 4)、以1,000 d为单位的论文(1000/Td, N = 13)、以100 d为单位的论文(100/Td, N = 60)和以1 d为单位的论文(100%/Td, N = 2)等4种亚类型; 另一种则主要分析调查区域内每个物种占所有独立有效照片数的比例(N = 30), 包括每100或1,000张独立有效照片中的物种照片数(100/Np, N = 18)和物种的独立有效照片数占所有物种独立有效照片总数的比例(100%/Np, N = 12)。
Fig. 1
Summary about the papers of species inventory with the relative abundance index based on camera trapping data across China (from 1997 to 2018). (A) The camera-trapping papers in each year (N = 109); (B) These inventory papers with two key categories and six subtypes: one is to get the RAI based on the independent photo each unit of trapping effort (N = 79) with the unit of 1,000 h (1,000/Th, N = 4), 1,000 d (1,000/Td, N = 13), 100 d (100/Td, N = 60) and 1 d (100%/Td, N = 2); the other is to get the relative composition (N = 30), including species composition from 100 or 1,000 independent photo from a given site (100/Np, N = 18), and the proportion of each species among all independent photo from a given site (100%/Np, N = 12).
统计以上2个类型和6个亚类型的RAI计算方法占所有发表论文总数的比例, RAI_2类型的论文数量为79篇, 占所有论文的72.5%, 其中以“1,000/Th”为单位的论文4篇, 以“1,000/Td”为单位的论文13篇、以“100/Td”为单位的论文60篇, 以“100%/Td”为单位的论文2篇。RAI_4类型论文数为30篇, 其中以每100份独立有效照片中的物种照片数(100/Np)计算RAI_4的论文18篇, 物种的独立有效照片数占所有物种独立有效照片总数的比例(100%/Np)计算RAI_4的为12篇。
RAI_2和RAI_4虽然都能反映物种出现的频率, 但二者的计算方式不同。RAI_2是基于调查强度估算, RAI_4是基于群落所有物种照片数估算, 而未考虑调查强度(武鹏峰等, 2012; Liu et al, 2013)。计算RAI_2时假定某区域内动物的照片拍摄率与动物的密度呈正相关, 强调的是相同调查强度下某物种的相对多度(Carbone et al, 2001)。RAI_2可用于单物种种群数量调查, 以及不同地点、不同季节(或年际间)等时空尺度的物种多度比较(Carbone et al, 2001; O’Brien et al, 2003), 也可以用于比较群落中相同调查强度下不同物种的多度(李晟等, 2014)。
RAI_4以特定物种的照片数在所有照片数中的比例来衡量物种相对多度, 采用该指标的论文数量相对较少(图1), 该方法一般适用于比较群落中的物种组成。使用RAI_4对单一物种相对多度进行估计时, 依赖群落中其他物种, 其他物种(尤其是稀有种等探测率低的物种)的探测率对目标物种的相对多度有较大的影响(Ulrich & Ollik, 2005)。此外, RAI_4不适用于不同研究间进行比较, 因为RAI_4的计算依赖其他物种的数量, 而不同研究的群落组成和物种数量存在差异, RAI_4不能真实反映物种的动态(Ulrich & Ollik, 2005)。例如目标物种的种群动态变化幅度与群落组成变化幅度相似, 则RAI_4的数值可能保持不变, 难以反映目标物种的动态; 如果目标物种的动态与群落组成变化相反, RAI_4则会高估目标物种的动态变化, 难以区分目标物种的实际动态和其他因素的作用(Ulrich & Ollik, 2005)。
值得注意的是, 国内研究人员使用“relative abundance index”时, 中文名称对应相对多度指数(李晟等, 2014; 肖治术等, 2014)和相对丰富度指数(武鹏峰等, 2012; Liu et al, 2013) 2种, 分别对应RAI_2和RAI_4, 容易混淆。例如, 有的研究将RAI_4误引用为RAI_2 (于桂清等, 2018)。相对多度指数是种群尺度的指标, 而相对丰富度指数是群落尺度的指标, 衡量的是群落中的物种组成比例。我们建议以红外相机数据估计目标物种的RAI时使用基于调查强度的RAI_2, 在进行群落物种组成分析时, 使用RAI_4。
3 RAI的效用性与局限性
RAI在红外相机中应用的前提假设是红外相机对物种的拍摄率与物种密度具一定的相关性, 并且物种探测率在研究维度上(时间、空间、物种)保持不变(Sollmann et al, 2013)。以红外相机数据计算的RAI与种群密度具相关性在理论研究和野外调查中得到了一定程度的验证(O’Brien et al, 2003; Sollmann et al, 2013)。例如, 对于可识别个体的物种, Carbone等(2001)通过随机相遇模型模拟9个地区的虎(Panthera tigris)的拍摄率, 证明RAI (拍摄率)与种群密度具有显著的正相关关系; 对于不可识别个体的物种, Rovero和Marshall (2009)通过对比哈氏小羚羊(Cephalophus harveyi)的研究也证实以红外相机数据估计的RAI与样线调查的动物密度正相关。但也有研究表明RAI与物种的密度并不相关, 如基于红外相机数据估计巽他云豹(Neofelis diardi)和豹猫(Prionailurus bengalensis)的RAI与应用空间标记重捕模型估计的种群密度进行比较, 发现二者并不相关。不同地区RAI的变化不能反映种群数量的差异(Sollmann et al, 2013)。由于RAI是否可以准确表征种群密度还具有一定争议, 因此,在使用前最好对比研究物种的RAI和其他调查方法的关系, 以验证RAI对种群数量的反映程度(Carbone et al, 2002; Jennelle et al, 2002)。
RAI对种群数量的反映程度易受物种自身特征、探测率和环境因素的影响。Carbone等(2001)证实相机拍摄率和虎密度之间存在线性关系。然而, 种群密度的估算中, 由于拍摄率和密度都是基于红外相机数据计算的, 二者并不是独立的。拍摄率和它们之间的相关关系是否能应用到其他物种仍有待商榷(Jennelle et al, 2002)。密度和拍摄率的相关性还取决于研究地点和研究物种等因素, RAI在其他物种中的应用可能需要重新验证拍摄率和密度之间的关系(Carbone et al, 2002; Jennelle et al, 2002)。不完全探测和探测率变化也会影响对物种RAI的估计, Sollmann等(2013)模型模拟的结果表明: (1)物种探测率高的物种的RAI与实际值偏差较大; (2)物种家域大的物种拍摄率更高, RAI偏高; (3)有意躲避红外相机的物种探测率较低, RAI也偏低; (4)探测率随时间变化也是RAI偏离真实的物种多度的一个因素。使用未经探测率校准的RAI进行物种内或者物种间比较, 容易做出错误的推断(Pollock et al, 2002)。此外, 红外相机数据调查中探测率受到环境因素的影响, 进行不同研究区域的RAI比较时, 不易区分RAI的变化是由物种多度的实际变化引起, 还是物种探测率的变化引起, 或者二者共同作用的结果(Jennelle et al, 2002)。
虽然RAI的应用存在一定的局限性, 但物种本底调查和编目评估的相关研究仍广泛使用该指数(图1), 最重要的原因是其易用性。其他原因还包括标记重捕等种群估计的方法不能用于难以进行个体识别的物种的研究, 或者研究人员对于其他复杂的种群数量估计方法缺乏了解等(Engeman et al, 2013; Sollmann et al, 2013)。
4 展望
RAI的有关计算方法仍有待进一步评估和完善, 应用红外相机数据分析相对多度时应结合密度估计方法, 验证RAI与种群密度的相关性, 从而有效地估计种群数量(Carbone et al, 2001)。基于红外相机对物种多度的估计方法, 除了RAI外, 其他方法也在不断更新发展, 如对可识别个体的物种利用空间标记重捕模型估算种群数量与密度(Chandler & Royle, 2013; 肖文宏等, 2019a), 适用于不可识别个体的物种的基于有无数据的Royle-Nichols模型(Royle & Nichols, 2003), 基于家域大小和运动模式的随机相遇模型(Rowcliffe et al, 2008)和基于独立有效照片数量的N-mixture模型(Royle, 2004), 以及time- and space-to-event模型(Moeller et al, 2018)等方法, 分别适用于不同数据类型的物种数量的有效评估。还可采用物种对生境的利用程度来表征物种数量的相对多少, 通过占域模型(单季节或多季节的占域模型)来评估物种对生境的利用程度以及动态变化, 从而预测物种或群落的动态(MacKenzie et al, 2002; 肖文宏等, 2019b)。RAI仍有一定的局限性, 并不适用于所有物种。为了提高种群数量评估的准确性, 模型和相关计算方法仍需不断更新和完善, 为保护和管理决策的制定提供科学的依据。
参考文献
The diversity and activity patterns of wild felids in a secondary forest in Peninsular Malaysia
DOI:10.1017/S0030605306000147 URL [本文引用: 3]
Using a general index approach to analyze camera-trap abundance indices
DOI:10.1002/jwmg.132
URL
[本文引用: 3]

The lack of variance estimates constrain the utility of abundance indices calculated from camera-trap data. We adapted a General Index model, which allows variance estimation, to analyze cameratrap observations of feral pigs (Sus scrofa) for population monitoring in a tropical rainforest. We tested whether the index would respond to population manipulation, and found that it decreased by 57% following removal of 24 pigs and remained low in the following period. Our method is useful for monitoring other large animals in difficult landscapes, and the model can be used to enhance the value of existing data sets.
The use of photographic rates to estimate densities of tigers and other cryptic mammals
DOI:10.1017/S1367943001001081
URL
[本文引用: 9]
The monitoring and management of species depends on reliable population estimates, and this can be both difficult and very costly for cryptic large vertebrates that live in forested habitats. Recently developed camera trapping techniques have already been shown to be an effective means of making mark-recapture estimates of individually identifiable animals (e.g. tigers). Camera traps also provide a new method for surveying animal abundance. Through computer simulations, and an analysis of the rates of camera trap capture from 19 studies of tigers across the species' range, we show that the number of camera days/tiger photograph correlates with independent estimates of tiger density. This statistic does not rely on individual identity and is particularly useful for estimating the population density of species that are not individually identifiable. Finally, we used the comparison between observed trapping rates and the computer simulations to estimate the minimum effort required to determine that tigers,or other species, do not exist in an area, a measure that is critical for conservation planning.
The use of photographic rates to estimate densities of cryptic mammals: Response to Jennelle et al
DOI:10.1017/S1367943002002172 URL [本文引用: 2]
Spatially explicit models for inference about density in unmarked or partially marked populations
DOI:10.1214/12-AOAS610 URL [本文引用: 1]
Role of vertebrates in wild animal corpses degradation process by camera trap in Tangjiahe National Nature Reserve
DOI:10.11984/j.issn.1000-7083.20170199
URL
[本文引用: 1]
通过在唐家河国家级自然保护区内自然死亡的8具动物尸体周围布设红外相机,详细记录了动物尸体在保护良好的自然条件下的分解过程。研究发现,除微生物与无脊椎动物外,脊椎动物在尸体分解过程中也起到很重要的作用:(1)动物尸体会吸引多种脊椎动物前来取食,不同脊椎动物对尸体的利用方式和利用程度不一样。其中利用强度最高的动物为野猪Sus scrofa、亚洲黑熊Ursus thibetanus和大嘴乌鸦Corvus macrorhynchhos,实际贡献率分别为:87.15%、9.08%、3.72%,占所有脊椎动物对尸体取食强度的99.9%,其他动物贡献0.1%,如果子狸Paguma larvata、啮齿动物。(2)野猪有同类相食和拖动尸体的行为;绿背山雀Parus monticolus有采集尸体毛发筑巢的行为;未发现灵长类动物在尸体旁长时间逗留。根据研究结果,建议保护区在不污染水源的情况下,让自然死亡的尸体自然分解而不作深埋处理。
基于红外相机研究脊椎动物在唐家河国家级自然保护区动物尸体分解过程中的作用
DOI:10.11984/j.issn.1000-7083.20170199
URL
[本文引用: 1]
通过在唐家河国家级自然保护区内自然死亡的8具动物尸体周围布设红外相机,详细记录了动物尸体在保护良好的自然条件下的分解过程。研究发现,除微生物与无脊椎动物外,脊椎动物在尸体分解过程中也起到很重要的作用:(1)动物尸体会吸引多种脊椎动物前来取食,不同脊椎动物对尸体的利用方式和利用程度不一样。其中利用强度最高的动物为野猪Sus scrofa、亚洲黑熊Ursus thibetanus和大嘴乌鸦Corvus macrorhynchhos,实际贡献率分别为:87.15%、9.08%、3.72%,占所有脊椎动物对尸体取食强度的99.9%,其他动物贡献0.1%,如果子狸Paguma larvata、啮齿动物。(2)野猪有同类相食和拖动尸体的行为;绿背山雀Parus monticolus有采集尸体毛发筑巢的行为;未发现灵长类动物在尸体旁长时间逗留。根据研究结果,建议保护区在不污染水源的情况下,让自然死亡的尸体自然分解而不作深埋处理。
Indexing principles and a widely applicable paradigm for indexing animal populations
DOI:10.1071/WR03120 URL [本文引用: 1]
Monitoring wild pig populations: A review of methods
DOI:10.1007/s11356-013-2002-5
URL
PMID:23881593
[本文引用: 1]
Wild pigs (Sus scrofa) are widespread across many landscapes throughout the world and are considered to be an invasive pest to agriculture and the environment, or conversely a native or desired game species and resource for hunting. Wild pig population monitoring is often required for a variety of management or research objectives, and many methods and analyses for monitoring abundance are available. Here, we describe monitoring methods that have proven or potential applications to wild pig management. We describe the advantages and disadvantages of methods so that potential users can efficiently consider and identify the option(s) best suited to their combination of objectives, circumstances, and resources. This paper offers guidance to wildlife managers, researchers, and stakeholders considering population monitoring of wild pigs and will help ensure that they can fulfill their monitoring objectives while optimizing their use of resources.
The use of photographic rates to estimate densities of tigers and other cryptic mammals: A comment on misleading conclusions
DOI:10.1017/s1367943002002160
URL
[本文引用: 4]
http://doi.wiley.com/10.1017/S1367943002002160
Preliminaty analysis on abundance of large mammals at Sungai Relau, Taman Negara
The use of infrared-triggered cameras for surveying phasianids in Sichuan Province, China
DOI:10.1111/j.1474-919X.2009.00989.x
URL
[本文引用: 1]
We report on the use of infrared-triggered cameras as an effective tool to survey phasianid populations in Wanglang and Wolong Nature Reserves, China. Surveys at 183 camera-trapping sites recorded 30 bird species, including nine phasianids (one grouse and eight pheasant species). Blood Pheasant Ithaginis cruentus and Temminck's Tragopan Tragopan temminckii were the phasianids most often detected at both reserves and were found within the mid-elevation range (2400 3600 m asl). The occupancy rate and detection probability of both species were examined using an occupancy model relative to eight sampling covariates and three detection covariates. The model estimates of occupancy for Blood Pheasant (0.30) and Temminck's Tragopan (0.14) are close to the na茂ve estimates based on camera detections (0.27 and 0.13, respectively). The estimated detection probability during a 5-day period was 0.36 for Blood Pheasant and 0.30 for Temminck's Tragopan. The daily activity patterns for these two species were assessed from the time/date stamps on the photographs and sex ratios calculated for Blood Pheasant (152M : 72F) and Temminck's Tragopan (48M : 21F). Infrared cameras are valuable for surveying these reclusive species and our protocol is applicable to research or monitoring of phasianids.
Camera-trapping in wildlife research and conservation in China: Review and outlook
DOI:10.3724/SP.J.1003.2014.14203
URL
[本文引用: 3]
20年来,红外相机技术在国内外野生动物研究、监测与保护中得到了广泛应用。基于红外相机技术,我国在野生动物生态学研究、动物行为学研究、稀有物种的探测与记录、动物本底资源调查、生物多样性监测及保护地管理与保护评价等领域取得了众多成果。目前,数学模型、统计分析方法和新的概念正在促进红外相机技术在野生动物监测研究与保护管理中的发展和推广应用。同时,随着红外相机技术的成熟、成本降低和应用普及,这一技术也将会被更多的野生动物研究人员、管理人员和自然保护区管理者所采用,并成为全国各级保护地和区域生物多样性监测研究的关键技术和方法。今后,建立并完善系统化的监测网络和数据共享平台、开发新一代的数据分析方法与模型,将是此项技术进一步发展和应用的主要方向。
红外相机技术在我国野生动物研究与保护中的应用与前景
DOI:10.3724/SP.J.1003.2014.14203
URL
[本文引用: 3]
20年来,红外相机技术在国内外野生动物研究、监测与保护中得到了广泛应用。基于红外相机技术,我国在野生动物生态学研究、动物行为学研究、稀有物种的探测与记录、动物本底资源调查、生物多样性监测及保护地管理与保护评价等领域取得了众多成果。目前,数学模型、统计分析方法和新的概念正在促进红外相机技术在野生动物监测研究与保护管理中的发展和推广应用。同时,随着红外相机技术的成熟、成本降低和应用普及,这一技术也将会被更多的野生动物研究人员、管理人员和自然保护区管理者所采用,并成为全国各级保护地和区域生物多样性监测研究的关键技术和方法。今后,建立并完善系统化的监测网络和数据共享平台、开发新一代的数据分析方法与模型,将是此项技术进一步发展和应用的主要方向。
Camera-trapping survey on the mammal diversity in the Laohegou Nature Reserve, Sichuan Province
DOI:10.16829/j.slxb.201603004
URL
[本文引用: 1]
自然保护区的生物物种编目是区域性和全国性生物多样性研究与监测的基础,而红外相机调查技术已成为兽类物种编目的重要手段之一.老河沟自然保护区位于四川省岷山北部,地处大熊猫岷山种群分布核心地区,是2012年新建保护区.从2011年至2014年,我们把保护区划分为1 km×1 km的方格,采用红外相机技术,对区内的兽类多样性进行了系统全面的调查.经过9 188个相机日的调查,共记录到分属7目18科的兽类.其中,有81 709份记录可以鉴定出具体物种,包括野生兽类24种,家畜1种(家狗),分属5目14科,有效探测数总计1 766次.其余未能鉴定出具体物种的兽类记录为小型翼手目、食虫目和啮齿目动物.在24种野生兽类中,食肉目物种数最多,共4科9种;其次为偶蹄目(4科7种)与啮齿目(3科6种).就有效探测数而言,偶蹄目兽类是记录到次数最多的类群(占总探测数43.97%),其次是啮齿目(25.61%)和食肉目(22.44%).被IUCN红色名录评估为“濒危EN”、“易危VU”和“近危NT”级别的物种各3种,被列为国家Ⅰ级和Ⅱ级重点保护野生动物的分别为4种和5种.本次调查对老河沟自然保护区内的大中型兽类进行了首次系统性编目,了解了区内兽类群落的物种组成、空间分布与相对多度,为后续的科研项目和保护管理提供了本底数据和基础信息.
四川省老河沟自然保护区兽类多样性红外相机调查
DOI:10.16829/j.slxb.201603004
URL
[本文引用: 1]
自然保护区的生物物种编目是区域性和全国性生物多样性研究与监测的基础,而红外相机调查技术已成为兽类物种编目的重要手段之一.老河沟自然保护区位于四川省岷山北部,地处大熊猫岷山种群分布核心地区,是2012年新建保护区.从2011年至2014年,我们把保护区划分为1 km×1 km的方格,采用红外相机技术,对区内的兽类多样性进行了系统全面的调查.经过9 188个相机日的调查,共记录到分属7目18科的兽类.其中,有81 709份记录可以鉴定出具体物种,包括野生兽类24种,家畜1种(家狗),分属5目14科,有效探测数总计1 766次.其余未能鉴定出具体物种的兽类记录为小型翼手目、食虫目和啮齿目动物.在24种野生兽类中,食肉目物种数最多,共4科9种;其次为偶蹄目(4科7种)与啮齿目(3科6种).就有效探测数而言,偶蹄目兽类是记录到次数最多的类群(占总探测数43.97%),其次是啮齿目(25.61%)和食肉目(22.44%).被IUCN红色名录评估为“濒危EN”、“易危VU”和“近危NT”级别的物种各3种,被列为国家Ⅰ级和Ⅱ级重点保护野生动物的分别为4种和5种.本次调查对老河沟自然保护区内的大中型兽类进行了首次系统性编目,了解了区内兽类群落的物种组成、空间分布与相对多度,为后续的科研项目和保护管理提供了本底数据和基础信息.
Monitoring wildlife abundance and diversity with infra-red camera traps in Guanyinshan Nature Reserve of Shaanxi Province, China
DOI:10.1016/j.ecolind.2012.09.022
URL
[本文引用: 3]
Ecological indicators or indices have been widely used to simplify and measure complex ecosystems. It is critical to identify suitable indicators or indices to improve monitoring and understanding of complex natural systems. Camera trapping is an objective technique that can provide a large amount of information on wildlife. The purpose of our study is to explore the effective ecological indices for wildlife diversity analysis and monitoring in Guanyinshan Nature Reserve of Shaanxi Province, China. Since July 2009, a total of 18 cameras were installed in the reserve from August 2009 to July 2011, collecting 2115 photo captures during these 24 months. We developed five abundance indices, including relative abundance index (RAI), monthly relative abundance index (MRAI), time-period relative abundance index (TRAI), night-time relative abundance index (NRAI) and species abundance index (N) to integrate the information derived from captures. Results are: (1) 27 species were detected and 6 species had high RAI values of over 79.3%, including takin (Budorcas taxicolor), common goral (Naemorhedus goral), tufted deer (Elaphodus cephalophus), golden pheasant (Chtysolophus pictus), wild boar (Sus scrofa), and mainland serow (Capricornis sumatraensis). (2) MRAI shows a consistent monthly activity pattern of all animals being active in June and July and inactive in February. (3) TRAIs of the most abundant six species show that takin, tufted deer and common goral have the similar daily activity pattern with one peak at dawn and one peak at dusk. The daily activity patterns of golden pheasant and wild boar show that they are most active during the day time, with wild boar being particularly active at noon. NRAIs of mainland serow show the highest nocturnality and of golden pheasant the lowest nocturnality. (4) We estimated abundance of takin, tufted deer and wild boar by using our developed index. The abundance for the three species shows an increasing trend during the 2-year study period, particularly for wild boar. Our results provided an interesting comparison of species diversity and their activity patterns. As trapping continues we will have a consistent source of monitoring data to evaluate changes in species abundance and activities. Therefore, the conclusion is that the methods we used and the indices we developed are capable to estimate species activity patterns and abundance dynamics which are useful for future wildlife management in Guanyinshan Nature Reserve and elsewhere. (C) 2012 Elsevier Ltd. All rights reserved.
Estimating site occupancy rates when detection probabilities are less than one
DOI:10.2307/3072056
URL
[本文引用: 2]
Nondetection of a species at a site does not imply that the species is absent unless the probability of detection is 1. We propose a model and likelihood-based method for estimating site occupancy rates when detection probabilities are < 1. The model provides a flexible framework enabling covariate information to be included and allowing for missing observations. Via computer simulation, we found that the model provides good estimates of the occupancy rates, generally unbiased for moderate detection probabilities (>0.3). We estimated site occupancy rates for two anuran species at 32 wetland sites in Maryland, USA, from data collected during 2000 as part of an amphibian monitoring program, Frog-watch USA. Site occupancy rates were estimated as 0.49 for American toads (Bufo americanus), a 44% increase over the proportion of sites at which they were actually observed, and as 0.85 for spring peepers (Pseudacris crucifer), slightly above the observed proportion of 0.83.
Three novel methods to estimate abundance of unmarked animals using remote cameras
DOI:10.1002/ecs2.2331 URL [本文引用: 1]
Crouching tigers, hidden prey: Sumatran tiger and prey populations in a tropical forest landscape
DOI:10.1017/S1367943003003172
URL
[本文引用: 3]
We examine the abundance and distribution of Sumatran tigers ( Panthera tigris sumatrae ) and nine prey species in Bukit Barisan Selatan National Park on Sumatra, Indonesia. Our study is the first to demonstrate that the relative abundance of tigers and their prey, as measured by camera traps, is directly related to independently derived estimates of densities for these species. The tiger population in the park is estimated at 40 43 individuals. Results indicate that illegal hunting of prey and tigers, measured as a function of human density within 10 km of the park, is primarily responsible for observed patterns of abundance, and that habitat loss is an increasingly serious problem. Abundance of tigers, two mouse deer ( Tragulus spp.), pigs ( Sus scrofa ) and Sambar deer ( Cervus unicolor ) was more than four times higher in areas with low human population density, while densities of red muntjac ( Muntiacus muntjac ) and pigtail macaques ( Macaca nemestrina ) were twice as high. Malay tapir ( Tapirus indicus ) and argus pheasant ( Argusianus argus ), species infrequently hunted, had higher indices of relative abundance in areas with high human density. Edge effects associated with park boundaries were not a significant factor in abundance of tigers or prey once human density was considered. Tigers in Bukit Barisan Selatan National Park, and probably other protected areas throughout Sumatra, are in imminent danger of extinction unless trends in hunting and deforestation are reversed.
Use of auto-trigger camera and geographic information system to study spatial distribution of forest wildlife
利用自动照相机设备与地理资讯系统研究森林野生动物族群之空间分布利用
Large scale wildlife monitoring studies: Statistical methods for design and analysis
DOI:10.1002/env.514
URL
[本文引用: 1]
Techniques for estimation of absolute abundance of wildlife populations have received a lot of attention in recent years. The statistical research has been focused on intensive small-scale studies. Recently, however, wildlife biologists have desired to study populations of animals at very large scales for monitoring purposes. Population indices are widely used in these extensive monitoring programs because they are inexpensive compared to estimates of absolute abundance. A crucial underlying assumption is that the population index ( C ) is directly proportional to the population density ( D ). The proportionality constant, , is simply the probability of detection for animals in the survey. As spatial and temporal comparisons of indices are crucial, it is necessary to also assume that the probability of detection is constant over space and time. Biologists intuitively recognize this when they design rigid protocols for the studies where the indices are collected. Unfortunately, however, in many field studies the assumption is clearly invalid. We believe that the estimation of detection probability should be built into the monitoring design through a double sampling approach. A large sample of points provides an abundance index, and a smaller sub-sample of the same points is used to estimate detection probability. There is an important need for statistical research on the design and analysis of these complex studies. Some basic concepts based on actual avian, amphibian, and fish monitoring studies are presented in this article. Copyright 2002 John Wiley & Sons, Ltd.
Camera trapping photographic rate as an index of density in forest ungulates
DOI:10.1111/j.1365-2664.2009.01705.x
URL
[本文引用: 2]
1. Calibrating indices of animal abundance to true densities is critical in wildlife studies especially when direct density estimations are precluded by high costs, lack of required data or model parameters, elusiveness and rarity of target species. For studies deploying camera traps, the use of photographic rate (photographs per sampling time) as an index of abundance potentially applies to the majority of terrestrial mammals where individual recognition, and hence capture-recapture analysis, are unfeasible. The very few studies addressing this method have either been limited by lack of independence between trapping rates and density estimations, or because they combined different species, thus introducing potential bias in camera trap detection rates. This study uses a single model species from several sites to analyse calibration of trapping rates to independently derived estimations of density. The study also makes the first field test of the method by Rowcliffe et al. (2008) for density derivation from camera trapping rates based on modelling animal-camera contacts.2. We deployed camera traps along line transects at six sites in the Udzungwa Mountains of Tanzania and correlated trapping rates of Harvey's duiker Cephalophus harveyi with densities estimated from counts made along the same transects.3. We found a strong, linear relationship (R-2 = 0.90) between trapping rate and density. Sampling precision analysis indicates that camera trapping rates reach satisfactory precision when trapping effort amounts to 250-300 camera days. Density estimates using Rowcliffe et al.'s (2008) gas model conversion are higher than from transect censuses; we discuss the possible reasons and stress the need for more field tests.4. Synthesis and applications. Subject to rigorous and periodic calibration, and standardization of sampling procedures in time and over different sites, camera trapping rate is shown to be, in this study, a valid index of density in the target species. Comparative data indicate that this may also apply to forest ungulates in general. The method has great potential for standardizing monitoring programmes and reducing the costs of wildlife surveys, especially in remote areas.
Estimating animal density using camera traps without the need for individual recognition
DOI:10.1111/j.1365-2664.2008.01473.x
URL
[本文引用: 1]
1. Density estimation is of fundamental importance in wildlife management. The use of camera traps to estimate animal density has so far been restricted to capture鈥搑ecapture analysis of species with individually identifiable markings. This study developed a method that eliminates the requirement for individual recognition of animals by modelling the underlying process of contact between animals and cameras. 2. The model provides a factor that linearly scales trapping rate with density, depending on two key biological variables (average animal group size and day range) and two characteristics of the camera sensor (distance and angle within which it detects animals). 3. We tested the approach in an enclosed animal park with known abundances of four species, obtaining accurate estimates in three out of four cases. Inaccuracy in the fourth species was because of biased placement of cameras with respect to the distribution of this species. 4. Synthesis and applications. Subject to unbiased camera placement and accurate measurement of model parameters, this method opens the possibility of reduced labour costs for estimating wildlife density and may make estimation possible where it has not been previously. We provide guidelines on the trapping effort required to obtain reasonably precise estimates.
N-mixture models for estimating population size from spatially replicated counts
DOI:10.1111/j.0006-341X.2004.00142.x
URL
PMID:15032780
[本文引用: 1]
<p>Summary. Spatial replication is a common theme in count surveys of animals. Such surveys often generate sparse count data from which it is difficult to estimate population size while formally accounting for detection probability. In this article, I describe a class of models ( N -mixture models) which allow for estimation of population size from such data. The key idea is to view site-specific population sizes, N , as independent random variables distributed according to some mixing distribution (e.g., Poisson). Prior parameters are estimated from the marginal likelihood of the data, having integrated over the prior distribution for N .
Estimating abundance from repeated presence-absence data or point counts
DOI:10.1890/0012-9658(2003)084[0777:EAFRPA]2.0.CO;2
URL
[本文引用: 1]
We describe an approach for estimating occupancy rate or the proportion of area occupied when heterogeneity in detection probability exists as a result of variation in abundance of the organism under study. The key feature of such problems, which we exploit, is that variation in abundance induces variation in detection probability. Thus, heterogeneity in abundance can be modeled as heterogeneity in detection probability. Moreover, this linkage between heterogeneity in abundance and heterogeneity in detection probability allows one to exploit a heterogeneous detection probability model to estimate the underlying distribution of abundances. Therefore, our method allows estimation of abundance from repeated observations of the presence or absence of animals without having to uniquely mark individuals in the population.
Risky business or simple solution-relative abundance indices from camera-trapping
DOI:10.1016/j.biocon.2012.12.025
URL
[本文引用: 9]
Camera-traps are a widely applied to monitor wildlife populations. For individually marked species, capture-recapture models provide robust population estimates, but for unmarked species, inference is often based on relative abundance indices (RAI, number of records per trap effort), although these do not account for imperfect and variable detection. We use a simulation study and empirical camera-trapping data to illustrate how ecological and sampling-related factors can bias RAIs. Our simulations showed that (1) differences in detection between species led to bias in RAT ratios toward the more detectable species, especially at low detection levels, (2) species with larger home ranges were photographed more often, inflating RAIs, (3) species specific responses to different types of trap setup biased RAT ratios, and (4) changes in detection over time blurred true population trends inferred from RAIs. Empirical data for leopard cats Prionailurus bengalensis and common palm civets Paradoxurus hermaphroditus showed that traps set up along roads led to higher RAIs than off-road traps, but targeting roads increased detection more for leopard cats than for common palm civets. Comparing RAIs of Sunda clouded leopards Neofelis diardi and leopard cats with spatial capture-recapture based density estimates across sites, RAIs did not reflect differences in density. Analytical options for estimating density from camera-trapping data of unmarked populations are limited. Consequently, we fear that RAIs will continue to be applied. This is alarming, since these measures often form the basis for conservation and management decisions. We suggest considering alternative analytical and survey methods, especially when dealing with threatened species. (C) 2012 Elsevier Ltd. All rights reserved.
Study on the activity rhythms of nine ungulates in summer and autumn in Sichuan
DOI:10.11934/j.issn.1673-4831.2018.11.007
URL
[本文引用: 1]
基于全国哺乳动物观测网络中四川王朗、四姑娘山、贡嘎山及亚丁4个自然保护区2017年6—11月红外相机数据,利用相对丰富度指数RAI对四川羚牛(Budorcas tibetanus)、中华鬣羚(Capricornis milneedwardsii)、水鹿(Cervus unicolor)、毛冠鹿(Elaphodus cephalophus)、林麝(Moschus berezovskii)、高山麝(Moschus chrysogaster)、小麂(Muntiacus reevesi)、中华斑羚(Naemorhedus griseus)和岩羊(Pseudois nayaur)9种有蹄类动物的相对种群数量和日活动规律进行研究。结果表明:(1)毛冠鹿在九种有蹄类动物中的相对丰富度(64.12%)最高,且明显高于其他动物。(2)小麂、毛冠鹿和中华斑羚的日活动模式呈双峰型,具有明显的晨昏习性。(3)水鹿和中华鬣羚是典型的夜行性动物。(4)毛冠鹿在不同地区日活动模式均呈双峰型,但不同地区其活动高峰出现的时间段存在差异。有蹄类动物种群数量与食物资源、捕食压力等有关,活动节律受多种生物和非生物因素影响。研究四川地区有蹄类活动节律,可以为该地区有蹄类的监测及有效保护管理提供依据,并能为其捕食者行为学研究和保护提供数据支持。
四川9种有蹄类动物夏秋季活动节律研究
DOI:10.11934/j.issn.1673-4831.2018.11.007
URL
[本文引用: 1]
基于全国哺乳动物观测网络中四川王朗、四姑娘山、贡嘎山及亚丁4个自然保护区2017年6—11月红外相机数据,利用相对丰富度指数RAI对四川羚牛(Budorcas tibetanus)、中华鬣羚(Capricornis milneedwardsii)、水鹿(Cervus unicolor)、毛冠鹿(Elaphodus cephalophus)、林麝(Moschus berezovskii)、高山麝(Moschus chrysogaster)、小麂(Muntiacus reevesi)、中华斑羚(Naemorhedus griseus)和岩羊(Pseudois nayaur)9种有蹄类动物的相对种群数量和日活动规律进行研究。结果表明:(1)毛冠鹿在九种有蹄类动物中的相对丰富度(64.12%)最高,且明显高于其他动物。(2)小麂、毛冠鹿和中华斑羚的日活动模式呈双峰型,具有明显的晨昏习性。(3)水鹿和中华鬣羚是典型的夜行性动物。(4)毛冠鹿在不同地区日活动模式均呈双峰型,但不同地区其活动高峰出现的时间段存在差异。有蹄类动物种群数量与食物资源、捕食压力等有关,活动节律受多种生物和非生物因素影响。研究四川地区有蹄类活动节律,可以为该地区有蹄类的监测及有效保护管理提供依据,并能为其捕食者行为学研究和保护提供数据支持。
Limits to the estimation of species richness: The use of relative abundance distributions
DOI:10.1111/j.1366-9516.2005.00127.x
URL
[本文引用: 3]
The present study demonstrates the possibility of estimating species numbers of animal or plant communities from samples using relative abundance distributions. We use log-abundance pecies-rank order plots and derive two new estimators that are based on log-series and lognormal distributions. At small to moderate sample sizes these estimators appear to be more precise than previous parametric and nonparametric estimators. We test our estimators using samples from 171 published medium-sized to large animal and plant communities taken from the literature. By this we show that our new estimators define also limits of precision.
The application of infrared camera in mammal research in Guanyinshan Nature Reserve, Shaanxi
正国外使用红外相机技术开展野生动物调查研究已有较长的历史,最早的报道见于Champion(1927),在20世纪90年代逐渐发展成熟,广泛用于动物种群数量和密度的研究。如应用红外相机和
红外相机技术在陕西观音山自然保护区兽类监测研究中的应用
正国外使用红外相机技术开展野生动物调查研究已有较长的历史,最早的报道见于Champion(1927),在20世纪90年代逐渐发展成熟,广泛用于动物种群数量和密度的研究。如应用红外相机和
Using capture-recapture models in wildlife camera-trapping monitoring and the study case
基于标记-重捕模型开展野生动物红外相机种群监测的方法及案例
Using occupancy models in wildlife camera-trapping monitoring and the study case
占域模型的原理及在野生动物红外相机研究中的应用案例
Applications of camera trapping to wildlife surveys in China
DOI:10.3724/SP.J.1003.2014.14244
URL
[本文引用: 1]
长期以来,野生动物(特别是兽类)监测面临着极大困难,具体表现在:(1)许多野生动物种群数量日渐减 少,甚至濒临灭绝;(2)未经许可,许多珍稀种类禁止采集实体样本;(3)许多动物昼伏夜出,活动隐秘,很难观察到实体,甚至很难发现痕迹;(4)许多动 物仅分布在人稀罕至的森林或其他生境中,监测难度大、成本高;(5)野生动物行为习性和生存空间多种多样,难以形成统一的监测方法和技术标准.20世纪 90年代以来,“3S”技术、分子生物学技术、数码影像技术(如自动相机技术或红外相机技术(automated-camera monitoring technology或cameratrapping)等开始广泛应用于野生动物的监测与研究.
红外相机技术在我国野生动物监测研究中的应用
DOI:10.3724/SP.J.1003.2014.14244
URL
[本文引用: 1]
长期以来,野生动物(特别是兽类)监测面临着极大困难,具体表现在:(1)许多野生动物种群数量日渐减 少,甚至濒临灭绝;(2)未经许可,许多珍稀种类禁止采集实体样本;(3)许多动物昼伏夜出,活动隐秘,很难观察到实体,甚至很难发现痕迹;(4)许多动 物仅分布在人稀罕至的森林或其他生境中,监测难度大、成本高;(5)野生动物行为习性和生存空间多种多样,难以形成统一的监测方法和技术标准.20世纪 90年代以来,“3S”技术、分子生物学技术、数码影像技术(如自动相机技术或红外相机技术(automated-camera monitoring technology或cameratrapping)等开始广泛应用于野生动物的监测与研究.
Preliminary survey using infrared camera reveals fauna and avifauna diversity at Hupingshan National Nature Reserve, Hunan, China
DOI:10.16829/j.slxb.150137
URL
[本文引用: 1]
2012年8月至2015年8月,在壶瓶山国家级自然保护区布设20个红外相机监测公里网格,对保护区的兽类和鸟类多样性进行了初步调查。经过19 592个有效相机工作日的调查,共记录到兽类4目11科21种和鸟类4目8科33种,其中有国家Ⅰ级重点保护野生动物1种(林麝Moschus berezovskii)、国家Ⅱ级重点保护野生动物8种和保护区新纪录兽类1种(红腿长吻松鼠Dremomys pyrrhomerus)。兽类以食肉目种类最多(9种),其次为偶蹄目(6种)和啮齿目(5种)。毛冠鹿(Elaphodus cephalophus)、野猪(Sus scrofa)、红腿长吻松鼠、小麂(Muntiacus reevesi)和猪獾(Arctonyx collaris)的相对丰富度居于兽类的前五位。鸟类以雀形目的种类最多(25种),其次是鸡形目(5种)和鴷形目(2种)。红腹锦鸡(Chrysolophus pictus)、红腹角雉(Tragopan temminckii)和眼纹噪鹛(Garrulax ocellatus)的相对丰富度指数居于鸟类的前三位。此外,本文对红腹锦鸡、红腹角雉、红腿长吻松鼠、毛冠鹿、野猪和小麂等常见物种的日活动节律和年活动节律进行了初步分析。本次调查初步了解了保护区内地栖大中型兽类和鸟类的本底信息,为保护区今后开展野生动物长期监测提供了重要依据。
利用红外相机对湖南壶瓶山国家级自然保护区兽类和鸟类多样性的初步调查
DOI:10.16829/j.slxb.150137
URL
[本文引用: 1]
2012年8月至2015年8月,在壶瓶山国家级自然保护区布设20个红外相机监测公里网格,对保护区的兽类和鸟类多样性进行了初步调查。经过19 592个有效相机工作日的调查,共记录到兽类4目11科21种和鸟类4目8科33种,其中有国家Ⅰ级重点保护野生动物1种(林麝Moschus berezovskii)、国家Ⅱ级重点保护野生动物8种和保护区新纪录兽类1种(红腿长吻松鼠Dremomys pyrrhomerus)。兽类以食肉目种类最多(9种),其次为偶蹄目(6种)和啮齿目(5种)。毛冠鹿(Elaphodus cephalophus)、野猪(Sus scrofa)、红腿长吻松鼠、小麂(Muntiacus reevesi)和猪獾(Arctonyx collaris)的相对丰富度居于兽类的前五位。鸟类以雀形目的种类最多(25种),其次是鸡形目(5种)和鴷形目(2种)。红腹锦鸡(Chrysolophus pictus)、红腹角雉(Tragopan temminckii)和眼纹噪鹛(Garrulax ocellatus)的相对丰富度指数居于鸟类的前三位。此外,本文对红腹锦鸡、红腹角雉、红腿长吻松鼠、毛冠鹿、野猪和小麂等常见物种的日活动节律和年活动节律进行了初步分析。本次调查初步了解了保护区内地栖大中型兽类和鸟类的本底信息,为保护区今后开展野生动物长期监测提供了重要依据。
Comparisons of different camera trap placement patterns in monitoring mammal resources in Gutianshan National Nature Reserve
From June 2010 to August 2011, four different camera trap placement patterns, >0.05), but the three patterns had significant difference (<0.01) with same elevation pattern. Due to its grid model, welldistributed camera, and arrangement specifications, same elevation pattern operated better than the other three patterns.
不同相机布放模式在古田山兽类资源监测中的比较
From June 2010 to August 2011, four different camera trap placement patterns, >0.05), but the three patterns had significant difference (<0.01) with same elevation pattern. Due to its grid model, welldistributed camera, and arrangement specifications, same elevation pattern operated better than the other three patterns.
