)
)
)
)
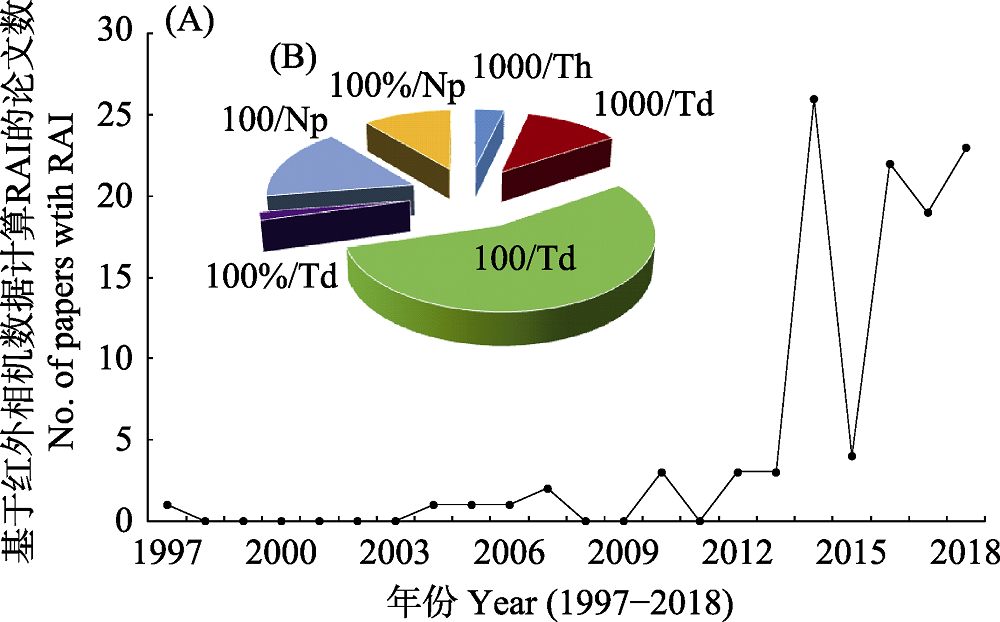
图1. 我国基于红外相机数据计算相对多度指数(RAI)的编目论文统计分析(1997-2018)。(A)不同年份发表关于RAI的编目论文总数(N = 109); (B)不同RAI类型的文章比例, 以单位抽样时间内所拍摄的独立有效照片数来获得RAI_2 (N = 79), 包括以1,000 h为单位的论文(1000/Th, N = 4)、以1,000 d为单位的论文(1000/Td, N = 13)、以100 d为单位的论文(100/Td, N = 60)和以1 d为单位的论文(100%/Td, N = 2)等4种亚类型; 另一种则主要分析调查区域内每个物种占所有独立有效照片数的比例(N = 30), 包括每100或1,000张独立有效照片中的物种照片数(100/Np, N = 18)和物种的独立有效照片数占所有物种独立有效照片总数的比例(100%/Np, N = 12)。
Fig. 1. Summary about the papers of species inventory with the relative abundance index based on camera trapping data across China (from 1997 to 2018). (A) The camera-trapping papers in each year (N = 109); (B) These inventory papers with two key categories and six subtypes: one is to get the RAI based on the independent photo each unit of trapping effort (N = 79) with the unit of 1,000 h (1,000/Th, N = 4), 1,000 d (1,000/Td, N = 13), 100 d (100/Td, N = 60) and 1 d (100%/Td, N = 2); the other is to get the relative composition (N = 30), including species composition from 100 or 1,000 independent photo from a given site (100/Np, N = 18), and the proportion of each species among all independent photo from a given site (100%/Np, N = 12).