Spatial patterns of species diversity and range size along environmental gradients and their underlying mechanisms have long been controversial issues in biogeography and ecology. The species-area relationship, water-energy dynamic hypothesis and mid-domain effect were used here to explain the elevational patterns of amphibian and reptile species richness and their different faunal components in China’s Qinling Range using multivariate regression models and the variance partitioning algorithm. Our results showed unimodal patterns for the elevational distributions of amphibians, reptiles and their faunal components, but the peaks of the patterns differed among groups. The underlying mechanisms shaping the patterns revealed intensive interactions, while the independent explanatory strengths of the three proposed hypotheses (exclude reptile oriental realm) were relatively weak. The water-energy dynamic hypothesis was the most parsimonious explanation of the observed patterns. The majority of water-energy dynamic explanation belonged to interaction of three hypotheses. The interaction between mid-domain effect and water-energy dynamics was larger for amphibians and that between species-area relationship and water-energy dynamic hypothesis was larger for reptiles. The Steven’s and cross-species methods were used to examine whether species-specific elevational range sizes of amphibians, reptiles and their different faunal components are applicable to Rapoport’s rule. The results showed that reptile range sizes supported Rapoport’s rule at the various elevational gradients, while amphibian range sizes were difficult to support Rapoport’s rule.
Keywords:species richness
;
climate
;
mid-domain effect
;
area
;
elevational gradient pattern
;
Rapoport’s rule
;
Qinling Range
ZhiZheng, DajieGong, ChengxiangSun, XiaojunLi, WanjiangLi. Elevational pattern of amphibian and reptile diversity in Qinling Range and explanation[J]. Biodiver Sci, 2014, 22(5): 596-607 https://doi.org/10.3724/SP.J.1003.2014.14005
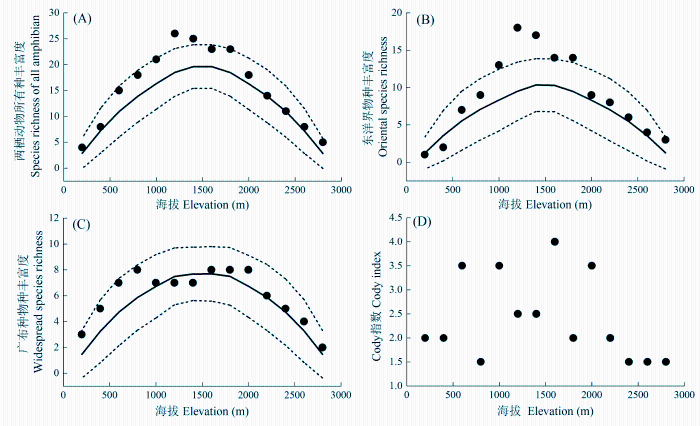
Fig. 1 Elevational patterns of species diversity of amphibians and different faunal components. Dot represents observed richness; solid line represents the predicted richness by mid-domain effect model, while dashed lines represent the 95% confident intervals of predicted richness.
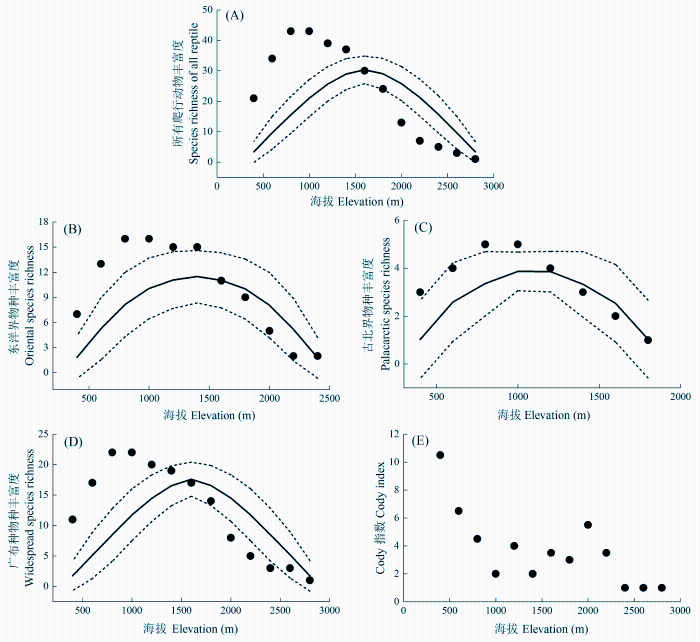
Fig. 2 Elevational distribution patterns of species diversity of reptiles and different faunal components. Dot represents observed richness; solid line represents the predicted richness by mid-domain effect model, while dashed lines represent the 95% confident intervals of predicted richness.
Table 1 Percentage of variations explained by different hypotheses for the elevational species diversity patterns of amphibians and reptiles in the Qinling Range
Table 2 Linear regression models for the elevational patterns of amphibians, reptiles, their different faunal components and different factors in the Qinling Range.
丰富度 Richness
变量 Variables
AIC
模型解释力 Model explanation (R2, %)
两栖动物 Amphibian
Area, PET, PET2, PAN
-98.12
99.05
东洋界 Oriental
Area, PR, PET, PET2, PAN
-72.52
96.99
广布种 Widespread
PR, PAN
-84.55
94.08
爬行动物 Reptile
Area, PR, PET, PET2
-80.82
99.44
东洋界 Oriental
Area, PR, PET, PET2, PAN
-61.12
97.55
古北界Palaearctic
Area, PR, PET, PAN
-57.67
98.98
广布种Widespread
Area, PR, PET, PET2
-69.34
97.98
PET, potential evapotranspiration; PAN, mean annual precipitation; PR, the species richness of mid-domain effect prediction.PET: 潜在蒸散量; PAN: 年降雨量; PR: 中域效应预测的物种丰富度.
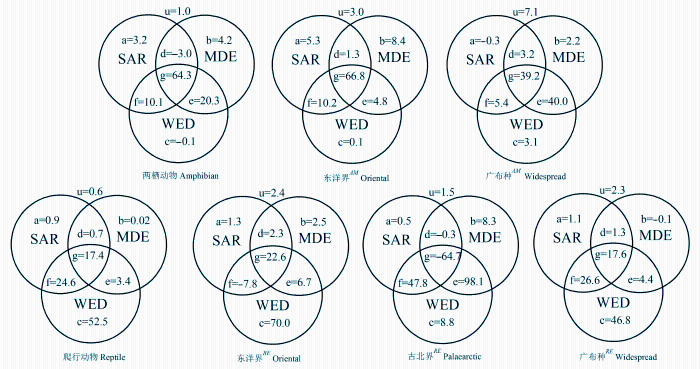
Fig. 3 The variation partitioning for the effects of area, water-energy and mid-domain effect on the richness of amphibians, reptiles and their different faunal components in Qinling Range, in terms of the percentage of sum of variances explained. The components a, b and c are the pure effects of area, water-energy, mid-domain effect, while d, e, f and g are the interaction between them. u is an unexplained component of three variables. AM represents different fauna components for amphibians, and RE represents different faunal components for reptiles.
Table 3 Linear regression models for the amphibians, reptiles, their different faunal component species range size and different factors in the Qinling Range.
物种种域 Species range
模型 Model
模型解释力 Model explanation (R2, %)
P
两栖动物 Amphibian
R = -2.86 PAN + 3,459.22
61.64
5.33×10⁻⁴
R = 15.64 MAT + 1,169.32
4.35
0.23
东洋界Oriental
R = -3.13 PAN + 3,342.92
66.83
2.17×10⁻⁴
R = 18.61 MAT +823.87
7.85
0.17
广布种Widespread
R = 15.99 PAN - 8,215.62
68.52
1.57×10⁻⁴
R = 32.74 MAT +3,067.28
1.8
0.65
爬行动物 Reptile
R = -1.88 PAN +2,714.46
5.4
0.22
R = -67.81 MAT + 2,137.26
81.6
1.42×10⁻⁵
东洋界 Oriental
R = 0.25 PAN + 850.63
0.6
0.82
R= -16.46 MAT +1,249.15
10.25
0.34
古北界Palaearctic
R = 1.19 PAN + 191.52
12.71
0.38
R=-62.29 MAT + 1,968.37
53.34
0.02
广布种Widespread
R = 1.4 PAN + 2,480.54
0.47
0.33
R = -65.11 MAT + 2,224.88
90.57
3.47×10⁻⁷
R, species range; PAN, mean annual rainfall; MAT, mean annual temperature.R: 物种种域; PAN: 降雨量; MAT: 年均温
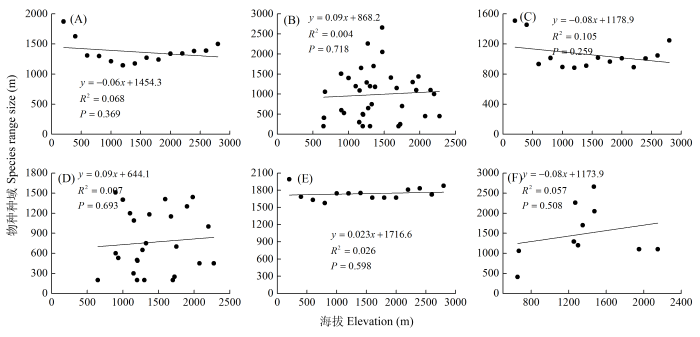
Fig. 4 Test of Rapoport’s rule for amphibian range along the elevational gradient. (A) Steven’s method for amphibians; (B) Cross-species method for amphibian; (C) Steven’s method for oriental; (D) Cross-species method for oriental; (E) Steven’s method for widespread; (F) Cross-species method for widespread
Fig. 5 Test of Rapoport’s rule for reptile range along the elevational gradients. (A) Steven’s method for reptiles; (B) Cross-species method for reptiles; (C) Steven’s method for oriental; (D) Cross-species method for oriental; (E) Steven’s method for Palaearctic; (F) Cross-species method for Palaearctic (G) Steven’s method for widespread; (H) Cross-species method for widespread
3 讨论
3.1 秦岭两栖、爬行动物及其不同区系成分物种丰富度的海拔梯度格局及其解释
物种丰富度沿环境梯度的变化格局及其成因机制一直是生态学研究中的重要议题(Wang et al., 2007)。关于物种丰富度大尺度地理格局的研究主要集中在两个方面, 即不同格局的描述和形成其格局的解释。本研究通过对秦岭两栖、爬行动物及其不同区系成分的物种丰富度的海拔梯度格局的研究结果表明, 除两栖动物广布种外, 均呈单峰分布格局, 但峰值分布的海拔段有所差异, 两栖动物物种丰富度峰值接近中海拔段, 爬行动物则在低海拔段。我们的研究结果支持Rahbek(1995)、McCain和Grytnes(2010)的观点, 即单峰分布格局最为普遍。秦岭两栖、爬行动物及其不同区系成分的物种丰富度海拔梯度格局与秦岭地区太白山、牛背梁植物物种丰富度海拔梯度格局相一致(唐志尧和柯金虎, 2004; 池秀莲和唐志尧, 2011)。另外, 横断山脉蛙类、蜥蜴类、蛇类的海拔分布及其棘蛙在其整个分布区的海拔分布都为单峰分布格局(Fu et al., 2006, 2007; Hu et al., 2011)。
Appendix 1 Literature sources for secondary data on amphibian and reptile distributions in the Qinling Range http://www.biodiversity-science.net/fileup/PDF/w2014-005-1.pdf
Chen XH (陈晓虹), Jiang JP (江建平) (2004) Supplementary description of Paa (Fei Rana) Taihangnicus (Anura, Ranidae) from Taihong Mountain, Henan of China. Acta Zootaxonomica Sinica (动物分类学报), 29, 595-599. (in Chinese with English abstract)
Chen XH (陈晓虹), Li L (李磊), Jiang JP (江建平), Qiao L (乔梁), Yang J (杨杰) (2009) Supplementary description geographic distribution of Scutiger ningshanensis, from Funiu Mountain, Henan, China. Acta Zootaxonomica Sinica (动物分类学报), 34, 647-653. (in Chinese with English abstract)
Chen XH (陈晓虹), Yang J (杨杰), Qu WY (瞿文元) (2007) The geographical distribution of Pseudohynobius tsinpdensis newly discovered in Henan Province. Chinese Journal of Zoology (动物学杂志), 42, 148-150. (in Chinese with English abstract)
Fang RS (方荣盛) (1985) A new species of Scutiger from Shaanxi, China. Acta Herpetologica Sinica (两栖爬行动物学报), 4, 305-307. (in Chinese )
Fang RS (方荣盛), Song MT (宋鸣涛) (1981) Original survey of snakes in the southern slope in Qinling eastern domain. Journal of Shaanxi Normal University (Natural Science Edition) (陕西师范大学学报(自然科学版)), 1981, 263-272. (in Chinese with English abstract)
Fang RS (方荣盛), Wang TZ (王廷正) (1983) Three snake records in Shaanxi Province. Acta Herpetologica Sinica (两栖爬行动物学报), 2, 75-76. (in Chinese with English abstract)
Gong HS (巩会生), Zeng ZG (曾治高), Song TP (宋团谱), Zheng XY (郑晓燕), Cai XL (蔡晓丽), Fu P (付沛) (2012) Compositions and distributions of amphibians and reptiles in Foping Natural Reserve. Journal of Northwest Forestry University (西北林学院学报), 27, 122-126. (in Chinese with English abstract)
Gong DJ (龚大洁), Mou M (牟迈), Li XP (李晓鹏), Teng JR (藤继荣), Zhang KR (张可荣) (2008) Reproductive behavior of Tylototriton wenxianensis. Chinese Journal of Zoology (动物学杂志), 43(4), 48-55. (in Chinese with English abstract)
Hu SQ (胡淑琴), Zhao EM (赵尔宓), Liu CZ (刘承钊) (1996) A herpetological survey of the Tsining and Taipaishan region. Acta Zoologica Sinica (动物学报), 18, 57-89. (in Chinese with English abstract)
Jiang JP (江建平), Wang B (王斌), Liu TY (刘烔宇), Xie F (谢锋) (2006) Amphibians in Laoxiancheng Nature Reserve. Sichuan Journal of Zoology (四川动物), 25, 281-284. (in Chinese with English abstract)
Li C (李成), Li SQ (李胜全), Wang YZ (王跃招), Zhang T (张涛) (2000) Herpetological survey of southern Gansu Province, China. Sichuan Journal of Zoology (四川动物), 19, 74-76. (in Chinese with English abstract)
Ma Y (马勇), Ma YS (马亦生), Gong HS (巩会生), Song MT (宋鸣涛), Xiao H (肖红), Yang JT (杨俊涛) (2006) Preliminary investigation on amphibian and reptilian in Taibaishan National Nature Reserve, Shaanxi. Sichuan Journal of Zoology (四川动物), 25, 277-286. (in Chinese with English abstract)
Pope CH (1935)The Reptiles of China: Turtles, Crocodilians, Snakes, Lizards. American Museum of Natural History, New York.
Song MT (宋鸣涛) (1985) A new species of Gekko from Shaanxi Province. Acta Herpetologica Sinica (两栖爬行动物学报), 4, 329-330. (in Chinese with English abstract)
Song MT (宋鸣涛) (1987a) The Herpetofauna of Shaanxi Province. Acta Herpetologica Sinica (两栖爬行动物学报), 6, 63-73. (in Chinese with English abstract)
Song MT (宋鸣涛) (1987b) Survey of the reptiles of southern Shaanxi Province. Acta Herpetologica Sinica (两栖爬行动物学报), 6, 59-64. (in Chinese)
Song MT (宋鸣涛) (1986) The Herpetofauna in Taibaishan Northern slope of Qinling Mountain. Chinese Journal of Zoology (动物学杂志), 5, 9-11. (in Chinese with English abstract)
Song MT (宋鸣涛), Fang RS (方荣盛) (1982) The utilization of amphibian and reptilian and the analysis of food of snakes in the south flank of Qinling range. Zoological Research (动物学研究), 3, 243-250. (in Chinese with English abstract)
Stejnejer L (1925) Chinese amphibians and reptiles in the United States National Museum. Proceedings of the United States National Museum, 66, 1-115.
Xia ZR (夏中荣), Chen XH (陈晓虹), Liang JB (梁俊波) (2006) A survey on diversity of amphibians in Funiu Mountain, Henan. Sichuan Journal of Zoology (四川动物), 25, 307-311. (in Chinese with English abstract)
Yang X, Wang B, Hu JH, Jiang JP (2011) A new species of the genus Feirana (Amphibia: Anura: Dicroglossidae) from the western Qinling Mountains of China. Asian Herpetological Research, 2, 72-86.
Yao CY (姚崇勇), Zhang SZ (张绳祖) (1989) Herpetology from the forest regions of the Xiaolong Mountain in Gansu. Journal of Northwestern Normal University (Natural Science Edition) (西北师范大学学报(自然科学版)), 1, 55-68. (in Chinese with English abstract)
Yuan H (原洪) (1983) A herpetological survey in Huoditang forest of the Qinling Mountain. Acta Herpetologica Sinica (两栖爬行动物学报), 2, 59-64. (in Chinese with English abstract)
Yuan H (原洪) (1985) Reptile fauna of Shaanxi Province. Acta Herpetologica Sinica (两栖爬行动物学报), 4, 133-139. (in Chinese with English abstract)
Yuan H (原洪), Huang ZF (黄正发) (1985) A herpetological survey in Foping natural Reserve. Acta Herpetologica Sinica (两栖爬行动物学报), 4, 50-51. (in Chinese with English abstract)
Zhang Q (张琼), Gong DJ (龚大洁), Zhang KR (张可荣), Xu Y (许颖) (2007) Investigation and conservation measures on amphibians and reptiles in Gansu Baishuijiang Nature Reserve. Sichuan Journal of Zoology (四川动物), 26, 329-332. (in Chinese with English abstract)
附表1
Table S1
附表1
附表1 秦岭两栖、爬行动物物种名录及其海拔分布
Table S1 List of amphibian and reptile species and their elevational range in the Qinling Mountain Ranges http://www.biodiversity-science.net/fileup/PDF/w2014-005-2.pdf
物种 Species
区系成分 Faunal components
海拔分布 Elevational range (m)
两栖动物
Amphibain
隐鳃鲵科
Cryptobranchidae
大鲵*
Andrias davidianus
广布种
700-1,900
小鲵科
Hynobiidae
秦巴拟小鲵*
Pseudohynobius tsinpaensis
东洋界
1,700-2,700
黄斑拟小鲵**
P. flavomaculatus
东洋界
1,850-2,300
西藏山溪鲵*
Batrachuperus tibetanus
广布种
1,260-2,700
蝾螈科
Salamandridae
文县瑶螈*
Yaotriton wenxianensis
东洋界
1,100-1,300
角蟾科
Megophryidae
峨山掌突蟾**
Paramegophrys oshanensis
东洋界
950-1,700
小角蟾**
Megophrys minor
东洋界
1,400-2,100
南江角蟾**
M. nankiangensis
东洋界
1,600-1,850
巫山角蟾*
M. wushanensis
东洋界
950-1,450
川北齿蟾**
Oreolalax chuanbeiensis
广布种
960-1,450
宁陕齿突蟾**
Scutiger (Scutiger) ningshanensis
东洋界
1,250-2,550
平武齿突蟾**
S. (Scutiger) pingwuensis
东洋界
2,050-2,500
胸腺猫眼蟾**
S. (Aelurophryne) glandulatus
东洋界
1,600-1,800
蟾蜍科
Bufonidae
华西大蟾蜍*
Bufo gargarizans
东洋界
300-1,700
中华大蟾蜍*
B. gargarizans
广布种
140-2,400
花背蟾蜍*
Strauchbufo raddei
古北界
350-2,000
雨蛙科
Hylidae
秦岭雨蛙*
Hyla tsinlingensis
东洋界
890-2,300
蛙科
Ranidae
黑斑侧褶蛙*
Pelophylax nigromaculatus
广布种
140-2,800
叉舌蛙科
Dicroglossidae
泽陆蛙*
Fejervarya multistriata
东洋界
140-1,200
绿臭蛙*
Odorrana margaretae
东洋界
1,000-1,300
大绿臭蛙*
O. graminea
东洋界
1,200-1,400
棘腹蛙*
Quasipaa boulengeri
广布种
610-1,900
太行隆肛蛙*
Feirana taihangnica
东洋界
500-1,700
康县隆肛蛙*
F. kangxianensis
东洋界
780-1,962
隆肛蛙*
F. quadranus
广布种
500-2,200
中国林蛙*
Rana chensinensis
广布种
450-2,500
崇安湍蛙*
Amolops chunganensis
东洋界
670-1,200
四川湍蛙*
A. mantzorum
东洋界
1,100-2,250
树蛙科
Rhacophoridae
斑腿泛树蛙*
Polypedates megacephalus
东洋界
600-1,200
姬娃科
Microhylidae
合征姬蛙*
Microhyla mixtata
广布种
610-1,700
饰纹姬娃*
M. fissipes
东洋界
140-1,650
花姬蛙**
M. pulchra
东洋界
550-750
北方狭口蛙*
Kaloula borealis
广布种
450-860
四川狭口蛙**
K. rugifera
东洋界
950-1,600
爬行动物
Reptile
龟科
Testubinidae
乌龟*
Chinemys reevesil
广布种
450-1,550
鳖科
Trionychidae
鳖*
Trionyx sinensis
广布种
450-1,500
山瑞鳖**
T. steindachneri
广布种
500-600
石子龙科
Scincidae
蓝尾石龙子*
Eumeces elegans
广布种
700-900
中国石龙子**
E. chinensis
东洋界
2,110-2,310
黄纹石龙子*
E. xanthi
广布种
640-1,900
秦岭滑蜥*
Leiolopisma tsinlingensis
广布种
890-2,100
铜蜓蜥*
Sphenomorphus indicus
东洋界
450-1,900
丽斑麻蜥*
Eremias argus
300-1,100
北草蜥*
Takydromus septentrionalis
450-2,100
鬣蜥科
Agamidae
丽纹龙蜥**
Japalura splendida
东洋界
450-900
草绿龙蜥**
J. flaviceps
东洋界
450-900
米仓龙蜥*
Japalura micangshanensis
东洋界
760-1,300
壁虎科
Gekkonidae
多疣壁虎*
Gekko japonicus
东洋界
400-1,400
无蹼壁虎*
G. swinhonis
广布种
300-1,400
太白壁虎*
G. taibaiensis
东洋界
900-1,600
蝰科
Viperidae
白头蝰**
Azemiop feae
东洋界
980-1,700
短尾蝮*
Gloydius brevicaudus
广布种
850-2,590
中介蝮*
G. intermedius
古北界
500-1,894
高原蝮*
G. strauchi
广布种
890-2,800
山烙铁头*
Ovophis monticola
东洋界
1,150-2,000
菜花原矛头蝮*
Protobothrops jerdonii
广布种
800-2,500
竹叶青*
Trimeresurus stejnegeri
广布种
600-2,300
游蛇科
Colubridae
黑脊蛇*
Achalinus spinalis
东洋界
450-1,900
绣链腹链蛇**
Amphiesma craspedogaster
东洋界
650-1,700
棕黑腹链蛇**
A. sauteri
东洋界
650-1,100
绞花林蛇*
Boiga kraepelini
东洋界
700-900
黄脊游蛇**
Coluber spinalis
古北界
430-1,300
翠青蛇*
Cyclophiops major
广布种
450-1,700
赤链蛇*
Dinodon rufozonatum
广布种
300-1,700
王锦蛇*
Elaphe carinata
广布种
450-1,800
白条锦蛇*
E. dione
古北界
300-1,500
玉斑锦蛇**
E. mandarian
广布种
300-1,550
紫灰锦蛇**
E. porphyracea
东洋界
600-1,700
黑眉锦蛇*
E. taeniura
广布种
450-1,700
棕黑锦蛇**
E. schrenckii
东洋界
300-900
团花锦蛇**
E. davidi
古北界
850-900
双斑锦蛇*
E. bimaculate
广布种
500-1,200
黑背白环蛇**
Lycodon ruhslratilyoo
东洋界
1,100-1,450
双全白环蛇**
L. fasciatus
广布种
650-1,700
宁陕小头蛇**
Oligodon ningshanensis
东洋界
1,400-1,650
横纹小头蛇**
O. multizonatum
东洋界
790-1,350
福建颈斑蛇**
Plagiopholis styani
东洋界
500-700
大眼斜鳞蛇*
Pseudoxenodon macrops
广布种
600-2,000
颈槽蛇*
Rhabdophis nuchalis
广布种
600-2,000
虎斑颈槽蛇*
R. tigrina
东洋界
300-1,900
黑头剑蛇**
Sibynophis chinensis
广布种
610-1,400
乌华游蛇*
Sinonnatrix percarinate
东洋界
450-1,700
小头坭蛇**
Trachischium tenuiceps
东洋界
600-800
乌梢蛇*
Zaocys dhumnades
广布种
450-1,800
** l来源于文献, *来自作者 ** from literature, * from author.
Effects of area, temperature and geometric constraints on elevational patterns of species richness: a case study in the Mountain Taibai, Qinling Mountains, China
. Chinese Journal of Plant Ecology(植物生态学报), 35, 362-370. (in Chinese with English abstract)
.Editorial Board for Mountains Climate Collected Works (山地气候文集编委会) (1984) Mountain Climate Collected Works (山地气候文集). Meteorological Press, Beijing. (in Chinese)
.Editorial Board of Physical Geography of China, CAS (中国科学院中国自然地理编委会) (1980) The Physical Geography of China, Volume of Physiognomy (中国自然地理·地貌卷). Science Press, Beijing. (in Chinese)
.FeiL (费梁), YeCY (叶昌媛), JiangJP (江建平) (2012) Colored Atlas of Chinese Amphibians and Their Distributions (中国两栖动物及其分布彩色图鉴). Sichuan Publishing House of Science and Technology, Chengdu. (in Chinese)
Elevational pattern of species richness in the Three Gorges Region of the Yangtze River: effect of climate, geometric constraints, area and topographical heterogeneity
. Biodiversity Science(生物多样性), 21, 141-152. (in Chinese with English abstract)
On the test of the Rapoport’s rule, algorithm comparison, and weakening of mid-domain effect: with a case study on the seed plants in Mt. Wuliang, Yunnan Province
. Journal of Mountain Science(山地学报), 28, 526-533. (in Chinese with English abstract)
.Shaanxi Institute of Zoology (陕西省动物研究所), Institute of Hydrobiology of Chinese Academy of Sciences (中国科学院水生生物研究所), Biological Department of Lanzhou University (兰州大学生物系) (1987) The Fishes of Qinling Range (秦岭鱼类志). Science Press, Beijing. (in Chinese)
Constraining null models with environmental gradients: a new method for evaluating the effects of environmental factors and geometric constraints on geographic diversity patterns
Effects of area, temperature and geometric constraints on elevational patterns of species richness: a case study in the Mountain Taibai, Qinling Mountains, China
4
2011
... 人们提出了各种假设解释物种多样性的海拔分布格局.其中, 种—面积关系、水分能量动态假设、中域效应应用较为普遍(池秀莲和唐志尧, 2011; 李巧燕和王襄平, 2013).水分能量动态假设(water- energy dynamic hypothesis, WED)认为, 物种多样性的地理分布格局是由水分和能量共同决定, 水分调节生物体对能量的利用过程(O’Brien, 1993, 1998).大量研究表明, 水分和能量是解释物种多样性地理格局的重要环境因子(Hawkins et al., 2003; Kreft & Jetz, 2007; de Oliveira & Diniz-Filho, 2010).相对其他脊椎动物类群, 两栖爬行动物的地理分布更容易受水分和能量的限制.其次, 取样面积也是影响物种多样性地理分布格局的重要因子.种—面积关系(species-area relationship, SAR)解释物种多样性随取样面积增加而增加的机制, 同时, 也反映了物种的空间周转率(Qiao et al., 2012).随取样面积的增加, 生境异质性和一定面积内获得的能量资源也增加, 从而孕育了更多的物种(Fraser & Currie, 1996; Báldi, 2008).中域效应模型(mid-domain effect, MDE)(也称边界效应)是基于物种即使在没有任何环境条件的限制下, 由于受物种分布边界的限制, 物种分布呈两端低中间高的钟形分布曲线(Colwell et al., 2004).自从中域效应提出之后, 边界限制是否对物种地理分布格局构成限制一直存在广泛的争议(Hawkins et al., 2005; Currie & Kerr, 2008).最近有研究表明, 边界限制和环境因子结合更能合理解释物种多样性的地理格局(Grytnes & Beaman, 2006; Wang & Fang, 2012). ...
... (2) 种-面积关系.该假说认为物种多样性随栖息地面积的增加成幂函数增长关系(Triantis et al., 2003).本文采用对数转化后的幂函数方程量化了面积对秦岭两栖、爬行动物及其不同区系成分的物种丰富度海拔格局的影响(池秀莲和唐志尧, 2011; 李巧燕和王襄平, 2013). ...
... 同时, 采用方差分离(variable partition)和回归分析的方法判断SAR、WED、MDE对秦岭两栖、爬行动物及其不同区系成分物种丰富度海拔格局的相对作用和交互作用(Heikkinen et al., 2005; 池秀莲和唐志尧, 2011).方差分离在R程序Vegan程序包Varpart程序中进行.最后, 采用回归分析和池赤信息标准(Akaike Information Criterion, AIC)统计量筛选最优回归模型. ...
... 物种丰富度沿环境梯度的变化格局及其成因机制一直是生态学研究中的重要议题(Wang et al., 2007).关于物种丰富度大尺度地理格局的研究主要集中在两个方面, 即不同格局的描述和形成其格局的解释.本研究通过对秦岭两栖、爬行动物及其不同区系成分的物种丰富度的海拔梯度格局的研究结果表明, 除两栖动物广布种外, 均呈单峰分布格局, 但峰值分布的海拔段有所差异, 两栖动物物种丰富度峰值接近中海拔段, 爬行动物则在低海拔段.我们的研究结果支持Rahbek(1995)、McCain和Grytnes(2010)的观点, 即单峰分布格局最为普遍.秦岭两栖、爬行动物及其不同区系成分的物种丰富度海拔梯度格局与秦岭地区太白山、牛背梁植物物种丰富度海拔梯度格局相一致(唐志尧和柯金虎, 2004; 池秀莲和唐志尧, 2011).另外, 横断山脉蛙类、蜥蜴类、蛇类的海拔分布及其棘蛙在其整个分布区的海拔分布都为单峰分布格局(Fu et al., 2006, 2007; Hu et al., 2011). ...
RangeModel: tools for exploring and assessing geometric constraints on species richness (the mid-domain effect) along transects
1
2008
... (3) 中域效应.该假说认为物种丰富度受分布边界限制的影响, 呈两边低、中间高的单峰分布格局(Colwell et al., 2004).本研究将秦岭两栖、爬行动物及其不同区系成分的物种分布宽度为模拟区域, 物种数作为不同的随机抽样样本量, 采用RangeModel程序中的模型5(Empirical Frequency Distribution, Random Midpoint, 经验分布宽度模型)模拟秦岭两栖、爬行及其不同区系成分的物种丰富度格局(Colwell, 2008; 王襄平等, 2009). ...
The mid-domain effect and species richness patterns: what have we learned so far
3
2004
... 人们提出了各种假设解释物种多样性的海拔分布格局.其中, 种—面积关系、水分能量动态假设、中域效应应用较为普遍(池秀莲和唐志尧, 2011; 李巧燕和王襄平, 2013).水分能量动态假设(water- energy dynamic hypothesis, WED)认为, 物种多样性的地理分布格局是由水分和能量共同决定, 水分调节生物体对能量的利用过程(O’Brien, 1993, 1998).大量研究表明, 水分和能量是解释物种多样性地理格局的重要环境因子(Hawkins et al., 2003; Kreft & Jetz, 2007; de Oliveira & Diniz-Filho, 2010).相对其他脊椎动物类群, 两栖爬行动物的地理分布更容易受水分和能量的限制.其次, 取样面积也是影响物种多样性地理分布格局的重要因子.种—面积关系(species-area relationship, SAR)解释物种多样性随取样面积增加而增加的机制, 同时, 也反映了物种的空间周转率(Qiao et al., 2012).随取样面积的增加, 生境异质性和一定面积内获得的能量资源也增加, 从而孕育了更多的物种(Fraser & Currie, 1996; Báldi, 2008).中域效应模型(mid-domain effect, MDE)(也称边界效应)是基于物种即使在没有任何环境条件的限制下, 由于受物种分布边界的限制, 物种分布呈两端低中间高的钟形分布曲线(Colwell et al., 2004).自从中域效应提出之后, 边界限制是否对物种地理分布格局构成限制一直存在广泛的争议(Hawkins et al., 2005; Currie & Kerr, 2008).最近有研究表明, 边界限制和环境因子结合更能合理解释物种多样性的地理格局(Grytnes & Beaman, 2006; Wang & Fang, 2012). ...
... (3) 中域效应.该假说认为物种丰富度受分布边界限制的影响, 呈两边低、中间高的单峰分布格局(Colwell et al., 2004).本研究将秦岭两栖、爬行动物及其不同区系成分的物种分布宽度为模拟区域, 物种数作为不同的随机抽样样本量, 采用RangeModel程序中的模型5(Empirical Frequency Distribution, Random Midpoint, 经验分布宽度模型)模拟秦岭两栖、爬行及其不同区系成分的物种丰富度格局(Colwell, 2008; 王襄平等, 2009). ...
... MDE单独解释秦岭两栖动物物种丰富度的海拔格局时解释力较高, 但对爬行动物的解释力较弱(表1), 进入5个最优回归模型(表2).在物种丰富度地理格局形成机制的解释的变量或模型选择中, MDE作为对其他环境因子解释的补充变量(Colwell et al., 2004). ...
Macroe- cology and extinction risk correlates of frogs
Elevational pattern of species richness in the Three Gorges Region of the Yangtze River: effect of climate, geometric constraints, area and topographical heterogeneity
2
2013
... 人们提出了各种假设解释物种多样性的海拔分布格局.其中, 种—面积关系、水分能量动态假设、中域效应应用较为普遍(池秀莲和唐志尧, 2011; 李巧燕和王襄平, 2013).水分能量动态假设(water- energy dynamic hypothesis, WED)认为, 物种多样性的地理分布格局是由水分和能量共同决定, 水分调节生物体对能量的利用过程(O’Brien, 1993, 1998).大量研究表明, 水分和能量是解释物种多样性地理格局的重要环境因子(Hawkins et al., 2003; Kreft & Jetz, 2007; de Oliveira & Diniz-Filho, 2010).相对其他脊椎动物类群, 两栖爬行动物的地理分布更容易受水分和能量的限制.其次, 取样面积也是影响物种多样性地理分布格局的重要因子.种—面积关系(species-area relationship, SAR)解释物种多样性随取样面积增加而增加的机制, 同时, 也反映了物种的空间周转率(Qiao et al., 2012).随取样面积的增加, 生境异质性和一定面积内获得的能量资源也增加, 从而孕育了更多的物种(Fraser & Currie, 1996; Báldi, 2008).中域效应模型(mid-domain effect, MDE)(也称边界效应)是基于物种即使在没有任何环境条件的限制下, 由于受物种分布边界的限制, 物种分布呈两端低中间高的钟形分布曲线(Colwell et al., 2004).自从中域效应提出之后, 边界限制是否对物种地理分布格局构成限制一直存在广泛的争议(Hawkins et al., 2005; Currie & Kerr, 2008).最近有研究表明, 边界限制和环境因子结合更能合理解释物种多样性的地理格局(Grytnes & Beaman, 2006; Wang & Fang, 2012). ...
... (2) 种-面积关系.该假说认为物种多样性随栖息地面积的增加成幂函数增长关系(Triantis et al., 2003).本文采用对数转化后的幂函数方程量化了面积对秦岭两栖、爬行动物及其不同区系成分的物种丰富度海拔格局的影响(池秀莲和唐志尧, 2011; 李巧燕和王襄平, 2013). ...
On the test of the Rapoport’s rule, algorithm comparison, and weakening of mid-domain effect: with a case study on the seed plants in Mt. Wuliang, Yunnan Province
Constraining null models with environmental gradients: a new method for evaluating the effects of environmental factors and geometric constraints on geographic diversity patterns
1
2012
... 人们提出了各种假设解释物种多样性的海拔分布格局.其中, 种—面积关系、水分能量动态假设、中域效应应用较为普遍(池秀莲和唐志尧, 2011; 李巧燕和王襄平, 2013).水分能量动态假设(water- energy dynamic hypothesis, WED)认为, 物种多样性的地理分布格局是由水分和能量共同决定, 水分调节生物体对能量的利用过程(O’Brien, 1993, 1998).大量研究表明, 水分和能量是解释物种多样性地理格局的重要环境因子(Hawkins et al., 2003; Kreft & Jetz, 2007; de Oliveira & Diniz-Filho, 2010).相对其他脊椎动物类群, 两栖爬行动物的地理分布更容易受水分和能量的限制.其次, 取样面积也是影响物种多样性地理分布格局的重要因子.种—面积关系(species-area relationship, SAR)解释物种多样性随取样面积增加而增加的机制, 同时, 也反映了物种的空间周转率(Qiao et al., 2012).随取样面积的增加, 生境异质性和一定面积内获得的能量资源也增加, 从而孕育了更多的物种(Fraser & Currie, 1996; Báldi, 2008).中域效应模型(mid-domain effect, MDE)(也称边界效应)是基于物种即使在没有任何环境条件的限制下, 由于受物种分布边界的限制, 物种分布呈两端低中间高的钟形分布曲线(Colwell et al., 2004).自从中域效应提出之后, 边界限制是否对物种地理分布格局构成限制一直存在广泛的争议(Hawkins et al., 2005; Currie & Kerr, 2008).最近有研究表明, 边界限制和环境因子结合更能合理解释物种多样性的地理格局(Grytnes & Beaman, 2006; Wang & Fang, 2012). ...
The mid-domain effect hypothesis: models, evidence and limitations
1
2009
... (3) 中域效应.该假说认为物种丰富度受分布边界限制的影响, 呈两边低、中间高的单峰分布格局(Colwell et al., 2004).本研究将秦岭两栖、爬行动物及其不同区系成分的物种分布宽度为模拟区域, 物种数作为不同的随机抽样样本量, 采用RangeModel程序中的模型5(Empirical Frequency Distribution, Random Midpoint, 经验分布宽度模型)模拟秦岭两栖、爬行及其不同区系成分的物种丰富度格局(Colwell, 2008; 王襄平等, 2009). ...
Altitudinal patterns of seed plant richness in the Gaoligong Mountains, south-east Tibet, in China’s mountains
1
2007
... 物种丰富度沿环境梯度的变化格局及其成因机制一直是生态学研究中的重要议题(Wang et al., 2007).关于物种丰富度大尺度地理格局的研究主要集中在两个方面, 即不同格局的描述和形成其格局的解释.本研究通过对秦岭两栖、爬行动物及其不同区系成分的物种丰富度的海拔梯度格局的研究结果表明, 除两栖动物广布种外, 均呈单峰分布格局, 但峰值分布的海拔段有所差异, 两栖动物物种丰富度峰值接近中海拔段, 爬行动物则在低海拔段.我们的研究结果支持Rahbek(1995)、McCain和Grytnes(2010)的观点, 即单峰分布格局最为普遍.秦岭两栖、爬行动物及其不同区系成分的物种丰富度海拔梯度格局与秦岭地区太白山、牛背梁植物物种丰富度海拔梯度格局相一致(唐志尧和柯金虎, 2004; 池秀莲和唐志尧, 2011).另外, 横断山脉蛙类、蜥蜴类、蛇类的海拔分布及其棘蛙在其整个分布区的海拔分布都为单峰分布格局(Fu et al., 2006, 2007; Hu et al., 2011). ...
Understanding global patterns in amphibian geographic range size: does Rapoport rule
 , 孙呈祥, 李晓军, 李万江


