


半个世纪前, 生态学家R. H. Whittaker开创性地提出物种多样性有3个不同的侧面或水平: (1) alpha多样性(alpha diversity or α diversity), 即特定立地或群落的物种丰富度; (2)beta多样性(beta diversity or β diversity), 即群落组成变化的幅度; (3)gamma多样性(gamma diversity or γ diversity), 即多个群落的物种多样性(Whittaker, 1960)。alpha多样性和gamma多样性具有相同的特征, 只是应用的尺度不同, 而尺度是相对的, 因此可将二者合称为编目多样性(inventory diversity)(Jurasinski et al., 2009)。beta多样性对于许多生态学和进化生物学问题都非常重要, 比如多样性的尺度推衍(Blackburn & Gaston, 1996; Lennon et al., 2001)、生物地理区及其过渡带的划分(Williams, 1996; Williams et al., 1999)和区域性动植物区系的形成机制(Moritz et al., 2001; van Rensburg et al., 2004; Graham et al., 2006)等。由于beta多样性度量了不同区域间物种组成的差异, 其信息也可用于保护区选址和保护区网络设计(Pimm & Gittleman, 1992; Pressey et al., 1993; Margules & Pressey, 2000; Jacquemyn et al., 2007)。例如, 在beta多样性非常高的区域, 保护区的面积要足够大以囊括物种转换(species turnover)梯度, 或者与其他保护区尽量接近, 以包含物种组成的变化(Nekola & White, 2002; Wiersma & Urban, 2005; 李振基等, 2006; Li et al., 2009)。此外, 因为环境梯度变化剧烈或存在山脉等扩散障碍, beta多样性高的区域对全球气候变化也可能会比较敏感(Gaston et al., 2007a)。
与编目多样性一样, beta多样性也是物种时空分布格局的一种表现形式, 并且受到一些决定物种分布的进化过程和生态过程的影响, 包括物种进化、生态位分化、竞争、扩散以及这些过程所在的物理环境和生物演化历史(Nekola & White, 1999)。虽然决定beta多样性和编目多样性的过程有一定的相似之处, 但是仍然需要更多的研究探明其具体形成机制。
在很长一段时间里, 学者们主要关注编目多样性, 直到最近十多年来, beta多样性的相关研究才较快增加(图1)。因此, 我们对beta多样性的知识仍然不足。本文试图总结目前beta多样性研究的主要进展, 并尝试提出目前存在的问题和今后需要加强的方面。为此, 我们主要循着以下5个方面进行综述: (1)beta多样性的概念及其度量方式; (2)beta多样性的时空格局; (3)beta多样性的形成机制; (4)beta多样性在生物多样性保护中的应用; (5)未来beta多样性研究的热点问题。
图1
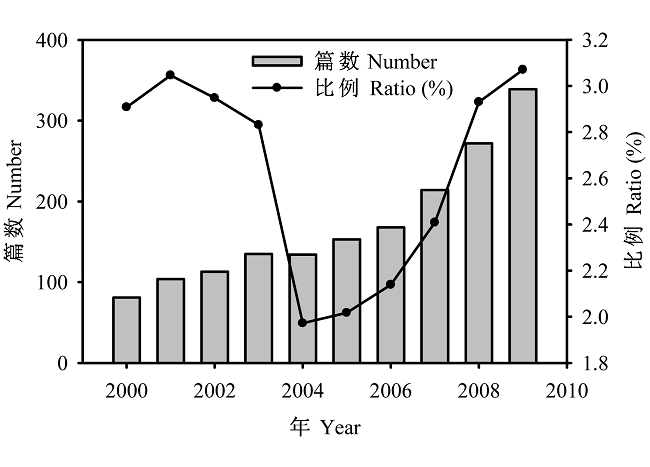
图1
2000-2009年间有关beta多样性研究论文的篇数及占生物多样性相关论文的比例(%)变化。分别以beta diversity/species turnover和biodiversity/biological diversity为主题词在ISI Web of Science进行检索(2010-06-24)。
Fig. 1
The number and ratio of beta diversity papers to biodiversity papers between years 2000-2009 based on the search from ISI Web of Science using “beta diversity/species turnover” and “biodiversity/biological diversity” as key words, respectively (2010-06-24).
1 beta多样性的概念及其度量
1.1 beta多样性概念的历史溯源
1960年, Whittaker首次定义了beta多样性, 即“与环境的复杂梯度或环境格局相联系的群落组成变化的幅度或群落分化的程度”(Whittaker,1960)。同时, 他提出了两种度量方法: 第一种即
同时代的MacArthur及其同事则将物种多样性分为生境内多样性(within-habitat diversity)和生境间多样性(between-habitat diversity), 其中, 生境间多样性即两个地点多样性间的差异, 也就是Whittaker所说的beta多样性(MacArthur, 1965)。MacArthur(1965)也提出了两个度量生境间多样性的方法, 其中之一实质上与Whittaker(1960)的
而Cody(1970)则从空间尺度及其决定因素方面扩展了beta多样性研究的视野, 将其从群落尺度延伸到地理尺度, 并且指出区域间物种组成的变化有两种情形: 距离很近的不同生境间和隔离甚远的相似生境间, 这对beta多样性形成机制的研究影响很大。同时, Cody提出一个新名词“turnover”(物种转换)来表示生境间多样性, 并被广泛应用。
20世纪70年代, Whittaker有关生物多样性组分(即alpha、beta和gamma)的概念和术语得到更多的关注(Whittaker, 1972)。Cody(1975)重新定义了beta和gamma多样性, 并特别强调gamma多样性的尺度比beta多样性更大。其中, beta多样性是在一个地理区域内沿着生境梯度物种转换的速率, 而gamma多样性是同一生境内随地理距离的物种转换速率。同时Cody(1975)提出了基于一定环境梯度上物种增加和丧失的beta多样性度量方法。Routledge(1977)则对Whittaker的
Wilson和Shmida(1984)提出了基于二元数据度量一定梯度上分化多样性的方法, 即beta turnover。同时基于4个标准, 即与群落物种转换概念的一致性、加和性、对alpha多样性的独立性和对取样单元大小的独立性, 对度量beta多样性的6个方法进行了评价, 结果表明beta turnover和
20世纪90年代, 有关beta多样性的研究迅速增加。有些学者提出, beta多样性还可以定义为种–面积曲线的斜率(Rosenzweig,1995; Ricotta et al., 2002)或区域与局域丰富度间的差异, 即加和分配(additive partitioning)(Lande, 1996)。另外, Williams (1996)、Poynton(1996)和Davis等(1999)运用beta多样性的地理格局进行了生物地理区的划分, Harrison等(1992)检验了不同生物类群的扩散能力对其beta多样性的影响, Herwitz等(1996)和Arnott等(1999)对时间尺度上的群落物种变化进行了研究。
进入21世纪以后, beta多样性研究得到更多的重视, 并且研究的范围与深度都有不同程度的增加。同时, 各种度量beta多样性的新方法相继被提出。如Legendre等(2005)提出用群落组成数据表的总方差作为beta多样性的度量方法; Anderson等(2006)认为可以用单个取样点与多元空间中心点的平均差异表示beta多样性; Bacaro等(2007)提出的方法不仅考虑了物种水平的相似性, 而且也包括更高分类级别上的信息; Ricotta和Marignani(2007)的基于劳氏二次熵(Rao’s quadratic entropy)的方法则能够同时度量各个样方之间和一系列样方之间物种组成的变化; Jost(2007)则将gamma多样性区分为互相独立的alpha多样性和beta多样性; Baselga (2010)将beta多样性区分为巢式部分(nestedness components)和物种转换部分(turnover components)。beta多样性研究的生态系统和类群也更加多样, 从陆地到海洋, 从大型的动植物到水生生物和微生物, 研究尺度从局域到全球, 同时研究手段也越来越多样化。
1.2 beta多样性的度量方法
据不完全统计, 目前, beta多样性度量方法大约有40种之多, 分别从不同的角度对物种组成在时空尺度上的变化进行评价, 但是它们的使用频率却差异很大。
最近, Jurasinski等(2009)提出了一个比较简洁的物种多样性度量方法分类体系。首先他们将alpha多样性和gamma多样性合称编目多样性; 而beta多样性度量方法则可分为两类在概念上不同的类型: 一类是分化多样性(differentiation diversity), 考虑物种的具体组成, 比较不同地点的相似性, 如相似性系数、相似性随距离衰减斜率、排序空间的梯度长度(gradient length in ordination space)和群落组成数据表的总方差; 另一类是比例多样性(proportional diversity), 比较不同尺度上物种丰富度(或其他多样性指数)的差异, 如加和分配(additive partitioning)和倍性分配(multiplicative partitioning)。涉及到的主要度量方法简介如下:
(1)倍性分配方法, 即
(2)加性分配方法, 即β = γ-α。可以在多个尺度上, 将总的生物多样性(gamma)分解为样方内(alpha)和样方间(beta)的多样性。由于加性分配用同样的单位度量alpha和beta多样性, 所以它们的相对重要性很容易得以量化和解释, 便于比较不同时空尺度和土地利用方式间alpha和beta多样性的差异(Crist & Veech, 2006)。
(4)相似性随距离衰减斜率。Whittaker在1960年就已提出, 但在最近10年间又重新得到重视(Condit et al., 2002; Green et al., 2004; Qian et al., 2005, 2009; Soininen et al., 2007; Qian, 2009a)。相似性随空间距离增加而减小得越快, 即斜率的绝对值越大, 则代表beta多样性越高。其优点是便于不同生态系统和生物类群间的比较。Soininen等(2007)对相似性随距离衰减的现象进行了系统总结。Morlon等(2008)从理论角度分析了相似性随距离衰减的形成原因。最近, Korhonen等(2010)将此方法扩展到时间尺度。
(5)群落组成数据表的总方差。Legendre等(2005)提出以群落组成数据表的总方差作为beta多样性的度量, 并将可解释的总方差分解为环境和空间因子的独立作用和交互作用, 以此检验生态位过程和扩散过程的相对重要性。
基于这一分类体系, 我们以“beta diversity”或“species turnover”为关键词在ISI “Web of Science”中检索论文题目(2010-06-24), 得到302篇文献, 对158篇能获得全文的文献的发表时间和度量方法进行总结(图2)。结果显示, 分化多样性相关度量方法应用125次, 而比例多样性相关方法应用了47次; 其中相似性(resemblance)方法最多(48.8%), 其次是倍性分配方法(15.1%)。
图2
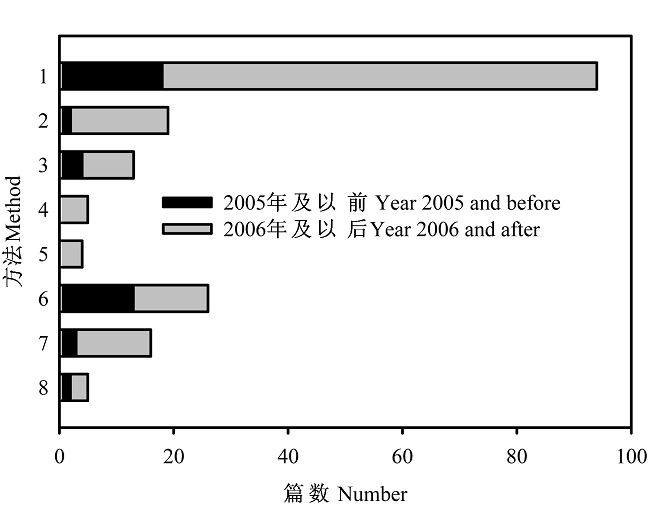
图2
不同beta多样性度量方法应用的论文篇数。(1) 相似性; (2) 排序空间的梯度长度; (3) 相似性随距离衰减斜率; (4) 群落组成数据表的总方差; (5) 排序空间的多元离散度量; (6) 倍性分配; (7) 加性分配; (8) 种面积曲线斜率。
Fig. 2
Number of papers in the literature which use different measures of beta diversity. (1) Resemblance; (2) Gradient length in ordination space; (3) Slope of distance decay relationship; (4) Sum of squares of species matrix; (5) Multivariate dispersion in ordination space; (6) Multiplicative partitioning; (7) Additive partitioning and (8) Slope of species area curve.
在相似性方法中, Jaccard指数应用次数最多(37.6%), 其余依次为Sørensen指数(25.9%)、Simpson指数(21.2%)和Bray-Curtis指数(15.3%)(图3)。2005年及以前分化多样性应用次数比例占58.8%, 到2006年及以后增加到77.1%; 而比例多样性应用次数比例则从41.5%降低到22.9%(图2)。在相似性方法中, 2001-2005年间Simpson指数和Sørensen指数应用次数比例分别为13.3%和20.0%, 到2006-2010年间分别增加到21.9%和26.6%; 而Jaccard和Bray- Curtis指数应用次数比例分别从46.7%和20.0%降低到37.5%和14.1%(图3)。这一变化表明, 随着对beta多样性概念及其度量方法的理解不断深入, 生态学家对指数的选择也相应地发生变化。
图3
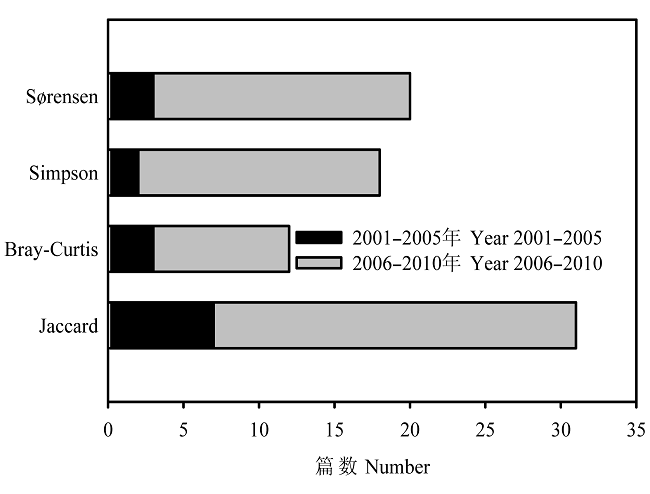
图3
4个主要相似性系数的应用篇数
Fig. 3
Number of papers in the literature which use Sørensen, Simpson, Bray Curtis and Jaccard as the measures of similarity
此外, 一些有影响力的评论文章和新的beta多样性度量方法的提出, 可能对将来beta多样性研究产生深远的影响。Jost(2007)认为目前的beta多样性定义使得其数值依赖alpha样性, 因此难以进行区域间beta多样性比较。他提出将多样性分解为相互独立的alpha和beta多样性组分, 并发展了具体的度量方法, 认为对gamma多样性的倍性分解才是真正的beta多样性, 才适用于区域间beta多样性比较。基于这一分解方法和有效物种数概念(effective number of species) (MacArthur, 1965; Hill, 1973; Jost, 2006), Tuomisto(2010a, b)对beta多样性的定义和众多度量方法进行了非常系统的总结。
最近几年, 又有学者从系统发育的角度提出系统发育beta多样性(phylogenetic beta diver/phylobetadiversity), 以度量不同区域物种库共有进化历史的长短(Graham & Fine, 2008), 主要指数有PD dissimilarity(phylogenetic diversity dissimilarity) (Ferrier et al., 2007)、UniFrac指数(Lozupone & Knight, 2005)和系统发育Sørensen指数(phylogen- etic Sørensen index) (Bryantet al., 2008)。另外, Ackerly和Cornwell (2007)从功能性状的角度, 提出功能beta多样性(functional beta diversity), 并给出了度量方法。
2 beta多样性的时空格局
了解beta多样性的时空格局能为回答许多生态学、生物地理学和进化生物学问题提供重要线索, 并且为生物多样性保护和生态系统管理提供有用的信息。几百年来, 博物学家和分类学家对世界各地的许多现存类群和化石类群进行调查、记录和编目, 为分析beta多样性的时空格局提供了翔实的数据。同时对beta多样性概念理解的深入和度量方法的发展, 也使我们能够对beta多样性进行更准确的描述和分析。
2.1 beta多样性的空间尺度依赖性
尺度(scale)是生态学中的一个重要概念, 深刻影响着人们对生态学现象的认识和描述。一般来说, 尺度包涵3个层次的含义: 范围(extent), 即整个研究区域的长度、面积或体积; 粒度(grain), 或分辨率, 即生态学现象发生的基本单元或取样单元; 间隔(lag), 即生态学过程单元或取样单元间的距离(Dungan et al., 2002)。目前在地理尺度上, 学者们主要关注分析粒度对beta多样性的影响。
beta多样性一般随分析粒度的增加而降低(Lennon et al., 2001; Arita & Rodríguez, 2002; Qian, 2009b)。如英格兰鸟类beta多样性随粒度加大而降低, 并且不同分辨率之间的beta多样性不存在显著的相关性(Lennon et al., 2001)。Arita和Rodríguez (2002)对墨西哥哺乳动物beta多样性的研究也发现相似的格局。另外, 不同类群beta多样性格局对分辨率的反应也有所不同, 这与它们的生物学特征有一定的关系(Mac Nally et al., 2004)。因此, 研究beta多样性必须与一定的空间分辨率联系起来。
2.2 beta多样性的纬度梯度
许多研究试图检验beta多样性和纬度间的关系(Kollef et al., 2003b; Gaston et al., 2007a), 但是结果却非常不一致。Kollef等(2003b)总结了早期13项研究中的15例beta多样性与纬度间的关系, 其中7例表明beta多样性与纬度间呈负相关, 即beta多样性在热带高而在高纬度地区低; 6例表明beta多样性与纬度没有明显关系; 2例早期研究发现beta多样性在高纬度地区反而高(Kollef et al., 2003b)。这些研究结果的不统一可能是由于研究的类群(如植物和动物)、尺度和生物地理区域的不同导致的。但不可忽视的是, 分析方法的不同也是重要原因, 特别是计算beta多样性的方法。比如, 这些研究中有的比较纬度梯度上连续分布的两个区域, 有的比较同一纬度梯度内的不同区域, 还有的则比较某一区域与其相邻的其他8个区域, 这3种分析方法的结果可能完全不同(Kollef et al., 2003b)。
2.3 不同类群及分类级别间beta多样性在空间上的一致性
不同物种类群间的beta多样性空间格局具有一定的一致性, 但会随着生物地理区不同而变化。如McKnight等(2007)的研究表明, 南北美洲的两栖动物、哺乳动物和鸟类在beta多样性高的区域具有很高的类群间一致性, 而在beta多样性低的区域, 类群间一致性较低。Melo等(2009)的研究同样表明这一点。这说明不同区域的beta多样性形成机制存在类群间差异。如在中国东部季风区, 不同的动植物类群间beta多样性(以1-Jaccard度量)呈显著正相关, 种子植物和鸟类间相关性最强, 而在两栖动物和鸟类间最弱(陈圣宾, 未发表数据)。另外有些研究表明不同的分类级别间(科、属和种)beta多样性也存在一致性, 但分类级别越高, beta多样性越低(Qian & Ricklefs, 2007; Terlizzi et al., 2009; Qian, 2009b)。如Qian(2009b)对全球主要陆栖脊椎动物类群beta多样性的比较表明, 物种水平的beta多样性是属水平的1.24倍, 是科水平beta多样性的1.85倍, 而属水平的beta多样性是科水平的1.50倍。而且, 分类级别越高, 对低分类级别beta多样性的预测能力越低, 如Prinzing等(2003)对肯尼亚树木的研究。如果能在更多的类群中发现不同分类级别beta多样性的一致性, 将为研究一些编目数据不足的类群提供方便。
在同一区域, 不同类群间的beta多样性也存在一定的差异。一般而言, 扩散能力强的类群beta多样性较低, 或者说beta多样性与扩散能力间存在一定程度的负相关(Nekola & White, 1999; Steinitz et al., 2006; Qian, 2009a, b)。在北美, 扩散能力较弱的维管植物相似性随距离降低的速率是扩散能力强的苔藓植物的1.5-1.9倍(Nekola & White, 1999); 而在以色列, 鸟类相似性随距离降低的速率低于蜗牛, 且个体小的蜗牛低于个体大的蜗牛(Steinitz et al., 2006); Qian(2009a)则证明了在北美的各个纬度梯度上蕨类植物的beta多样性均低于种子植物。在全球尺度上, 温血动物(鸟类和哺乳类)的beta多样性低于冷血动物(爬行类和两栖类)(Buckley & Jetz, 2008; Qian, 2009b)。Soininen等(2007)通过对大量数据整合分析, 认为个体大小、营养级和扩散方式都会影响beta多样性。比如, 通过种子传播的物种beta多样性最高, 被动传播的物种最低, 营养级越高beta多样性越高。
2.4 时间尺度上的beta多样性
随着时间推移, 自然环境和人为因素均发生改变, 从而影响种群动态、种间关系和物种进化, 导致一定区域内物种组成在时间序列上发生变化。这种变化可以发生在不同的地质历史时期之间、年际间和季节间, 甚至几小时内(如微生物群落)。另外, 由于物种进化、扩散和灭绝的影响, 空间尺度上的beta多样性同样会随地质历史时期不同而改变。
空间上的beta多样性在不同时间尺度随时间推移发生不同的变化。在全球尺度上, 由于物种分化和环境选择的作用, 古生代(特别是奥陶纪)区域间beta多样性随时间推移显著增加, 并且能部分地解释此地质历史时期全球物种丰富度的大幅度上升(Sepkoski, 1988)。而在历史尺度上, 伴随着气候变化和人类活动增加, 物种在不同大陆和地区间的迁移导致空间beta多样性随时间推移而降低, 即生物同质化(biotic homogenization)(McKinney, 2006; Qian & Ricklefs, 2006; 王光美等, 2009)。如在北美, 外来物种增加了各个区域间物种组成的相似性, 即beta多样性降低(Qian & Ricklefs, 2006)。
Korhonen等(2010)对水生生态系统物种在时间尺度上的转换(即beta多样性)进行了全面分析, 发现研究的时间范围是影响时间尺度物种转换的重要因素, 即时间范围越短, 物种转换越快。不同的生态系统中物种转换速率也不相同, 湖泊比河流和海洋的物种转换速度快。在地理尺度上, 年内物种转换与纬度呈负相关, 而年际间物种转换与纬度呈正相关。另外,物种的个体越大, 转换速度越慢。
3 beta多样性的形成机制
最初, beta多样性概念的提出是为了反映环境梯度上物种组成的变化(Whittaker, 1960; MacArthur, 1965), 其前提是物种各有不同的生态位, 生境改变导致物种组成也发生相应的变化, 此即生态位过程。距离越远, 则环境差异越大, 因此物种组成相似性也越低。但Cody(1970)发现环境梯度不能完全解释物种组成的差异, 如生境虽然相似但距离很远, 物种组成仍然差别很大。20世纪80年代, 学者们开始注重分析beta多样性的形成机制, 如Shmida和Wilson(1985)认为beta多样性主要决定于生境多样性和质量效应。而Cody(1986)则注意到空间距离、地理隔离和物种稀有性对beta多样性的影响。
最近的10多年来, 人们对beta多样性的形成机制有了更深刻的理解。如中性理论(neutral theory)假设物种具有相同的生物学特征, 其分布只受扩散过程的影响, 也能预测物种相似性随空间距离增大而降低的格局(Hubbell, 2001; Bell, 2001)。因此, beta多样性的形成可能不单是生态位过程或扩散过程的作用, 而是两个生态学过程综合效应的结果(Harrison et al., 1992; Gaston et al., 2007b; Soininen et al., 2007; Legendre et al., 2009)。目前, 在不同尺度上, 检验这两个过程在驱动不同类群beta多样性形成中的相对重要性, 成为研究的热点问题。
3.1 扩散过程和生态位过程及其检验手段
生态位过程假设物种对环境的适应特征影响它们分布区域的范围; 由于不同的物种进化出不同的适应性, 在环境梯度上, 物种组成就会发生改变。因此, 两个区域间物种组成的差异即beta多样性与它们之间的环境差异呈正相关, 或者说beta多样性能够更好地为环境因子解释。在此前提下, 如果物种间以及物种和环境间相互作用的尺度均发生了改变, 就可能引起beta多样性空间格局的变化(Loreau, 2000)。
相比而言, 扩散过程则是另外一种情形, 它认为物种的分布完全是由扩散能力决定的, 即单个物种的分布会趋向集中。扩散能力越弱, 则物种分布越集中, beta多样性越高(Ney-Nifle & Mangel, 1999; Bell, 2001; Green & Ostling, 2003)。另外, 从局域和区域间物种丰富度的关系也可以得出这样的结论: 假设一定区域内的物种数一定, 则聚集度越高, 局域物种丰富度越低, 因此beta多样性越高(Veech et al., 2003)。扩散过程预测beta多样性与两个区域间的空间距离呈正相关。但是注意到区域间的环境差异与其空间距离之间具有很强的共线性, 最大的可能是两个过程共同影响beta多样性。
目前研究beta多样性形成机制的多元分析方法主要有两类, 其中一类是将不同物种在各个取样点的分布数据表视为一系列环境变量和空间变量的函数, 进而进行典范分析(canonical analysis)和方差分解(variation partitioning), 区分生态位过程和扩散过程的相对重要性(Legender et al., 2005)。典范分析可以称作“原始数据方法”, 因为分析所用的数据是原始数据表, 比如物种在每一研究地点的存在与否或丰度、环境因子和空间坐标。另外一类是以各个研究地点物种组成的相似性矩阵为应变量, 相应地点间的空间距离和环境差异为自变量, 然后运用Mantel检验和方差分解的方法区分扩散过程和生态位过程的相对重要性(Duivenvoordenet al., 2002, Tuomisto et al., 2003; Tuomisto & Ruokolainen, 2006)。这种方法可以称作“距离方法”, 因为自变量和应变量都是基于原始数据的距离矩阵。虽然目前对如何应用合适的统计分析手段研究beta多样性还存在争议(Legenderet al., 2005, 2008; Tuomisto & Ruokolainen, 2006, 2008; Pélissieret al., 2008; Laliberté,2008), 但这两种方法都已被广泛地应用在beta多样性研究中。在地理尺度上, 距离方法得到更为普遍的应用, 而在群落层次上, 更多学者采用原始数据方法。
3.2 扩散过程和生态位过程的相对重要性
3.2.1 研究尺度的影响
目前, 关于生态位和扩散过程相对重要性对尺度依赖性的专门报道较少, 但是综合已有的一些研究, 我们可以初步推论, 随着研究粒度增加(或者说分辨率降低), 生态位的重要性逐渐增加, 而扩散过程的重要性逐渐降低。Legendre等(2009)对古田山亚热带森林群落的分析表明, 随着粒度增加(从10 m×10 m到50 m×50 m), 生态位过程的相对重要性逐渐增加, 而扩散过程的相对重要性逐渐降低, 而且扩散过程的重要性总是大于生态位过程。Laliberté等(2009)对温带森林林下幼苗丰度的研究也表明, 在大尺度上幼苗丰度主要受环境因子制约, 而小尺度上主要受空间过程影响。很多地理尺度的beta多样性研究大都表明生态位过程能解释更多的物种组成的变化。如Tuomisto等(2003)对亚马逊流域西部的热带森林群落(500 m×5 m)的研究表明, 环境作用比生态位过程更好地解释了不同群落间树木组成的变化。当然, 我们的推论还需更多实际研究案例的进一步检验, 特别是在地理尺度上。
但是, 随着研究范围的增大, 扩散过程和生态位过程的相对重要性如何变化, 目前的研究结论还不一致(Condit et al., 2002; Tuomisto et al., 2003; Normand et al., 2006; Steinitz et al., 2006)。对热带雨林的研究表明生态位过程的作用随研究范围的增大而增加(Condit et al., 2002; Tuomisto et al., 2003; Normand et al., 2006), 而对西亚干旱区鸟类和蜗牛的研究则显示生态位过程的作用随研究范围增加而降低(Steinitz et al., 2006)。这可能与研究类群的不同和具体区域环境的差异有关, 需要对多个类群在不同尺度范围进行检验, 才能得出更一般性的 结论。
3.2.2 地理区域的影响
由于地质历史、生物进化历史和具体环境的不同, 不同地理区域的beta多样性形成机制也有一定的差异。如Qian和Ricklefs(2007)及Qian等(2009)对北美维管植物和哺乳动物的研究均表明, 生态位过程和扩散过程的相对重要性随纬度不同而变化, 在低纬度地区, 主要是生态位过程的作用, 而在高纬度地区, 扩散过程更为重要; 并且总体而言, beta多样性主要决定于扩散限制, 而气候和海拔等环境因素的作用较小。而在中国东部, 动植物beta多样性形成主要受环境的影响, 扩散过程的作用相对北美要小(Chen et al., 未发表数据)。这可能与发生在北美的最后一次冰期有着密切的关系。这次冰期发生在大约1.8万年前, 覆盖了北美北部的大部分地区, 此地区的大部分物种都是在冰期结束后从南部扩散而来。因此物种分布与环境之间并未达到平衡, 特别是在高纬度地区。这也就是说北美的动植物区系仍然处于向北扩散的过程之中(Qian et al., 2005, 2009; Qian & Ricklefs, 2007)。而中国在最后一次冰期中只有高海拔地区覆被冰盖, 对动植物分布的影响相对较小。可以说, 相比北美, 中国东部目前的物种分布与环境之间更为平衡。这也是东亚动植物区系比北美更为丰富的原因之一(Qian et al., 2005, 2009; Qian & Ricklefs, 2007)。
3.2.3 物种类群间的差异
各个生物类群具有不同的进化历史和生物学特征, 因此它们的beta多样性形成机制也可能不同。扩散能力是影响物种分布的重要因素, 扩散能力越强的类群, 越有可能占据所有适宜的生境, 因此, 其分布则可能更多地受到生态位过程的限制。这也被一些研究所证实, 如Linares-Palomino和Kessler (2009)对玻利维亚安第斯山脉季节性干旱森林的研究表明, 扩散能力差的一些种子植物类群的beta多样性能更好地被空间距离所解释, 而蕨类植物扩散能力较强, 能够较好地被生境差异所解释。在亚马逊西部的热带森林中, 相比野牡丹科植物, 蕨类植物组成的变化同样能更好地为环境因子所解释(Tuomisto et al., 2003)。但是, 生物类群的进化地位与其beta多样性的形成机制间的关系还不清楚。
4 beta多样性在生物多样性保护中的应用
为了保护更多的生物多样性, 在选择保护区域及其面积的时候, 必须考虑它们的互补性、灵活性和不可替代性(Pressey et al., 1993; Margules & Pressey, 2000)。这些原则都与beta多样性有一定的关系, 如一个地区相对现有保护系统的互补性越高, 表明此区域的beta多样性越高, 保护价值亦大。如何利用beta多样性的信息来更有效地选择合适区域以保护尽可能多的物种, 是保护生物学的重要问题(Pimm & Gittleman, 1992; Pressey et al., 1993; Margules & Pressey, 2000; Sarkar, 2006)。
在beta多样性非常高的区域, 需要增加保护区的面积或者数量以囊括物种变化梯度, 而在beta多样性降低的区域, 只需要较少数量或面积的保护区(Kattan et al., 2005)。但是由于类群间beta多样性的差异, 根据某一类群制定的保护规划或许不能很好地保护其他类群的多样性。如两栖动物的beta多样性较高, 如果根据beta多样性低的哺乳动物和鸟类选择少数几个保护区就不能有效地保护两栖动物的多样性(Vasudevan et al., 2006)。在资料不够充分的情况下, 我们一般采取替代类群如旗舰种代表其他类群的多样性, 进行保护区的规划布局。但在检验替代类群的有效性时, 若仅分析类群间物种丰富度或者稀有性的相关性是不够的, 类群间beta多样性格局的一致性才能提供更可靠的信息(Pinto et al., 2008)。李振基等(2006)建议在相邻的保护区间物种组成差异(即beta多样性)较大时, 选择它们之间的一定区域进行保护, 以更好地包含物种分布在空间上的连续性。目前已有成功的案例利用beta多样性的信息指导保护区的位置选择和空间布局。如在加拿大的育空地区(Yukon), 根据哺乳动物beta多样性的空间信息, 仅在每个生态区内选择一个区域, 就可以保护所有的哺乳动物(Wiersma & Urban, 2005)。
5 研究展望
虽然在最近10多年来, 很多学者对许多地区不同类群的beta多样性的格局及其形成机制进行了深入的研究, 但仍然不能很好地构建beta多样性的知识体系。而且, beta多样性与许多生态学规律和现象有着密切的联系, 如种–面积曲线、种库关系、物种多样性空间格局和物种分布范围的大小等; 另外, 多年的生物多样性编目工作积累了大量数据, 提供了很好的研究机遇。因此, 很有必要在更广阔的时间和空间尺度上, 从进化生物学、生物地理学、群落生态学、保护生物学和生态系统管理的角度, 研究beta多样性的时空格局及其机制, 增加对生物多样性的理解和满足生态系统管理的需要。特别地, 我们认为以下几个方面的问题可能是今后beta多样性研究的热点问题:
(1) 不同生物类群的进化历史和生物学特征对beta多样性的影响。进化历史和当前的生物和非生物环境共同决定了物种的分布格局, 因此对不同的生物类群进行比较研究, 可以为理解beta多样性提供非常有用的线索。
(2) 不同的时空尺度对beta多样性的影响。任何一个生态学现象都是与一定的时空尺度相联系的, beta多样性也不例外。beta多样性及其机制在不同的时空分辨率下的表现形式和变化趋势, 有助于预测全球变化背景下生物多样性的变化及提出相应保护对策。
(3) 人类活动对beta多样性的影响。人类干扰在增加不同生态系统中外来物种比例的同时, 也使得许多本土物种在局域或区域尺度上灭绝, 从而导致生物同质化, 即beta多样性的丧失。理解人类干扰的方式和强度对beta多样性的影响, 对生物多样性评价和保护有着重要意义。
致谢
三位审稿专家对本文的初稿提出建设性修改意见, 中国科学院植物研究所的邵长亮博士和毛岭峰博士对修改稿提出建议, 在此表示感谢!
参考文献
A trait-based approach to community assembly: partitioning of species trait values into within- and among-community components
DOI:10.1111/j.1461-0248.2006.01006.x
URL
PMID:17257101
[本文引用: 1]

Plant functional traits vary both along environmental gradients and among species occupying similar conditions, creating a challenge for the synthesis of functional and community ecology. We present a trait-based approach that provides an additive decomposition of species' trait values into alpha and beta components: beta values refer to a species' position along a gradient defined by community-level mean trait values; alpha values are the difference between a species' trait values and the mean of co-occurring taxa. In woody plant communities of coastal California, beta trait values for specific leaf area, leaf size, wood density and maximum height all covary strongly, reflecting species distributions across a gradient of soil moisture availability. Alpha values, on the other hand, are generally not significantly correlated, suggesting several independent axes of differentiation within communities. This trait-based framework provides a novel approach to integrate functional ecology and gradient analysis with community ecology and coexistence theory.
Multivariate dispersion as a measure of beta diversity
Geographic range, turnover rate and the scaling of species diversity
Interannual variability and species turnover of crustacean zooplankton in Shield lakes
Measuring beta-diversity from taxonomic similarity
Partitioning the turnover and nestedness components of beta diversity
The distribution of bird species in the New World: patterns in species turnover
Microbes on mountainsides: contrasting elevational patterns of bacterial and plant diversity
DOI:10.1073/pnas.0801920105 URL [本文引用: 1]
Linking global turnover of species and environments
A new statistical approach for assessing similarity of species composition with incidence and abundance data
On resemblance measures for ecological studies, including taxonomic dissimilarities and a zero-adjusted Bray-Curtis coefficient for denuded assemblages
DOI:10.1016/j.jembe.2005.12.017 URL [本文引用: 1]
Towards a theory of continental species diversities:bird distributions over Mediterranean habitat gradients
In:
Diversity, rarity, and conservation in Mediterranean-climate ecosystems
Beta-diversity in tropical forest trees
DOI:10.1126/science.1066854
URL
PMID:11809969
[本文引用: 3]
The high alpha-diversity of tropical forests has been amply documented, but beta-diversity-how species composition changes with distance-has seldom been studied. We present quantitative estimates of beta-diversity for tropical trees by comparing species composition of plots in lowland terra firme forest in Panama, Ecuador, and Peru. We compare observations with predictions derived from a neutral model in which habitat is uniform and only dispersal and speciation influence species turnover. We find that beta-diversity is higher in Panama than in western Amazonia and that patterns in both areas are inconsistent with the neutral model. In Panama, habitat variation appears to increase species turnover relative to Amazonia, where unexpectedly low turnover over great distances suggests that population densities of some species are bounded by as yet unidentified processes. At intermediate scales in both regions, observations can be matched by theory, suggesting that dispersal limitation, with speciation, influences species turnover.
Additive partitioning of rarefaction curves and species-area relationships: unifying α-, β- and γ-diversity with sample size and habitat area
Species turnover, community boundaries and biogeographical composition of dung beetle assemblages across an altitudinal gradient in South Africa
Beta diversity in tropical forests
A balanced view of scale in spatial statistical analysis
Host specificity of Lepidoptera in tropical and temperate forests
DOI:10.1038/nature05884
URL
PMID:17687325
[本文引用: 1]
For numerous taxa, species richness is much higher in tropical than in temperate zone habitats. A major challenge in community ecology and evolutionary biogeography is to reveal the mechanisms underlying these differences. For herbivorous insects, one such mechanism leading to an increased number of species in a given locale could be increased ecological specialization, resulting in a greater proportion of insect species occupying narrow niches within a community. We tested this hypothesis by comparing host specialization in larval Lepidoptera (moths and butterflies) at eight different New World forest sites ranging in latitude from 15 degrees S to 55 degrees N. Here we show that larval diets of tropical Lepidoptera are more specialized than those of their temperate forest counterparts: tropical species on average feed on fewer plant species, genera and families than do temperate caterpillars. This result holds true whether calculated per lepidopteran family or for a caterpillar assemblage as a whole. As a result, there is greater turnover in caterpillar species composition (greater beta diversity) between tree species in tropical faunas than in temperate faunas. We suggest that greater specialization in tropical faunas is the result of differences in trophic interactions; for example, there are more distinct plant secondary chemical profiles from one tree species to the next in tropical forests than in temperate forests as well as more diverse and chronic pressures from natural enemy communities.
Using generalized dissimilarity modeling to analyse and predict patterns of beta diversity in regional biodiversity assessment
Dragonfly community re-organisation in boreal forest lakes: rapid species turnover driven by climate change
Spatial turnover in the global avifauna
The scaling of spatial turnover:pruning the thicket
In:
Changes in the composition of British butterfly assemblages over two decades
Phylogenetic beta diversity: linking ecological and evolutionary processes across space in time
Habitat history improves prediction of biodiversity in rainforest fauna
Spatial scaling of microbial eukaryote diversity
Endemics-area relationships: the influence of species dominance and spatial aggregation
Beta-diversity on geographic gradients in Britain
Species turnover on a protected subtropical island: a long-term study
Diversity and evenness: a unifying notation and its consequences
Range size variation, nestedness and species turnover of orchid species along an altitudinal gradient on Réunion Island: implications for conservation
Partitioning diversity into independent alpha and beta components
DOI:10.1890/06-1736.1
URL
PMID:18027744
[本文引用: 2]
Existing general definitions of beta diversity often produce a beta with a hidden dependence on alpha. Such a beta cannot be used to compare regions that differ in alpha diversity. To avoid misinterpretation, existing definitions of alpha and beta must be replaced by a definition that partitions diversity into independent alpha and beta components. Such a unique definition is derived here. When these new alpha and beta components are transformed into their numbers equivalents (effective numbers of elements), Whittaker's multiplicative law (alpha x beta = gamma) is necessarily true for all indices. The new beta gives the effective number of distinct communities. The most popular similarity and overlap measures of ecology (Jaccard, Sorensen, Horn, and Morisita-Horn indices) are monotonic transformations of the new beta diversity. Shannon measures follow deductively from this formalism and do not need to be borrowed from information theory; they are shown to be the only standard diversity measures which can be decomposed into meaningful independent alpha and beta components when community weights are unequal.
Inventory, differentiation, and proportional diversity: a consistent terminology for quantifying species diversity
Spatial components of bird diversity in the Andes of Colombia: implications for designing a regional reserve system
Measuring beta diversity for presence-absence data
Are there latitudinal gradients in species turnover
A quantitative analysis of temporal turnover in aquatic species assemblages across ecosystems
DOI:10.1890/09-0392.1
URL
PMID:20392015
[本文引用: 2]
Recent meta-analyses have shown that beta diversity through space is jointly driven by species traits, geographical gradients, and ecosystem properties. Spatial variation is, however, only one aspect of beta diversity. The other component is variation in species assemblages through time, that is, temporal turnover. We examined the decrease of assemblage similarity in time in aquatic ecosystems in relation to several ecological, physical, and geographical factors using an extensive data set derived from the literature. The data set was first divided into intra-annual and interannual studies depending on the temporal extent of the studies. Sampling duration was one the most significant variables affecting the degree of temporal turnover, and we found that turnover was faster in studies with shorter temporal extent. Our results further suggested that the rate of temporal turnover increased with increasing ecosystem size, thus contradicting the general species-time-area relationship. Temporal turnover also varied among the ecosystem types: lake assemblages showed faster turnover than stream or marine assemblages in the interannual data set. We found that temporal turnover exhibited large-scale geographical variation, as there was a latitudinal gradient in turnover. Turnover was faster in the tropics in the intra-annual data set, but the pattern was reversed in the interannual data set, where turnover was faster at high latitudes. Finally, we found that the degree of temporal turnover was related to organism characteristics, as larger organisms with active mobility showed slower temporal turnover than smaller organisms. Our results suggest that the degree of species turnover in time is jointly driven by several ecological, physical, and geographical factors in aquatic ecosystems and that the turnover is not uniform across taxonomic groups. Our findings have important consequences for understanding how different biotic assemblages track temporal changes in the environment and how resilient assemblages are toward such changes.
Analyzing or explaining beta diversity? Comment
Assessing the scale-specific importance of niches and other spatial processes on beta diversity: a case study from a temperate forest
DOI:10.1007/s00442-008-1214-8
URL
PMID:19018575
[本文引用: 1]
Niche processes and other spatial processes, such as dispersal, may simultaneously control beta diversity, yet their relative importance may shift across spatial and temporal scales. Although disentangling the relative importance of these processes has been a continuing methodological challenge, recent developments in multi-scale spatial and temporal modeling can now help ecologists estimate their scale-specific contributions. Here we present a statistical approach to (1) detect the presence of a space-time interaction on community composition and (2) estimate the scale-specific importance of environmental and spatial factors on beta diversity. To illustrate the applicability of this approach, we use a case study from a temperate forest understory where tree seedling abundances were monitored during a 9-year period at 40 permanent plots. We found no significant space-time interaction on tree seedling composition, which means that the spatial abundance patterns did not vary over the study period. However, for a given year the relative importance of niche processes and other spatial processes was found to be scale-specific. Tree seedling abundances were primarily controlled by a broad-scale environmental gradient, but within the confines of this gradient the finer scale patchiness was largely due to other spatial processes. This case study illustrates that these two sets of processes are not mutually exclusive and can affect abundance patterns in a scale-dependent manner. More importantly, the use of our methodology for future empirical studies should help in the merging of niche and neutral perspectives on beta diversity, an obvious next step for community ecology.
Statistics and partitioning of species diversity and similarity along multiple communities
Analyzing beta diversity: partitioning the spatial variation of community composition data
Analyzing or explaining beta diversity? Comment
DOI:10.1890/07-0272.1 URL PMID:31766816 [本文引用: 1]
Partitioning beta diversity in a subtropical broadleaved forest of China
DOI:10.1890/07-1880.1
URL
PMID:19341137
[本文引用: 2]
The classical environmental control model assumes that species distribution is determined by the spatial variation of underlying habitat conditions. This niche-based model has recently been challenged by the neutral theory of biodiversity which assumes that ecological drift is a key process regulating species coexistence. Understanding the mechanisms that maintain biodiversity in communities critically depends on our ability to decompose the variation of diversity into the contributions of different processes affecting it. Here we investigated the effects of pure habitat, pure spatial, and spatially structured habitat processes on the distributions of species richness and species composition in a recently established 24-ha stem-mapping plot in the subtropical evergreen broad-leaved forest of Gutianshan National Nature Reserve in East China. We used the new spatial analysis method of principal coordinates of neighbor matrices (PCNM) to disentangle the contributions of these processes. The results showed that (1) habitat and space jointly explained approximately 53% of the variation in richness and approximately 65% of the variation in species composition, depending on the scale (sampling unit size); (2) tree diversity (richness and composition) in the Gutianshan forest was dominantly controlled by spatially structured habitat (24%) and habitat-independent spatial component (29%); the spatially independent habitat contributed a negligible effect (6%); (3) distributions of richness and species composition were strongly affected by altitude and terrain convexity, while the effects of slope and aspect were weak; (4) the spatial distribution of diversity in the forest was dominated by broad-scaled spatial variation; (5) environmental control on the one hand and unexplained spatial variation on the other (unmeasured environmental variables and neutral processes) corresponded to spatial structures with different scales in the Gutianshan forest plot; and (6) five habitat types were recognized; a few species were statistically significant indicators of three of these habitats, whereas two habitats had no significant indicator species. The results suggest that the diversity of the forest is equally governed by environmental control (30%) and neutral processes (29%). In the fine-scale analysis (10 x 10 m cells), neutral processes dominated (43%) over environmental control (20%).
The geographical structure of British bird distributions: diversity, spatial turnover and scale
Four ways towards tropical herbivore megadiversity
DOI:10.1111/j.1461-0248.2008.01155.x
URL
PMID:18248447
[本文引用: 1]
Most multicellular species alive are tropical arthropods associated with plants. Hence, the host-specificity of these species, and their diversity at different scales, are keys to understanding the assembly structure of global biodiversity. We present a comprehensive scheme in which tropical herbivore megadiversity can be partitioned into the following components: (A) more host plant species per se, (B) more arthropod species per plant species, (C) higher host specificity of herbivores, or (D) higher species turnover (beta diversity) in the tropics than in the temperate zone. We scrutinize recent studies addressing each component and identify methodological differences among them. We find substantial support for the importance of component A, more tropical host species. A meta-analysis of published results reveals intermediate to high correlations between plant and herbivore diversity, accounting for up to 60% of the variation in insect species richness. Support for other factors is mixed, with studies too scarce and approaches too uneven to allow for quantitative summaries. More research on individual components is unlikely to resolve their relative contribution to overall herbivore diversity. Instead, we call for the adoption of more coherent methods that avoid pitfalls for larger-scale comparisons, for studies assessing different components together rather than singly, and for studies that investigate herbivore beta-diversity (component D) in a more comprehensive perspective.
Biodiversity in Wuyi Mountains
A new system for understanding the biodiversity in different nature reserves: capacity, connectivity and quality of biodiversity
The role of dispersal ability, climate and spatial separation in shaping biogeographical patterns of phylogenetically distant plant groups in seasonally dry Andean forests of Bolivia
Scale dependency of diversity components estimated from primary biodiversity data and distribution maps
Are communities saturated? On the relationship between α, β and γ diversity
UniFrac: a new phylogenetic method for comparing microbial communities
DOI:10.1128/AEM.71.12.8228-8235.2005
URL
PMID:16332807
[本文引用: 1]
We introduce here a new method for computing differences between microbial communities based on phylogenetic information. This method, UniFrac, measures the phylogenetic distance between sets of taxa in a phylogenetic tree as the fraction of the branch length of the tree that leads to descendants from either one environment or the other, but not both. UniFrac can be used to determine whether communities are significantly different, to compare many communities simultaneously using clustering and ordination techniques, and to measure the relative contributions of different factors, such as chemistry and geography, to similarities between samples. We demonstrate the utility of UniFrac by applying it to published 16S rRNA gene libraries from cultured isolates and environmental clones of bacteria in marine sediment, water, and ice. Our results reveal that (i) cultured isolates from ice, water, and sediment resemble each other and environmental clone sequences from sea ice, but not environmental clone sequences from sediment and water; (ii) the geographical location does not correlate strongly with bacterial community differences in ice and sediment from the Arctic and Antarctic; and (iii) bacterial communities differ between terrestrially impacted seawater (whether polar or temperate) and warm oligotrophic seawater, whereas those in individual seawater samples are not more similar to each other than to those in sediment or ice samples. These results illustrate that UniFrac provides a new way of characterizing microbial communities, using the wealth of environmental rRNA sequences, and allows quantitative insight into the factors that underlie the distribution of lineages among environments.
Comparative influence of spatial scale on beta diversity within regional assemblages of birds and butterflies
DOI:10.1111/jbi.2004.31.issue-6 URL [本文引用: 1]
Systematic conservation planning
DOI:10.1038/35012251
URL
PMID:10821285
[本文引用: 3]
The realization of conservation goals requires strategies for managing whole landscapes including areas allocated to both production and protection. Reserves alone are not adequate for nature conservation but they are the cornerstone on which regional strategies are built. Reserves have two main roles. They should sample or represent the biodiversity of each region and they should separate this biodiversity from processes that threaten its persistence. Existing reserve systems throughout the world contain a biased sample of biodiversity, usually that of remote places and other areas that are unsuitable for commercial activities. A more systematic approach to locating and designing reserves has been evolving and this approach will need to be implemented if a large proportion of today's biodiversity is to exist in a future of increasing numbers of people and their demands on natural resources.
Urbanization as a major cause of biotic homogenization
Putting beta-diversity on the map: broad-scale congruence and coincidence in the extremes
Environmental drivers of beta-diversity patterns in New-World birds and mammals
Biogeographical concordance and efficiency of taxon indicators for establishing conservation priority in a tropical rainforest biota
A general framework for the distance-decay of similarity in ecological communities
DOI:10.1111/j.1461-0248.2008.01202.x
URL
PMID:18494792
[本文引用: 1]
Species spatial turnover, or beta-diversity, induces a decay of community similarity with geographic distance known as the distance-decay relationship. Although this relationship is central to biodiversity and biogeography, its theoretical underpinnings remain poorly understood. Here, we develop a general framework to describe how the distance-decay relationship is influenced by population aggregation and the landscape-scale species-abundance distribution. We utilize this general framework and data from three tropical forests to show that rare species have a weak influence on distance-decay curves, and that overall similarity and rates of decay are primarily influenced by species abundances and population aggregation respectively. We illustrate the utility of the framework by deriving an exact analytical expression of the distance-decay relationship when population aggregation is characterized by the Poisson Cluster Process. Our study provides a foundation for understanding the distance-decay relationship, and for predicting and testing patterns of beta-diversity under competing theories in ecology.
The distance decay of similarity in biogeography and ecology
Conservation, the two pillars of ecological explanation, and the paradigm of distance
Species-area curves based on geographic range and occupancy
Geographical and environmental controls of palm beta diversity in paleo-riverine terrace forests in Amazonian Peru
Low beta diversity of herbivorous insects in tropical forests
DOI:10.1038/nature06021
URL
PMID:17687324
[本文引用: 1]
Recent advances in understanding insect communities in tropical forests have contributed little to our knowledge of large-scale patterns of insect diversity, because incomplete taxonomic knowledge of many tropical species hinders the mapping of their distribution records. This impedes an understanding of global biodiversity patterns and explains why tropical insects are under-represented in conservation biology. Our study of approximately 500 species from three herbivorous guilds feeding on foliage (caterpillars, Lepidoptera), wood (ambrosia beetles, Coleoptera) and fruit (fruitflies, Diptera) found a low rate of change in species composition (beta diversity) across 75,000 square kilometres of contiguous lowland rainforest in Papua New Guinea, as most species were widely distributed. For caterpillars feeding on large plant genera, most species fed on multiple host species, so that even locally restricted plant species did not support endemic herbivores. Large plant genera represented a continuously distributed resource easily colonized by moths and butterflies over hundreds of kilometres. Low beta diversity was also documented in groups with differing host specificity (fruitflies and ambrosia beetles), suggesting that dispersal limitation does not have a substantial role in shaping the distribution of insect species in New Guinea lowland rainforests. Similar patterns of low beta diversity can be expected in other tropical lowland rainforests, as they are typically situated in the extensive low basins of major tropical rivers similar to the Sepik-Ramu region of New Guinea studied here.
Regional gradient analysis and spatial pattern of woody plant communities of Oregon forests
Rescaling of ecological gradients. I. Calculation of ecological distance between vegetation stands by means of their floristic composition
Analyzing or explaining beta diversity? Comment
Biological diversity—Where is it
DOI:10.1126/science.1546290 URL PMID:1546290 [本文引用: 2]
Biodiversity surrogate groups and conservation priority areas: birds of the Brazilian Cerrado
Species turnover between Afromontane and eastern African lowland faunas: patterns shown by amphibians
Beyond opportunism: key principles for systematic reserve selection
DOI:10.1016/0169-5347(93)90023-I
URL
PMID:21236127
[本文引用: 3]
The intention and practice of conservation reserve selection are different. A major reason for systems of reserves is to sustain biological diversity. This involves protecting examples of as many natural features, e.g. species, communities or environments, as possible. In reality, however, new reserves have rarely been dedicated for their representation of features. Furthermore, the opportunism that has characterized the development of reserve systems can actually jeopardize the representation of all features in reserves through the inefficient allocation of limited resources. More systematic approaches are essential if reserves are to play their role in protecting biodiversity. Some basic principles for conservation planning are emerging from recent systematic procedures for reserve selection. These principles will help to link intention and practice.
Woody plants in Kenya: expanding the Higher-Taxon Approach
Beta diversity in relation to dispersal ability for vascular plants in North America
Global comparisons of beta diversity among mammals, birds, reptiles, and amphibians across spatial scales and taxonomic ranks
The latitudinal gradient of beta diversity in relation to climate and topography for mammals in North America
The role of exotic species in homogenizing the North American flora
DOI:10.1111/j.1461-0248.2006.00982.x
URL
PMID:17118003
[本文引用: 2]
Exotic species have begun to homogenize the global biota, yet few data are available to assess the extent of this process or factors that constrain its advance at global or continental scales. We evaluate homogenization of vascular plants across America north of Mexico by comparing similarity in the complete native and exotic floras between states and provinces of the USA and Canada. Compared with native species, exotic plants are distributed haphazardly among areas but spread more widely, producing differentiation of floras among neighbouring areas but homogenization at greater distance. The number of exotic species is more closely associated with the size of the human population than with ecological conditions, as in the case of native species, and their distributions are less influenced by climate than those of native species.
A latitudinal gradient in large-scale beta diversity for vascular plants in North America
DOI:10.1111/j.1461-0248.2007.01066.x
URL
PMID:17594429
[本文引用: 5]
Species turnover, or beta diversity, has been predicted to decrease with increasing latitude, but few studies have tested this relationship. Here, we examined the beta diversity-latitude relationship for vascular plants at a continental scale, based on complete species lists of native vascular plants for entire states or provinces in North America (north of Mexico). We calculated beta diversity as the slope of the relationship between the natural logarithm of the Jaccard index (lnJ ) for families, genera or species, and both geographic distance and climate difference within five latitude zones. We found that beta diversity decreased from south to north; within latitude zones, it decreased from species to genera and families. Geographic and climatic distance explained about the same proportion of the variance in lnJ in zones south of c. 50 degrees N. North of this latitude, nearly all the explained variance in lnJ was attributable to geographic distance. Therefore, decreasing beta diversity from south to north reflects decreasing climate differentiation within more northerly latitude zones, and primarily post-glacial dispersal limitation north of 50 degrees N.
Beta diversity of angiosperms in temperate floras of eastern Asia and eastern North America
Computing β-diversity from species-area curves
Computing β-diversity with Rao’s quadratic entropy: a change of perspective
Ecological diversity and biodiversity as concepts for conservation planning: comments on Ricotta
DOI:10.1007/s10441-006-8259-z
URL
PMID:16988906
[本文引用: 1]
Ricotta argues against the existence of a unique measure of biodiversity by pointing out that no known measure of alpha-diversity satisfies all the adequacy conditions that have traditionally been set for it. While that technical claim is correct, it is not relevant in the context of defining biodiversity which is most usefully measured by beta-diversity. The concept of complementarity provides a closely related family of measures of biodiversity which can be used for systematic conservation planning. Moreover, these measures cannot be replaced by summary statistics but must rely on inventories of biodiversity surrogates at candidate sites for conservation.
Alpha, beta, or gamma: where does all the diversity go
Biological determinants of species-diversity
The distance decay of similarity in ecological communities
Environment, dispersal and patterns of species similarity
Geographical ecology at the community level: perspectives on the diversity of New World bats
Beta diversity and taxonomic sufficiency: do higher-level taxa reflect heterogeneity in species composition
A diversity of beta diversities: straightening up a concept gone awry. Part 1. Defining beta diversity as a function of alpha and gamma diversity
A diversity of beta diversities: straightening up a concept gone awry. Part 2. Defining beta diversity as a function of alpha and gamma diversity
Analyzing or explaining beta diversity? Understanding the targets of different methods of analysis
DOI:10.1890/0012-9658(2006)87[2697:aoebdu]2.0.co;2
URL
PMID:17168014
[本文引用: 2]
It has been actively discussed recently what statistical methods are appropriate when one is interested in testing hypotheses about the origin of beta diversity, especially whether one should use the raw-data approach (e.g., canonical analysis such as RDA and CCA) or the distance approach (e.g., Mantel test and multiple regression on distance matrices). Most of the confusion seems to stem from uncertainty as to what is the response variable in the different approaches. Here our aim is to clarify this issue. We also show that, although both the raw-data approach and the distance approach can often be used to address the same ecological hypothesis, they target fundamentally different predictions of those hypotheses. As the two approaches shed light on different aspects of the ecological hypotheses, they should be viewed as complementary rather than alternative ways of analyzing data. However, in some cases only one of the approaches may be appropriate. We argue that S. P. Hubbell's neutral theory can only be tested using the distance approach, because its testable predictions are stated in terms of distances, not in terms of raw data. In all cases, the decision on which method is chosen must be based on which addresses the question at hand, it cannot be based on which provides the highest proportion of explained variance in simulation studies.
Analyzing or explaining beta diversity? Reply
DOI:10.1890/08-1247.1 URL PMID:31766791 [本文引用: 1]
Dispersal, environment, and floristic variation of western Amazonian forests
Spatial congruence of ecological transition at the regional scale in South Africa
Species turnover: the case of stream amphibians of rainforests in the Western Ghats, southern India
The additive partitioning of species diversity: recent revival of an old idea
A literature review on biotic homogenization
Vegetation of the Siskiyou Mountains, Oregon and California
Beta diversity and nature reserve system design in the Yukon, Canada
Mapping variations in the strength and breadth of biogeographic transition zones using species turnover
Interpreting biogeographical boundaries among Afrotropical birds: spatial patterns in richness gradients and species replacement
Latitudinal gradients of biodiversity: pattern, process, scale and synthesis
Measuring beta diversity with presence-absence data
