


物种丰富度的大尺度地理格局是宏观生态学和生物地理学的中心议题之一, 也是全球及区域物种多样性保护的重要参考和依据(Brown & Lomolino, 1998; Gaston, 2000)。以往关于物种丰富度大尺度地理格局的研究涉及各主要生物类群, 包括植物(Currie & Paquin, 1987; O’Brien, 1998; Francis & Currie, 2003)、无脊椎动物(Kerr et al., 2001; White & Kerr, 2006)、鱼类(Oberdorff et al., 1995; Zhao et al., 2006b)、两栖类(Rodriguez et al., 2005; Buckley & Jetz, 2007; Qian et al., 2007)、爬行类(Rodriguez et al., 2005; Qian et al., 2007)、鸟类(Rahbek & Graves, 2001; Hawkins et al., 2003a; Ding et al., 2006)、哺乳类(Simpson, 1964; Kerr & Packer, 1997; Tognelli & Kelt, 2004)等, 并且围绕地理格局的成因提出了多个假说, 包括面积假说(MacArthur & Wilson, 1967; Rosenzweig, 1995; Rosenzweig & Ziv, 1999)、能量假说(Wright, 1983; Currie & Paquin, 1987; Currie, 1991; Hawkins et al., 2003b; Brown et al., 2004)、环境稳定性假说(Connell & Orias, 1964; Stevens, 1989)、生境异质性假说(Pianka, 1966; Kerr & Packer, 1997)、历史假说(Ricklefs, 1987; Latham & Ricklefs, 1993; Qian & Ricklefs, 2000)等。这些假说基于不同的影响因子和生态/非生态过程, 探讨了物种丰富度大尺度格局的形成机制。虽然以往的研究对各种假说进行了大量验证, 但对于不同假说的地位以及物种丰富度大尺度格局形成的主导因子, 目前仍存在广泛争议(Rosenzweig, 1995)。其中, 讨论最多的为能量假说、环境稳定性假说和生境异质性假说。
能量假说认为, 物种丰富度主要受能量控制, 能量越高的地区物种越丰富(Wright, 1983; Hawkins et al., 2003b)。根据不同的能量形式, 能量假说进一步划分为环境热量假说(ambient-energy hypothesis) 和生产力假说(productivity hypothesis)。环境热量假说认为, 能量对物种丰富度的影响是通过温度对物种体温调节、生长繁衍及分化的控制实现的; 温度越高, 物种维持体温所消耗的能量越少, 并将更多的能量用于生长和繁殖, 从而促进物种分化并提高物种丰富度(Turner et al., 1987; Currie, 1991); 这一假说中的能量多以环境温度(temperature)或潜在蒸散量(PET, potential evapotranspiration)表示。而生产力假说认为, 动物的物种丰富度主要受食物资源控制, 初级生产力较高的地区具有更丰富的食物资源, 能够支持更多的个体, 并维持较高的物种丰富度水平(Wright, 1983; Hawkins et al., 2003b; Clarke & Gaston, 2006); 这一假说中的能量通常以归一化植被指数(NDVI, normalized difference vegetation index)或实际蒸散量(AET, actual evapotranspiration)表达。
环境稳定性假说认为, 稳定的环境将促进物种特化, 并使物种生态位趋于狭窄, 因此能容纳更多的物种(Klopfer, 1959; Klopfer & MacArthur, 1960); 反之, 在波动的环境中, 物种需要具有更广泛的生理适应能力才能生存下来(Stevens, 1989), 因此物种丰富度较低。生境异质性假说认为, 生境异质性高的地区能够提供更多的生态位, 从而更有利于物种共存, 物种丰富度也随之增加(Shmida & Wilson, 1985)。
中国疆域辽阔, 地形复杂, 气候多样, 物种丰富, 是全球12个“巨大多样性国家”(mega-diversity countries)之一(陈昌笃, 1998), 适合开展大尺度物种丰富度格局的研究。但由于缺乏完整的物种分布数据, 以往关于中国陆栖哺乳动物物种丰富度大尺度地理格局的研究尚不多见(可参见张荣祖和林永烈, 1985; Zhao et al., 2006a)。本研究以《中国哺乳动物图鉴》(中国野生动物保护协会, 2005)、《中国哺乳动物彩色图鉴》(潘清华等, 2007)为基础, 并参考中国物种信息服务网站(CSIS, http://www.chinabiodiversity.com)及世界自然保护联盟(IUCN)2008红色名录(IUCN, 2008), 建立了中国陆栖哺乳动物物种分布数据库。基于该数据库, 并利用高分辨率的气候、地形、植被等环境信息, 尝试分析中国陆栖哺乳动物及主要类群物种丰富度的大尺度格局, 并结合相关假说探讨物种丰富度与环境因子的关系, 确定中国陆栖哺乳动物物种丰富度大尺度格局形成的主导因子。
1 数据与方法
1.1 物种分布数据
物种分布区数据主要来自《中国哺乳动物图鉴》(中国野生动物保护协会, 2005)和《中国哺乳动物彩色图鉴》(潘清华等, 2007)记录的物种实际分布范围。我们将各物种分布图进行扫描和数字化, 并通过ArcGIS9.0做投影变换使其具备统一的Albers等面积圆锥投影(Albers equal area conic projection)。为提高数据库的准确性, 我们还根据中国物种信息服务网站(CSIS,
在物种丰富度大尺度格局的研究中, 面积是一个重要的影响因素(He & Legendre, 1996)。为了消除面积对物种丰富度的影响, 本研究采用100 km×100 km的等面积网格系统(Tognelli & Kelt, 2004; Ding et al., 2006)。在计算物种丰富度时, 首先将所有物种分布区与网格系统叠加, 然后统计每个网格内出现的物种数, 作为各网格的物种丰富度值。该网格系统将全国划分为1,070个网格, 由于海岸线及边界地区的网格不完整, 可能给后续统计分析带来偏差, 文中只使用了面积大于7,500 km2(即完整网格面积的3/4)的网格(共计900个)进行分析。为在类群间进行比较, 本文同时计算了陆栖哺乳动物主要类群的物种丰富度, 包括食虫目(75种)、翼手目(114种)、灵长目(21种)、食肉目(52种)、偶蹄目(43种)、兔形目(34种)和啮齿目(190种); 攀鼩目、长鼻目、奇蹄目、鳞甲目因物种较少, 未列入讨论范围。陆栖哺乳动物及主要类群物种丰富度的基本统计信息见表1。
表1 100 km×100 km等面积网格系统中陆栖哺乳动物物种丰富度及各环境因子的基本统计信息(n = 900)
Table 1
| 最小值Minimum | 最大值Maximum | 平均值 Mean | 标准差 SD | |
|---|---|---|---|---|
| 物种丰富度 Species richness | ||||
| 陆栖哺乳类 Terrestrial mammals | 16 | 177 | 59.2 | 31.0 |
| 食虫目 Eulipotyphla | 0 | 27 | 5.8 | 5.1 |
| 翼手目 Chiroptera | 0 | 45 | 9.7 | 10.5 |
| 灵长目 Primates | 0 | 9 | 0.9 | 1.6 |
| 食肉目 Carnivora | 3 | 34 | 14.5 | 6.7 |
| 偶蹄目 Artiodactyla | 1 | 18 | 6.0 | 2.8 |
| 兔形目 Lagomorpha | 0 | 10 | 3.1 | 2.1 |
| 啮齿目 Rodentia | 2 | 52 | 18.1 | 9.8 |
| 环境因子 Environmental variables | ||||
| 年均温 Mean annual temperature (MAT, ℃)1 | -8.3 | 24.1 | 6.8 | 7.8 |
| 最热月均温 Mean temperature of the warmest month (MTWM, ℃)2 | 10.0 | 36.5 | 25.1 | 7.0 |
| 最冷月均温 Mean temperature of the coldest month (MTCM, ℃)3 | -37.7 | 14.4 | -13.7 | 11.1 |
| 潜在蒸散量 Potential evapotranspiration (PET, mm)4 | 257.2 | 1,320.2 | 627.9 | 220.6 |
| 年降水量 Annual precipitation (AP, mm)5 | 17.7 | 2,542.7 | 596.3 | 506.9 |
| 实际蒸散量 Actual evapotranspiration (AET, mm)6 | 17.7 | 1,298.8 | 452.9 | 311.0 |
| 归一化植被指数 Normalized difference vegetation index (NDVI)7 | 0.043 | 0.667 | 0.286 | 0.166 |
| 气温年较差 Annual range of temperature (ART, ℃)8 | 16.4 | 60.6 | 38.9 | 9.4 |
| 海拔变幅 Elevational range (ER, m)9 | 41 | 6,717 | 1,645.6 | 1,148.0 |
| 生态系统类型数 Number of ecosystems (VEGE)10 | 1 | 55 | 15.8 | 8.2 |
1~4 环境热量假说的衡量指标; 5~7 生产力假说的衡量指标; 8 环境稳定性假说的衡量指标; 9~10 生境异质性假说的衡量指标。
1~4 Descriptors of ambient-energy hypothesis; 5~7 Descriptors of productivity hypothesis; 8 Descriptors of environmental stability hypothesis; 9~10 Descriptors of habitat heterogeneity hypothesis.
1.2 环境数据
为了分析环境因子对物种丰富度格局的影响, 本文采用了10个环境变量, 并将其分为4组, 各组分别与特定的物种丰富度大尺度格局假说相对应(表1)。
环境热量假说(ambient-energy hypothesis): 采用年均温(MAT)、最冷月均温(MTCM)、最热月均温(MTWM)和潜在蒸散量(PET)表征一个地区的环境热量。其中潜在蒸散量表示理想状态下经蒸发和蒸腾从地表向大气转移的最大水量, 主要由环境热量决定(Currie, 1991)。
生产力假说(productivity hypothesis): 采用归一化植被指数(NDVI)、实际蒸散量(AET)和年降水量(AP)反映一个地区的生产力水平。其中归一化植被指数(以下简称植被指数)与植被覆盖程度和植被生产力显著相关(Defries & Townshend, 1994), 常用于反映生产力的相对大小。实际蒸散量表示经蒸发和蒸腾从地表向大气实际转移的水量, 它同时受能量和水分影响, 反映了水热综合效应, 常作为初级生产力的替代指标(Hawkins et al., 2003b)。此外, 在研究区范围内, 年降水量与植被指数、实际蒸散量具强相关性(NDVI: r = 0.878, P<0.001; AET: r = 0.938, P<0.001), 也将其作为生产力假说的替代指标。
环境稳定性假说(environmental stability hypothesis): 采用气温年较差(ART)作为环境稳定性的衡量指标。气温年较差反映了日均温在一年内的波动程度, 较大的年较差说明该地区温度的季节波动性较强。
生境异质性假说(habitat heterogeneity hypothesis): 采用海拔变幅(ER)(即网格内最高海拔-最低海拔)和生态系统类型数(VEGE)分别衡量网格内的地形复杂性和生境复杂性。
以上环境数据中, 气候数据均来自世界气候数据网站(
1.3 统计分析
本研究采用单因素相关分析考察各环境因子对陆栖哺乳动物总体及各类群物种丰富度格局的独立影响程度, 并采用最优线性模型筛选出决定丰富度格局的主要环境因子。由于物种分布数据和环境数据普遍存在显著的空间自相关, 这通常会降低样本独立性, 使我们在进行显著性检验时增加犯第一类错误的概率, 并倾向于得到更显著的结果(Diniz-Filho et al., 2003)。因此, 在检验相关系数的显著性水平时, 本文使用了改进的t检验方法(Dutilleul et al., 1993), 首先估算样本的有效自由度(effective degree of freedom), 并以该有效自由度计算t统计量, 再进行显著性检验。
最优线性模型以校正后的模型拟合优度(adjusted R2)为依据, 在物种丰富度与环境因子的多元线性回归模型中, 选择拟合优度最大的两个线性组合构成最优线性模型(Andrews & O’Brien, 2000; Rensburg et al., 2002), 并通过偏决定系数(partial coefficient of determination)比较环境因子对模型的相对贡献大小(Quinn & Keough, 2002; Qian et al., 2007)。为了消除环境因子间严重的多重共线性对回归模型的影响, 本研究将自变量个数控制为3个, 且模型中自变量的容忍度(tolerance)均控制在0.6-1.0之间(Ruggiero & Kitzberger, 2004)。
以上统计分析均在R中完成(R Development Core Team, 2008)。
2 结果
2.1 物种丰富度格局
中国陆栖哺乳动物的物种丰富度呈现显著的纬度梯度格局, 即由南向北逐渐递减(图1-A)。其中, 亚热带、热带的西部是物种最为丰富的区域, 存在多个物种丰富度的热点地区(hotspot), 如云南南部的西双版纳、中南部的哀牢山及无量山、横断山区等。这些热点区域的周边地区也拥有较高的物种丰富度, 包括广西、贵州的大部分山区以及陕西、甘肃南部的山地等。而东部平原地区、西北干旱区及青藏高原物种丰富度普遍较低; 其中, 华北平原、内蒙古西部阿拉善地区、塔里木盆地及青藏高原的腹地是哺乳动物丰富度最为贫乏的区域。同时, 物种丰富度格局与中国的宏观地形具有良好的对应关系, 物种丰富度高的地区多集中于地势起伏大、生境多样的山区, 而平原及自然条件恶劣的高原和盆地则是丰富度较低的区域。
图1
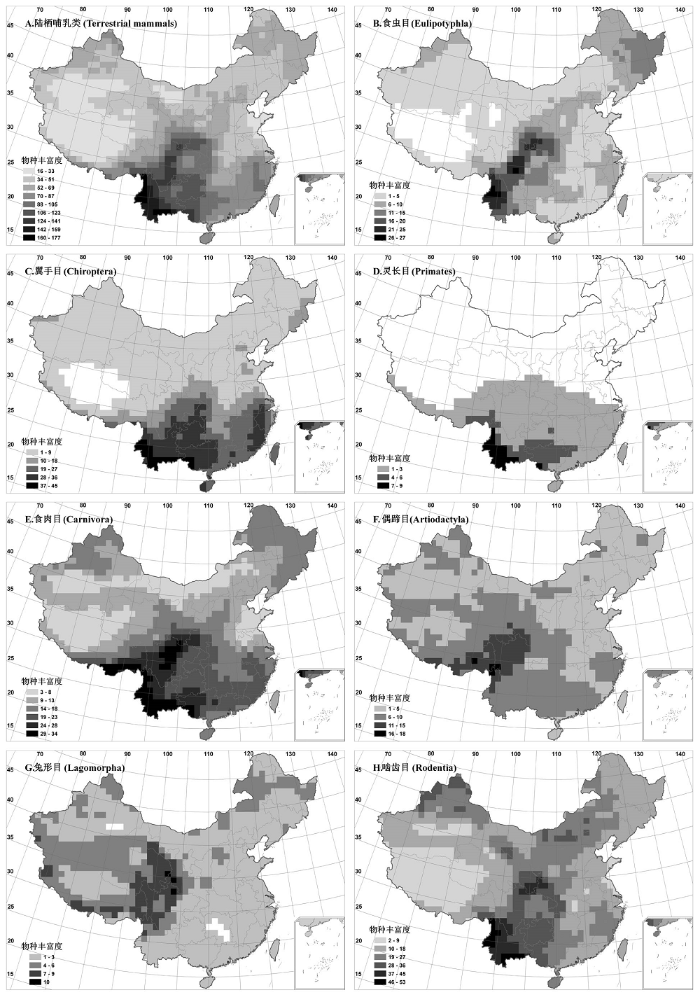
图1
中国陆栖哺乳动物(A)及主要类群(B: 食虫目; C: 翼手目; D: 灵长目; E: 食肉目; F: 偶蹄目; G: 兔形目; H: 啮齿目)的物种丰富度格局(100 km×100 km)
Fig. 1
Patterns of terrestrial mammal species richness in China (100 km×100 km). A, Terrestrial mammals; B, Eulipotyphla; C, Chiroptera; D, Primates; E, Carnivora; F, Artiodactyla; G, Lagomorpha; H, Rodentia.
进一步分析各主要类群的物种丰富度格局, 结果如下:
(1) 食虫目: 除青藏高原主体及其周围山地外, 全国均有分布; 物种丰富度较高的区域集中在横断山区、邛崃山、岷山、秦岭等地, 华北平原及西北干旱区物种丰富度较低(图1-B)。
(2) 翼手目: 多分布于热带、亚热带季风区, 其中云贵高原、广西和福建等地的山地和丘陵是丰富度较高的区域, 北方大部分地区物种丰富度较低, 而青藏高原腹地则未见分布(图1-C)。
(3) 灵长目: 多数物种的分布区仅限于热带和亚热带, 其中藏东南至云南西部、中部、南部中越边境一带及广西南部为灵长目丰富度最高的区域, 秦岭—淮河以北地区和青藏高原则未见分布(图1-D)。
(5) 偶蹄目: 全国广布。总体上看, 南方丰富度水平高于北方, 其中横断山区及喜马拉雅山东段是物种最为丰富的区域, 而东北的小兴安岭及新疆的阿尔泰山、天山等则是北方物种丰富度相对较高的区域。青藏高原腹地也有物种分布, 如牦牛和藏羚羊等(图1-F)。
(6) 兔形目: 几乎遍布全国, 但除青藏高原周围山地外, 其他地区的物种丰富度均较低。其中, 青藏高原东部及喜马拉雅山地区是丰富度最高的区域(图1-G)。
(7) 啮齿目: 全国均有分布, 其中秦岭、岷山、云南西北部横断山区、云南中部及南部地区丰富度最高; 此外, 新疆北部的阿尔泰山及天山、内蒙古中部地区物种也较为丰富, 而塔里木盆地、青藏高原腹地和山东半岛丰富度均较低(图1-H)。
综上所述, 哺乳动物主要类群的物种丰富度格局具有各自的特点, 彼此间既存在差异, 又有一定程度的相似性: 华北平原、塔里木盆地、青藏高原腹地各类群的物种丰富度均较低, 而亚热带、热带西部, 尤其是横断山脉与云南中南部地区, 则是多数类群物种最丰富的区域。同时, 主要类群物种丰富度的相关性矩阵也显示(表2): 除兔形目外, 各主要类群的物种丰富度与总体物种丰富度均显著相关(r = 0.589-0.920, P < 0.05), 但类群间物种丰富度的共变趋势并不一致, 食虫目、翼手目、灵长目、食肉目、啮齿目间物种丰富度的相关性较强(r = 0.530-0.815, P < 0.05), 而偶蹄目、兔形目与其他类群物种丰富度的相关性多数较弱, 或没有显著相关性。
表2 中国陆栖哺乳动物及主要类群物种丰富度的相关性矩阵(n = 900)
Table 2
| 陆栖哺乳类Terrestrial mammals | 食虫目 Eulipotyphla | 翼手目 Chiroptera | 灵长目 Primates | 食肉目 Carnivora | 偶蹄目 Artiodactyla | 兔形目 Lagomorpha | 啮齿目 Rodentia | |
|---|---|---|---|---|---|---|---|---|
| 陆栖哺乳类 Terrestrial mammals | 1.000 | |||||||
| 食虫目 Eulipotyphla | 0.801*** | 1.000 | ||||||
| 翼手目 Chiroptera | 0.845*** | 0.548* | 1.000 | |||||
| 灵长目 Primates | 0.839*** | 0.530* | 0.811*** | 1.000 | ||||
| 食肉目 Carnivora | 0.920*** | 0.690*** | 0.755** | 0.815*** | 1.000 | |||
| 偶蹄目 Artiodactyla | 0.589* | 0.350ns | 0.302ns | 0.567** | 0.685** | 1.000 | ||
| 兔形目 Lagomorpha | 0.018ns | 0.018ns | -0.332ns | -0.051ns | 0.117ns | 0.575** | 1.000 | |
| 啮齿目 Rodentia | 0.847*** | 0.743*** | 0.581* | 0.573* | 0.654** | 0.360ns | -0.027ns | 1.000 |
显著性水平由改进的t检验方法计算(
* P < 0.05; ** P < 0.01; *** P < 0.001; ns, non-significant. Adjusted P values were computed using modified t test developed by
2.2 物种丰富度与环境因子的单因素相关分析
物种丰富度与各环境因子的单因素相关分析结果显示(表3): 中国陆栖哺乳动物总体物种丰富度分别与植被指数、年降水量、实际蒸散量、最冷月均温、生态系统类型数呈显著正相关, 与气温年较差呈显著负相关。其中, 与植被指数、年降水量、实际蒸散量的相关性最强(NDVI: r=0.691, P<0.05; AP: r=0.686, P<0.05; AET: r=0.651, P<0.05), 与最冷月均温、气温年较差的相关性次之(MTCM: r=0.627, P<0.05; ART: r=-0.587, P<0.05), 与生态系统类型数的相关系数则显著低于上述气候或生产力因子(VEGE, r = 0.426, P < 0.01)。
表3 中国陆栖哺乳动物及主要类群物种丰富度与环境因子的单因素相关关系(n = 900)
Table 3
| 陆栖哺乳类 Terrestrial mammals | 食虫目 Eulipotyphla | 翼手目 Chiroptera | 灵长目 Primates | 食肉目 Carnivora | 偶蹄目 Artiodactyla | 兔形目 Lagomorpha | 啮齿目 Rodentia | |
|---|---|---|---|---|---|---|---|---|
| 年均温 (MAT, ℃) | 0.541ns | 0.345ns | 0.742** | 0.515* | 0.434ns | -0.087ns | -0.593** | 0.458ns |
| 最热月均温 (MTWM, ℃) | 0.209ns | 0.218ns | 0.371ns | 0.092ns | 0.074ns | -0.439ns | -0.653*** | 0.337ns |
| 最冷月均温 (MTCM, ℃) | 0.627* | 0.328ns | 0.839** | 0.669** | 0.550* | 0.134ns | -0.464* | 0.424ns |
| 潜在蒸散量 (PET, mm) | 0.432ns | 0.268ns | 0.671* | 0.401ns | 0.327ns | -0.224ns | -0.660*** | 0.381ns |
| 年降水量 (AP, mm) | 0.686* | 0.411ns | 0.863** | 0.678* | 0.687* | 0.282ns | -0.349ns | 0.390ns |
| 实际蒸散量 (AET, mm) | 0.651* | 0.440ns | 0.821** | 0.610* | 0.645* | 0.186ns | -0.391ns | 0.395ns |
| 植被指数 (NDVI) | 0.691* | 0.579* | 0.744* | 0.558* | 0.683* | 0.242ns | -0.272ns | 0.482ns |
| 气温年较差 (ART, ℃) | -0.587* | -0.226ns | -0.718** | -0.725** | -0.598* | -0.488** | -0.061ns | -0.251ns |
| 海拔变幅 (ER, m) | 0.318ns | 0.159ns | 0.091ns | 0.257ns | 0.402** | 0.591*** | 0.482*** | 0.214ns |
| 生态系统类型数 (VEGE) | 0.426** | 0.410** | 0.116ns | 0.142ns | 0.382* | 0.347* | 0.248ns | 0.577*** |
显著性水平由改进的t检验方法计算(
* P < 0.05; ** P < 0.01;*** P < 0.001; ns, non-significant. Adjusted P values were computed using modified t test developed by
各主要类群物种丰富度与环境因子的相关分析显示(表3):
(1) 食虫目物种丰富度仅与植被指数、生态系统类型数显著相关, 相关系数分别为0.579(P < 0.05)和0.410(P < 0.01)。
(2) 翼手目、灵长目物种丰富度与表征环境热量、生产力、气候稳定性的环境因子均显著相关; 其中, 翼手目物种丰富度与最冷月均温、年降水量及实际蒸散量的相关性最强, 相关系数均在0.8以上(P < 0.01), 灵长目丰富度与气温年较差的相关性最强, 相关系数为-0.725(P < 0.01)。
(3) 食肉目物种丰富度与各类环境因子均显著相关; 其中, 与生产力因子相关性最强(AP: r=0.687, P<0.05; NDVI: r=0.683, P<0.05; AET: r=0.645, P<0.05), 而与生境异质性因子的相关性较弱(ER: r=0.402, P<0.01; VEGE: r=0.382, P<0.05)。
(4) 偶蹄目物种丰富度与生境异质性因子呈显著正相关; 其中, 与海拔变幅的相关性最强, 相关系数为0.591(P < 0.001)。其与气候及生产力因子则大多不具显著相关性, 仅与气温年较差呈显著负相关(r = - 0.488, P < 0.01)。
(5) 兔形目物种丰富度与环境热量因子均呈显著的负相关关系; 其中, 与潜在蒸散量及最热月均温的相关性最强, 相关系数分别达-0.660(P < 0.001)和-0.653(P < 0.001)。同时, 其与生境异质性因子中的海拔变幅显著正相关(r = 0.482, P < 0.001), 但相关系数(绝对值)低于环境热量因子。
(6) 啮齿目物种丰富度与各气候及生产力因子均不具显著相关性, 仅与生态系统类型数呈显著正相关(VEGE: r = 0.577, P < 0.001)。
综上所述, 各主要类群物种丰富度与环境因子的相关关系并不一致。总体而言, 食虫目、翼手目、灵长目及食肉目的物种丰富度均与植被指数显著正相关(r > 0.55, P < 0.05), 与气候因子也有不同程度的相关性, 与生境异质性因子的相关性则相对较弱; 而偶蹄目、啮齿目的物种丰富度与多数气候及生产力因子均不具显著相关性, 只与生境异质性因子显著相关; 兔形目物种丰富度则与环境热量因子呈强负相关。
2.3 物种丰富度与环境因子的最优线性模型
表4 中国陆栖哺乳动物及主要类群物种丰富度与环境因子的最优线性模型
Table 4
| 环境因子 Environmental variables | 标准化系数 Standardized coefficient | 偏决定系数 Partial r2 | 模型解释率 (校正后) Adjusted R2 | 显著性水平 (校正后) Adjusted P | ||
|---|---|---|---|---|---|---|
| 陆栖哺乳类 Terrestrial mammals | Model I | 植被指数 (NDVI) 生态系统类型数 (VEGE) 气温年较差 (ART) | 0.461 0.324 -0.351 | 0.318 0.231 0.218 | 0.662 | 0.001 |
| Model II | 植被指数 (NDVI) 海拔变幅 (ER) 最冷月均温 (MTCM) | 0.525 0.348 0.300 | 0.332 0.262 0.141 | 0.660 | 0.001 | |
| 食虫目 Eulipotyphla | Model I | 植被指数 (NDVI) 生态系统类型数 (VEGE) 气温年较差 (ART) | 0.545 0.310 0.050 | 0.279 0.140 0.003 | 0.430 | 0.002 |
| Model II | 植被指数 (NDVI) 生态系统类型数 (VEGE) 海拔变幅 (ER) | 0.528 0.287 0.049 | 0.315 0.094 0.003 | 0.430 | 0.002 | |
| 翼手目 Chiroptera | Model I | 最冷月均温 (MTCM) 植被指数 (NDVI) 海拔变幅 (ER) | 0.606 0.375 0.112 | 0.527 0.298 0.058 | 0.797 | < 0.001 |
| Model II | 气温年较差 (ART) 植被指数 (NDVI) 最热月均温 (MTWM) | -0.574 0.364 0.306 | 0.526 0.286 0.267 | 0.796 | < 0.001 | |
| 灵长目 Primates | Model I | 气温年较差 (ART) 植被指数 (NDVI) 海拔变幅 (ER) | -0.548 0.301 0.104 | 0.324 0.137 0.022 | 0.590 | 0.002 |
| Model II | 气温年较差 (ART) 植被指数 (NDVI) 最热月均温 (MTWM) | -0.620 0.234 0.076 | 0.390 0.075 0.011 | 0.586 | 0.002 | |
| 食肉目 Carnivora | Model I | 植被指数 (NDVI) 海拔变幅 (ER) 气温年较差 (ART) | 0.619 0.382 -0.180 | 0.467 0.282 0.063 | 0.684 | < 0.001 |
| Model II | 植被指数 (NDVI) 海拔变幅 (ER) 最冷月均温 (MTCM) | 0.599 0.437 0.178 | 0.408 0.375 0.058 | 0.682 | < 0.001 | |
| 偶蹄目 Artiodactyla | Model I | 年降水量 (AP) 海拔变幅 (ER) 最热月均温 (MTWM) | 0.418 0.420 -0.407 | 0.248 0.237 0.206 | 0.543 | < 0.001 |
| Model II | 海拔变幅 (ER) 植被指数 (NDVI) 最热月均温 (MTWM) | 0.454 0.400 -0.387 | 0.266 0.232 0.190 | 0.533 | < 0.001 | |
| 兔形目 Lagomorpha | Model I | 最热月均温 (MTWM) 生态系统类型数 (VEGE) 实际蒸散量 (AET) | -0.599 0.289 -0.182 | 0.398 0.152 0.058 | 0.532 | < 0.001 |
| Model II | 潜在蒸散量 (PET) 海拔变幅 (ER) 生态系统类型数 (VEGE) | -0.589 0.299 0.139 | 0.393 0.069 0.030 | 0.532 | < 0.001 | |
| 啮齿目 Rodentia | Model I | 生态系统类型数 (VEGE) 年均温 (MAT) 植被指数 (NDVI) | 0.514 0.291 0.214 | 0.352 0.105 0.058 | 0.531 | < 0.001 |
| Model II | 生态系统类型数 (VEGE) 植被指数 (NDVI) 潜在蒸散量 (PET) | 0.528 0.251 0.238 | 0.354 0.078 0.074 | 0.514 | < 0.001 |
缩写代表含义同
Abbreviations correspond to those in
各主要类群物种丰富度与环境因子的最优线性模型显示(表4):
(1) 食虫目、食肉目: 植被指数均为影响物种丰富度格局的首要环境因子, 生境异质性因子与气温年较差也进入最优线性模型, 但对模型的贡献均小于植被指数。
(2) 翼手目: 由最冷月均温、植被指数和海拔变幅构成的最优线性模型解释了物种丰富度变化的79.7%; 气温年较差、植被指数和最热月均温的线性组合也解释了物种丰富度变化的79.6%。
(3) 灵长目: 气温年较差是影响物种丰富度格局的首要环境因子, 其与植被指数、海拔变幅构成的最优线性模型解释了物种丰富度变化的59.0%。
(4) 偶蹄目: 生产力因子和海拔变幅对最优线性模型的贡献最大, 并与环境热量因子共同解释了物种丰富度变化的54.3%。
(5) 兔形目: 环境热量因子对物种丰富度格局的影响最为强烈, 并与生境异质性及生产力因子构成最优线性模型, 模型解释率为53.2%。
(6) 啮齿目: 生态系统类型数是影响物种丰富度格局的首要环境因子, 其与年均温、植被指数构成的最优线性模型解释了物种丰富度变化的53.1%。
综上所述, 生产力(以植被指数表征)是中国陆栖哺乳动物物种丰富度格局的主导因子, 而各类群物种丰富度格局的主要影响因素及最优线性模型的解释率则因类群而异。
3 讨论
3.1 中国陆栖哺乳动物物种丰富度格局的主要影响因素
就物种丰富度地理格局的成因, 以往的研究提出了多个假说(Pianka, 1966; Wright, 1983; Stevens, 1989; Rosenzweig, 1995; Brown et al., 2004), 并在不同地域及尺度上对这些假说进行了验证(Currie, 1991; Kerr & Packer, 1997; Rahbek & Graves, 2001; Hawkins et al., 2003b)。本研究结果显示, 中国陆栖哺乳动物的物种丰富度与多个环境因子具有显著相关性, 且植被指数、生态系统类型数与气温年较差的线性组合对物种丰富度格局的解释率最高, 达66.2%。这说明中国陆栖哺乳动物物种丰富度的地理格局受多种环境因素的共同影响, 各类环境因子所表征的物种丰富度假说并不完全排斥(Brown & Lomolino, 1998; Gaston, 2000; Whittaker et al., 2001)。其中, 表征生产力水平的环境因子(以植被指数表征)与物种丰富度的相关性最强, 对最优线性模型的贡献最大(表3, 表4), 表明植被生产力是影响中国陆栖哺乳动物物种丰富度地理分异的主要因素, 这支持了物种丰富度格局的生产力假说。研究认为, 对动物而言, 生产力通过控制区域内的种群密度影响其物种丰富度水平。通常情况下, 生产力较高的地区拥有较丰富的食物资源, 能够维持更高的个体数量, 使更多物种达到最小生存种群(MVP, Minimum viable population), 从而降低灭绝概率, 提高物种丰富度(Brown, 1981; Wright, 1983)。以往的研究也得到了类似的结果, 如Ruggiero和Kitzberger (2004)对南美洲哺乳动物物种丰富度的研究同样支持生产力假说, 不同的是, 他们发现在表征生产力的环境因子中, 实际蒸散量比植被指数能更好地解释物种丰富度的大尺度地理格局。Hawkins等(2003a)对鸟类的研究也发现, 在全球尺度上, 生产力(以实际蒸散量表征)是影响物种丰富度格局的主要因素, 其解释率高达72%。值得说明的是, 物种丰富度格局的主导因子可能随研究区域的不同而不同, 如Kerr和Packer(1997)对北美洲哺乳动物的研究发现, 在高纬度地区, 环境热量是影响物种丰富度地理分异的主要因素, 而在中低纬度地区, 生境异质性则是决定物种丰富度空间分布的更为重要的因子。
3.2 中国陆栖哺乳动物物种丰富度格局及成因的复杂性
中国具有丰富的哺乳动物资源, 物种数约占世界哺乳动物物种数的10.4%(IUCN, 2008; Schipper et al., 2008), 本研究涉及的陆栖哺乳动物共计11目535种。中国陆栖哺乳动物及其主要类群的物种丰富度格局表明, 各类群的物种丰富度格局既存在共性, 又有差别, 从而使整体格局趋于复杂(图1, 表2)。国外相关研究也得出类似的结论(Simpson, 1964; Wilson, 1974; Owen, 1988, 1990; Real et al., 2003)。这一方面是物种资源丰富的反映, 另一方面也暗示了物种丰富度格局成因的复杂性。
统计分析结果表明, 各主要类群物种丰富度与同一环境因子的相关系数存在显著差异, 甚至呈现相反的关系(表3), 说明不同类群的物种丰富度与环境因子的共变趋势并不完全一致。同时, 最优线性模型识别出的主要环境因子也因类群而异, 有些因子(如植被指数、气温年较差等)存在于多数类群的最优线性模型中, 对各类群物种丰富度的空间分布均具显著影响; 而有些因子(如最热月均温)则只出现在个别类群的最优线性模型中。不同类群的物种丰富度与环境因子关系的复杂性, 可能与各类群独特的进化历史及生理适应有关, 这在某些类群中表现得尤为突出。例如, 单因素相关分析中, 兔形目物种丰富度与环境热量因子均呈负相关, 这与兔形目物种特殊的生理机制及对极端条件的适应有关(Feldhamer et al., 2004)。灵长目物种丰富度与气温年较差和最冷月均温的关系最为密切, 这与灵长目多分布于热带、亚热带(Feldhamer et al., 2004), 其物种丰富度受冬季低温限制有关。而作为哺乳类中现存物种数最多的啮齿目, 广泛分布于各种生境类型并分化出相应的适应特征, 其物种丰富度的空间分布则主要受生境异质性影响。物种丰富度格局的主导因子因类群而异, 这说明, 如果地域间哺乳动物的区系组成具有显著差异(即各类群物种所占比例具有显著差异), 物种丰富度格局的主导因子可能发生改变, 这可能是导致以往针对不同地区物种丰富度格局主导因子的研究无法形成一致结论的一个重要原因。
此外, 最优线性模型对各主要类群物种丰富度格局的解释率也有差别(R2adj = 43.0%-79.7%); 某些类群的最优线性模型解释率偏低(如食虫目: R2adj = 43.0%), 仍有相当一部分物种丰富度的地理分异未被解释。这说明, 在探讨哺乳动物及各类群物种丰富度格局的成因时, 仍有一些可能影响物种丰富度空间分布的因素未被涉及, 如局地尺度的环境要素(干扰、捕食、竞争、小生境结构等)以及区域历史对物种丰富度格局形成与演化的影响(Ricklefs, 1987; Ricklefs et al., 1999; Hawkins et al., 2003a; Hawkins & Porter, 2003; Buckley & Jetz, 2007); 对这些因素的研究将有助于更全面地认识物种丰富度格局的形成机制。同时, 不同食性、体型或分布区大小的物种受环境因子的制约也不同, 以此为依据进行分类探讨将有助于更深入地理解物种丰富度地理格局与环境因子的关系(Andrews & O’Brien, 2000; Badgley & Fox, 2000; Jetz & Rahbek, 2002; Ruggiero & Kitzberger, 2004)。
参考文献
Climate, vegetation, and predictable gradients in mammal species richness in Southern Africa
DOI:10.1111/jzo.2000.251.issue-2 URL [本文引用: 2]
Ecological biogeography of North American mammals: species density and ecological structure in relation to environmental gradients
DOI:10.1046/j.1365-2699.2000.00498.x URL [本文引用: 1]
Two decades of homage to Santa Rosalia: toward a general theory of diversity
DOI:10.1093/icb/21.4.877 URL [本文引用: 1]
Toward a metabolic theory of ecology
DOI:10.1890/03-9000 URL [本文引用: 2]
Environmental and historical constraints on global patterns of amphibian richness
DOI:10.1098/rspb.2006.0436
URL
PMID:17327208
[本文引用: 2]

Our knowledge of the broad-scale ecology of vertebrate ectotherms remains very limited. Despite ongoing declines and sensitivity to environmental change, amphibian distributions are particularly poorly understood. We present a global analysis of contemporary environmental and historical constraints on amphibian richness, the first for an ectotherm clade at this scale. Amphibians are presumed to experience environmental constraints distinct from those of better studied endothermic taxa due to their stringent water requirements and the temperature dependence of their energetic costs and performance. Single environmental predictors set upper bounds on, but do not exclusively determine, amphibian richness. Accounting for differing regional histories of speciation and extinction helps resolve triangular or scattered relationships between core environmental predictors and amphibian richness, as the relationships' intercepts or slopes can vary regionally. While the magnitude of richness is strongly determined by regional history, within-region patterns are consistently jointly driven by water and temperature. This confirms that ecophysiological constraints extend to the broad scale. This coupling suggests that shifts in climatic regimes will probably have dramatic consequences for amphibians. Our results illustrate how the environmental and historical explanations of species richness gradients can be reconciled and how the perspectives are complements for understanding broad-scale patterns of diversity.
Climate, energy and diversity
The ecological regulation of species diversity
DOI:10.1086/282335 URL [本文引用: 1]
Energy and large-scale patterns of animal- and plant-species richness
DOI:10.1086/285144 URL [本文引用: 4]
Large-scale biogeographical patterns of species richness of trees
DOI:10.1038/329326a0 URL [本文引用: 2]
NDVI-derived land cover classifications at a global scale
DOI:10.1080/01431169408954345 URL [本文引用: 1]
Macro-scale bird species richness patterns of the East Asian mainland and islands: energy, area and isolation
DOI:10.1111/jbi.2006.33.issue-4 URL [本文引用: 2]
Spatial autocorrelation and red herrings in geographical ecology
DOI:10.1046/j.1466-822X.2003.00322.x URL [本文引用: 1]
Modifying the t-test for assessing the correlation between two spatial processes
DOI:10.2307/2532625 URL [本文引用: 5]
Water balance and distribution of vegetation (Climate and vegetation of China III)
DOI:10.1007/BF02348460 URL [本文引用: 1]
Mammalogy: Adaptation, Diversity, Ecology, 2nd edn
A globally consistent richness-climate relationship for angiosperms
DOI:10.1086/368223
URL
PMID:12776882
[本文引用: 1]
Species richness, the simplest index of biodiversity, varies greatly over broad spatial scales. Richness-climate relationships often account for >80% of the spatial variance in richness. However, it has been suggested that richness-climate relationships differ significantly among geographic regions and that there is no globally consistent relationship. This study investigated the global patterns of species and family richness of angiosperms in relation to climate. We found that models relating angiosperm richness to mean annual temperature, annual water deficit, and their interaction or models relating richness to annual potential evapotranspiration and water deficit are both globally consistent and very strong and are independent of the diverse evolutionary histories and functional assemblages of plants in different parts of the world. Thus, effects of other factors such as evolutionary history, postglacial dispersal, soil nutrients, topography, or other climatic variables either must be quite minor over broad scales (because there is little residual variation left to explain) or they must be strongly collinear with global patterns of climate. The correlations shown here must be predicted by any successful hypothesis of mechanisms controlling richness patterns.
Global patterns in biodiversity
DOI:10.1038/35012228
URL
PMID:10821282
[本文引用: 2]
To a first approximation, the distribution of biodiversity across the Earth can be described in terms of a relatively small number of broad-scale spatial patterns. Although these patterns are increasingly well documented, understanding why they exist constitutes one of the most significant intellectual challenges to ecologists and biogeographers. Theory is, however, developing rapidly, improving in its internal consistency, and more readily subjected to empirical challenge.
Productivity and history as predictors of the latitudinal diversity gradient of terrestrial birds
DOI:10.1890/0012-9658(2003)084[1608:PAHAPO]2.0.CO;2 URL [本文引用: 3]
Energy, water, and broad scale geographic patterns of species richness
DOI:10.1890/03-8006 URL [本文引用: 5]
Relative influences of current and historical factors on mammal and bird diversity patterns in deglaciated North America
DOI:10.1046/j.1466-822X.2003.00060.x URL [本文引用: 1]
On species-area relations
DOI:10.1086/285950 URL [本文引用: 1]
2008 IUCN Red List of Threatened Species
http://www.iucnredlist.org, accessed Mar 25, 2009.
Geographic range size and determinants of avian species richness
DOI:10.1126/science.1072779
URL
PMID:12202829
[本文引用: 1]
Geographic patterns in species richness are mainly based on wide-ranging species because their larger number of distribution records has a disproportionate contribution to the species richness counts. Here we demonstrate how this effect strongly influences our understanding of what determines species richness. Using both conventional and spatial regression models, we show that for sub-Saharan African birds, the apparent role of productivity diminishes with decreasing range size, whereas the significance of topographic heterogeneity increases. The relative importance of geometric constraints from the continental edge is moderate. Our findings highlight the failure of traditional species richness models to account for narrow-ranging species that frequently are also threatened.
Habitat heterogeneity as a determinant of mammal species richness in high-energy regions
DOI:10.1038/385252a0 URL [本文引用: 4]
Remotely sensed habitat diversity predicts butterfly species richness and community similarity in Canada
DOI:10.1073/pnas.201398398 URL [本文引用: 1]
Environmental determinants of faunal diversity
DOI:10.1086/282092 URL [本文引用: 1]
Niche size and faunal diversity
DOI:10.1086/282130 URL [本文引用: 1]
Global patterns of tree species richness in moist forests: energy diversity theory does not account for variation in species richness
DOI:10.2307/3545479 URL [本文引用: 1]
Global scale patterns of fish species richness in rivers
DOI:10.1111/eco.1995.18.issue-4 URL [本文引用: 1]
Water-energy dynamics, climate, and prediction of woody plant species richness: an interim general model
DOI:10.1046/j.1365-2699.1998.252166.x URL [本文引用: 1]
On productivity as a predictor of rodent and carnivore diversity
DOI:10.2307/1941270 URL [本文引用: 1]
Patterns of mammalian species richness in relation to temperature, productivity, and variance in elevation
DOI:10.2307/1381311 URL [本文引用: 1]
Latitudinal gradients in species diversity: a review of concepts
DOI:10.1086/282398 URL [本文引用: 2]
Large-scale processes and the Asian bias in species diversity of temperate plants
DOI:10.1038/35025052
URL
PMID:11001054
[本文引用: 1]
An important issue in the study of biodiversity is the extent to which global patterns of species richness reflect large-scale processes and historical contingencies. Ecological interactions in local assemblages may constrain the number of species that can coexist, but differences in diversity in similar habitats within different regions (diversity anomalies) suggest that this limit is not firm. Variation in rate of species production could influence regional and perhaps local diversity independently of the ecological capacity of an area to support coexisting species, thereby creating diversity anomalies. Temperate Zone genera of plants that are disjunct between similar environments in eastern Asia and eastern North America (EAS-ENA) have twice as many species in Asia as in North America. Because lineages of these genera in Asia and North America are mostly sister pairs, they share a common history of adaptation and ecological relationship before disjunction. Thus, the diversity anomaly in EAS-ENA genera is not an artefact of taxon or habitat sampling but reflects differences in the net diversification (speciation-extinction) of the lineages in each of the continents. Here we propose that the most probable cause of the EAS-ENA anomaly in diversity is the extreme physiographical heterogeneity of temperate eastern Asia, especially compared with eastern North America, which in conjunction with climate and sea-level change has provided abundant opportunities for evolutionary radiation through allopatric speciation.
Environmental determinants of amphibian and reptile species richness in China
DOI:10.1111/j.0906-7590.2007.05025.x URL [本文引用: 3]
R: A Language and Environment for Statistical Computing
Multiscale assessment of patterns of avian species richness
DOI:10.1073/pnas.071034898 URL [本文引用: 2]
Relative importance of environment, human activity and spatial situation in determining the distribution of terrestrial mammal diversity in Argentina
DOI:10.1046/j.1365-2699.2003.00871.x URL [本文引用: 1]
Species richness, environmental correlates, and spatial scale: a test using South African birds
DOI:10.1086/339464
URL
PMID:18707437
[本文引用: 1]
Energy and habitat heterogeneity are important correlates of spatial variation in species richness, though few investigations have sought to determine simultaneously their relative influences. Here we use the South African avifauna to examine the extent to which species richness is related to these variables and how these relationships depend on spatial grain. Taking spatial autocorrelation and area effects into account, we find that primary productivity, precipitation, absolute minimum temperature, and, at coarser resolutions, habitat heterogeneity account for most of the variation in species richness. Species richness and productivity are positively related, whereas the relationship between potential evapotranspiration (PET) and richness is unimodal. This is largely because of the constraining effects of low rainfall on productivity in high-PET areas. The increase in the importance of vegetation heterogeneity as an explanatory variable is caused largely by an increase in the range of vegetation heterogeneity included at coarse resolutions and is probably also a result of the positive effects of environmental heterogeneity on species richness. Our findings indicate that species richness is correlated with, and hence likely a function of, several variables, that spatial resolution and extent must be taken into account during investigations of these relationships, and that surrogate measures for productivity should be interpreted cautiously.
Community diversity: relative roles of local and regional processes
DOI:10.1126/science.235.4785.167
URL
PMID:17778629
[本文引用: 2]
The species richness (diversity) of local plant and animal assemblages-biological communities-balances regional processes of species formation and geographic dispersal, which add species to communities, against processes of predation, competitive exclusion, adaptation, and stochastic variation, which may promote local extinction. During the past three decades, ecologists have sought to explain differences in local diversity by the influence of the physical environment on local interactions among species, interactions that are generally believed to limit the number of coexisting species. But diversity of the biological community often fails to converge under similar physical conditions, and local diversity bears a demonstrable dependence upon regional diversity. These observations suggest that regional and historical processes, as well as unique events and circumstances, profoundly influence local community structure. Ecologists must broaden their concepts of community processes and incorporate data from systematics, biogeography, and paleontology into analyses of ecological patterns and tests of community theory.
Global patterns of tree species richness in moist forest: distinguishing ecological influences and historical contingency
DOI:10.2307/3546454 URL [本文引用: 1]
Energy, water and large-scale patterns of reptile and amphibian species richness in Europe
DOI:10.1016/j.actao.2005.02.006 URL [本文引用: 2]
The echo pattern of species diversity: pattern and processes
DOI:10.1111/eco.1999.22.issue-6 URL [本文引用: 1]
Environmental correlates of mammal species in South America: effects of spatial structure, taxonomy and geographic range
DOI:10.1111/eco.2004.27.issue-4 URL [本文引用: 3]
The status of the world’s land and marine mammals: diversity, threat, and knowledge
DOI:10.1126/science.1165115
URL
PMID:18845749
[本文引用: 1]
Knowledge of mammalian diversity is still surprisingly disparate, both regionally and taxonomically. Here, we present a comprehensive assessment of the conservation status and distribution of the world's mammals. Data, compiled by 1700+ experts, cover all 5487 species, including marine mammals. Global macroecological patterns are very different for land and marine species but suggest common mechanisms driving diversity and endemism across systems. Compared with land species, threat levels are higher among marine mammals, driven by different processes (accidental mortality and pollution, rather than habitat loss), and are spatially distinct (peaking in northern oceans, rather than in Southeast Asia). Marine mammals are also disproportionately poorly known. These data are made freely available to support further scientific developments and conservation action.
Biological determinants of species diversity
DOI:10.2307/2845026 URL [本文引用: 1]
Species density of North American recent mammals
DOI:10.2307/2411825 URL [本文引用: 2]
The latitudinal gradient in geographical range: how so many species coexist in the tropics
DOI:10.1086/284913 URL [本文引用: 3]
An approach toward a rational classification of climate
Analysis of determinants of mammalian species richness in South America using spatial autoregressive models
DOI:10.1111/eco.2004.27.issue-4 URL [本文引用: 2]
Does solar energy control organic diversity? Butterflies, moths and the British climate
DOI:10.2307/3565855 URL [本文引用: 1]
Contrasting spatial and temporal global change impacts on butterfly species richness during the 20th century
DOI:10.1111/j.2006.0906-7590.04685.x URL [本文引用: 1]
Scale and species richness: towards a general, hierarchical theory of species diversity
DOI:10.1046/j.1365-2699.2001.00563.x URL [本文引用: 1]
China Species Information System (CSIS) (中国物种信息服务)
http://www.chinabiodiversity.com. (in Chinese)
Analytical zoogeography of North American mammals
Species-energy theory: an extension of species-area theory
DOI:10.2307/3544109 URL [本文引用: 5]
The distribution tendency of land mammals in China and adjacent areas
The relationships between terrestrial vertebrate species richness in China’s nature reserves and environmental variables
DOI:10.1139/z06-132 URL [本文引用: 1]
Patterns of fish species richness in China’s lakes
DOI:10.1111/geb.2006.15.issue-4 URL [本文引用: 1]
