


种—面积关系(species-area relationship)(或种—面积曲线 species-area curve)描述的是物种数量随取样面积增加而变化的规律, 是群落生态学研究的一个基本问题, 被认为是“生态学中少有的几个真正的定理之一”(Lomolino, 2000)。种—面积关系隐含着复杂的生态过程, 与物种的形成、灭绝和迁移扩散等生态过程密切相关(Chave et al., 2002; Zurlini et al., 2002; Ricklefs & Bermingham, 2004)。取样面积的扩大使研究样地包含更多的生境类型及生境的异质性增加(Williams, 1964; Baldi, 2007; Kallimanis et al., 2008); 在相对均质的地段, 取样面积的增加意味着包含更多的个体(Durrett & Levin, 1996); 在更大的尺度还有可能包含一些只发生在大尺度的进化或生态过程(Losos & Schlu- ter, 2000), 这些因素都有可能引起物种数量的增 加。
种—面积关系是生物多样性尺度转换的重要依据(Arita & Rodriguez, 2002; Willig et al., 2003; Sarr et al., 2005), 常被用于估算群落或区域的物种多样性, 评价区域生物多样性的丧失状况(Ney-Nifle & Mangel, 2000; Malcolm et al., 2006; Harte et al., 2009)等, 因而是生物多样性区域保护设计以及生物多样性评价的重要基础(Storch et al., 2005; Fridley et al., 2005, 2006)。种—面积关系的构建方式、尺度效应以及区域分异等对于生物多样性的尺度转换、区域生物多样性的估算和生境丧失对生物多样性的影响评价等具有重要的影响(Fridley et al., 2005; Drakare et al., 2006)。本文主要介绍植物群落种—面积关系的构建方式、尺度效应、区域分异及其与种—多度分布的联系, 并利用组合样方系列构建的种—面积关系估算了秦岭山地不同地段种子植物的多样性。
1 种—面积关系的起源与发展
面积对物种多样性的影响是生态学中最早被关注的问题之一(Jaccard, 1912)。定量的种—面积关系首先由Arrhenius(1921, 1923)提出, 他针对不同群落的巢式样方系列, 发现物种数量(S)与取样面积(A)成幂函数关系, 提出了幂函数种—面积关系(power-law species-area relationship), 即:
其中, c和z为常数, 后来常被用来分别表述α和β多样性。
Gleason(1922, 1925)将同等面积的样地组合成不同大小的样方系列, 提出对数种—面积关系 (logarithm species-area relationship), 即:
其中, a和b为常数。
由此引发了两者关于种—面积关系模型的第一次讨论。其后, 人们在不同区域, 针对不同的类群, 采用不同方法, 提出了一系列描述种—面积关系的方程, 详见Tjorve (2003)的综述。
早期的种—面积关系研究主要依据野外调查数据进行统计分析。到了20世纪40年代, 科学家们开始利用种—多度分布(即物种个体数量的频率分布)来推导种—面积关系(Fisher et al., 1943; Williams, 1944; MacArthur, 1957; Preston, 1962a,b; He & Legendre, 1996, 2002), 赋予了种—面积关系统计学基础及与之相联系的生物学和生态学意义, 并引发了种—面积关系(及种—多度分布)的第二次讨论(Connor & McCoy, 1979)。
20世纪60年代, MacArthur和Wilson(1967)提出了岛屿生物地理学平衡理论, 试图将岛屿上的进化过程与物种丰富度建立联系。该理论认为岛屿的物种数量主要取决于岛屿大小、隔离程度等非生物因素, 其中面积对物种数量的影响可以通过幂函数种—面积关系来描述, 其斜率(z值)主要体现了岛屿之间的隔离程度, 在具有相同种库的前提下, 斜率一般为0.25左右。
20世纪70年代, 局域尺度上的种—面积关系主要关注种—面积关系与群落中性理论的联系。岛屿生物地理学的平衡理论被认为是中性理论的早期雏形(Leigh, 2007)。70年代中期, Caswell(1976)提出了森林群落的中性模型, 并从群落的种—多度分布推导出幂函数种—面积关系。Hubbell(2001)将物种形成、灭绝、迁移、生态漂变等过程与种—面积关系联系起来, 极大地推动了中性理论的发展, 并推导出从局地群落(local community)到集合群落(meta-community)的三段式种—面积关系。随后不少研究在种—多度分布的基础上增加了物种的空间分布特征(如He & Legendre, 2002; Hovestadt & Poethke, 2005)、物种形成速率(Pigolotti & Cencini, 2009)以及扩散距离(Hovestadt & Poethke, 2005; Allouche & Kadmon, 2009)等参数, 支持了中性理论对物种时空变化的预测。但也有部分研究不支持中性理论对种—面积关系的预测, 如Chave等(2002)比较了中性模型和非中性模型所预测的种—多度分布和种—面积关系, 发现两种模型可产生相似的种—多度分布和种—面积关系。相对于种—多度分布而言, 种—面积关系并不能完全支持群落中性理论, 因而并没有像种—多度分布一样被广泛地用于检验中性理论(Leigh, 2007)。
进入20世纪80年代, 人们开始更多地从区域尺度关注种—面积关系与时间(Adler & Lauenroth, 2003; Fridley et al., 2006)、生境异质性(Triantis et al., 2003)以及能量(Wright, 1983; Pastor et al., 1996)之间的联系。
种—时间—面积关系: 物种在有限的地点并非长期固定存在, 因此每次即时的取样(snapshot)不能完全获取该样地所有的物种多样性信息, 同时从进化的角度来看, 时间延长有可能有更多的物种形成, 因此物种多样性随着调查时间(或进化时间)的累积不断增加,这种时间累积对物种多样性的影响称之为种—时间关系(Preston, 1960; Rosenzweig, 1995; Adler, 2004)。时间对多样性的影响在动物群落(特别是鸟类)中表现明显(Preston, 1960)。在季节动态或年际变化明显的生态系统中也有所体现, 如Adler和Lauenroth (2003)、Adler(2004)分析了Kansas草地多年的种—面积关系调查数据, 认为种—时间关系和种—面积关系对等, 均符合幂函数关系, 由此将时间和空间整合, 提出种—时间—面积关系(Species-time- area relationship, Adler et al., 2005)。Fridley等(2006)比较了不同区域森林群落的调查时间对种—面 积关系的影响, 认为调查时间和强度对种—面 积关系在小尺度上的差异(z值的差异)具有显著影响。
种—面积—生境关系: 在大多数情况下, 生境异质性随着面积的增加而增加, Triantis等(2003)认为面积与生境异质性对物种多样性的影响并不矛盾, 从而提出了种—面积—生境关系,
式中, S为物种数, A为岛屿面积, H为岛屿上的生境类型数量。
种—面积—能量关系: 种—面积关系在不同的区域差异显著, 其中一个重要的原因在于种—面积关系与研究区域的能量状况具有密切联系。Wright(1983)认为能量和面积对多样性具有共同的作用, 从而将种—面积关系扩展为种—面积—能量关系, 认为岛屿上的物种数与该岛屿以及岛屿的能量总量(由平均能量与岛屿面积的乘积表示)成幂函数关系, 即:
式中, S为物种数, A为岛屿面积, E为岛屿的平均能量。
然而, 种—面积—能量关系在不同的尺度不如种—时间—面积关系那样具有一致性, 如Weiher(1999)在小尺度(0.25-150 m2), Qian等(2007)在中尺度隔离生境中的种—面积关系研究中, 发现幂函数种—面积关系的斜率(z值)与能量成正比; 而Pastor等(1996)在对小尺度(0.25-9 m2)的种—面积关系的调查中, 却得出斜率随着能量的增加而减小的结论。Storch等(2005)与Lyons和Willig(2002)在大尺度(1,000-25,000 km2; 676-43,000 km2)的巢式样方研究中, 发现斜率与能量成反比。
2 种—面积关系的构建方式与常见的种—面积关系
2.1 种—面积关系的构建方式
种—面积关系主要通过以下方式构建: 巢式样方、组合样方以及隔离生境(Scheiner, 2003)。
(1)巢式样方: 按一定规则不断扩大取样面积, 其中大面积样方一定包含了小面积样方, 从而构建巢式样方种—面积关系(图1 A)。巢式样方是构建种—面积关系的最主要方式, 其尺度可从群落(如Arrhenius, 1921; Pastor et al., 1996; Weiher, 1999)到区域乃至大洲(如Lyons & Willig, 2002; Storch et al., 2005; Fridley et al., 2005)。
图1
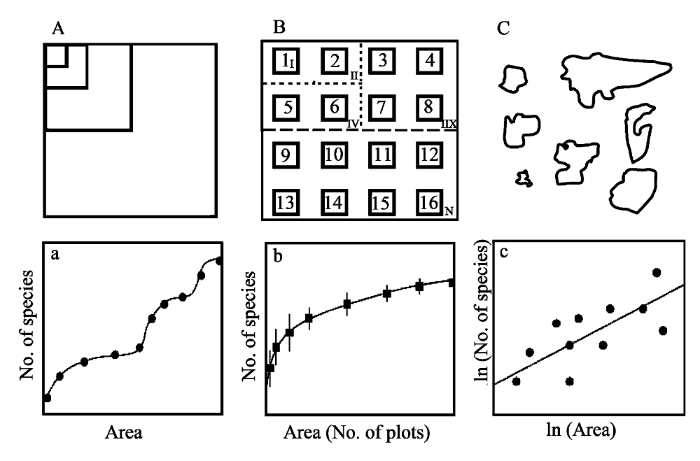
图1
构建种—面积关系的3种主要方式。A和a分别为巢式样方及其对应的种—面积关系; B和b分别为组合样方及其对应的种—面积关系; C和c分别为隔离生境及其对应的种—面积关系(c)。根据Scheiner(2003)修改。
Fig. 1
Three types of species-area relationships. A, B, C, represent nested plots, quadrates combination, and isolated patches, respectively; and a, b, c, represent the corresponding species-area curves (revised from Scheiner, 2003).
(2)组合样方: 对面积相同的样方进行随机组合, 形成不同面积的样方组合系列, 与不同样方组合中出现的物种数一起构建种—面积关系, 面积主要由所包含的样地数目决定(图1B)。具体操作为: 设样方序号分别为1, 2, …, n (n为样方总数), 将这n个样方逐个合并, 如合并后的第I号样地只包含原1号样方(面积为1), 合并后的第II号样地包含1、2号2个样方(面积为2), 依此类推, 合并后的第N号样方包含了1, 2, …, n号共n个样方(面积为n); 以合并后样地(I, II, … N)所包含的样方数目(1, 2, 3, … n)为面积, 与其中包含的物种数构建种—面积关系(McCune & Grace, 2002)。
组合样方系列是最早构建种—面积关系的方式(如Gleason, 1922), 尤其在20世纪90年代种库理论提出后应用更为普遍, 其研究尺度也从群落扩展到区域, 以估算区域物种多样性(Ugland et al., 2003)。根据原始样方分布的连续性以及样方组合时的邻域性, 组合样方系列的种—面积关系可以细分为4种亚类: 连续样方的完全随机组合、连续样方的邻域随机组合、非连续样方的完全随机组合与非连续样方的邻域随机组合, 详见Scheiner(2003)的综述。
(3)隔离生境: 对不同面积的斑块及其所包含的物种数构建的种—面积关系, 又称岛屿型种—面积关系(island species-area relationship) (图1C)。在这种情形下, 面积系列并非经过调查设计, 而取决于斑块(岛屿)大小本身, 岛屿型种—面积关系的最经典的例子是岛屿生物地理学的平衡理论(MacArthur & Wilson, 1967)。
综上, 巢式样方系列和组合样方系列中, 大面积样方(或样方组合)包含了小面积样方(或样方组合), 因而大面积样方的物种也一定包含了小面积样方的物种, 种—面积关系是单调增加的(图1a,b), 故又被称为物种累计曲线(species accumulation curve; Gray et al., 2004); 而隔离生境系列种—面积关系中, 大斑块不包含小斑块, 大斑块所包含的物种也不一定包含了小斑块内的物种, 其种—面积关系不一定是单调上升的(图1c)。
2.2 常见的种—面积关系模型
受种—面积关系的构建方式、研究类群属性以及区域气候等影响, 生态学家们提出了多达上百种种—面积关系的拟合方程。在这些方程中, 幂函数方程、对数方程和逻辑斯蒂曲线由于简单适用, 同时各参数都具有明确的生物学意义, 因而被广泛接受(Connor & McCoy, 1979; Tjorve, 2003)。式(1)和式(2)分别描述了幂函数和对数种—面积关系; 与幂函数和对数种—面积关系不同, 逻辑斯蒂种—面积关系认为随取样面积的增加, 物种数量具有极限值。物种数先迅速增加, 随后缓慢增加并最终稳定不变, 物种数与面积之间符合逻辑斯蒂曲线(式5, Archibald, 1949)
式中, S为物种数, A为面积, a, b, c为常数。
在这3种模型中, 幂函数被广泛应用到不同尺度(0.1 m2至105 km2)的巢式样方系列(Arrhenius, 1921; Kilburn, 1963; Fridley et al., 2005, 2006)和岛屿型的种—面积关系(MacArthur & Wilson, 1967) 中。虽然样地所处的气候条件差异很大, 植被类型也不同, 但幂函数种—面积关系具有相对稳定的幂指数(0.2-0.5之间), 如Fridley等(2005)对北美1,400多个巢式样方的种—面积关系进行拟合, 发现95%的幂指数值(z)在0.22-0.54之间(图2)。幂函数种—面积关系的截距(c)一般被认为是单位面积(即面积为1时)的物种数, 表达了α多样性, 其斜率z为随面积增加而引起的物种增加速率, 是β多样性的一种表达方式。
图2
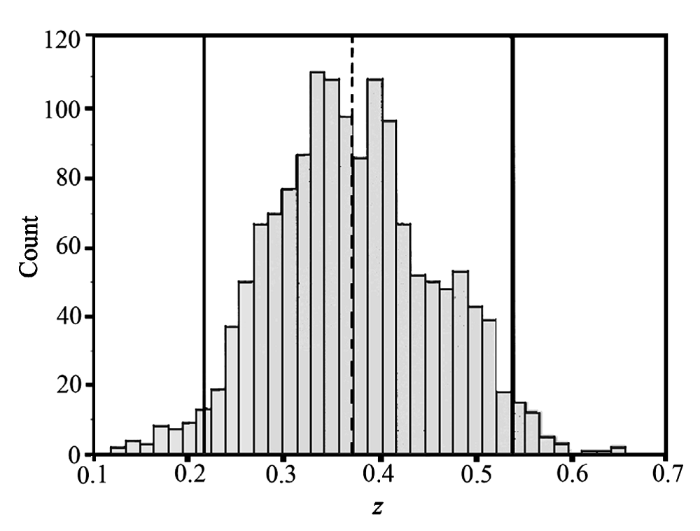
图2
北美东南部1,472个巢式样方(0.01-1,000 m2)幂函数种—面积关系斜率(z值)的频率分布, 分段间隔为0.015, 垂直虚线为斜率的均值(0.372), 实线(0.217, 0.538)为95%置信区间(Fridley et al., 2005)。
Fig. 2
The frequency distribution of slopes of species-area relationship for 1,472 nested plots in southwest North America. The dashed line represents the mean slope (0.372), the solid lines (0.217, 0.538) are the threshold with 95% confidence (Fridley et al., 2005).
对数函数主要应用于中尺度的组合样方系列 (Gleason, 1922; Bartha & Ittzes, 2001; Ugland et al., 2003); 而逻辑斯蒂曲线则常应用于中小尺度的巢式样方系列(Archibald, 1949; He & Legendre, 1996),同时也适用于源于同一种库的岛屿型种—面积关系(Natuhara & Imai, 1999)。
3 种—多度分布与种—面积关系
理论上, 生物群落的种—面积关系可以完全只由种—多度分布和物种的空间分布导出, 非生物环境(如气候)、生物属性(如物种的扩散距离)、生态或进化过程(如物种形成速率)等主要通过影响群落内的种—多度分布或者物种的空间分布间接影响种—面积关系(He & Legendre, 1996, 2002; Plotkin et al., 2000a; Allouche & Kadmon, 2009; Pigolotti & Cencini, 2009)。
在均质生境中, 样方所包含的个体数目与取样面积成正比, 因此该面积包含的物种数主要取决于所有个体在不同物种之间的分配, 即种—多度分布(He & Legendre, 1996, 2002)。
迄今为止, 已经发展了数十种种—多度分布模型, 这些模型依照其推导过程可划分为统计模型、种群动态模型、生态位分化模型、空间分布模型等。理论上讲, 这些模型与群落内物种之间的竞争、扩散模式以及资源分配等生态过程具有密切的关系, 不同的种—多度分布模型可能体现了群落中不同生态过程对群落内物种分布的影响(详细综述见McGill et al., 2007), 因此成为检验群落中性理论的重要依据(Hubbell, 2001)。然而, 由于这些模型之间的差异过于细微, 经验数据本身的误差就有可能超出这些模型的预测区别。如Chave等(2002)比较了中性模型和非中性模型所预测的种—多度分布, 发现这两种模型可产生相似的种—多度分布。因此不同的模型往往难以直接与某一特定的生态过程相对应(McGill et al., 2007)。
以下介绍群落中最为常见, 也是早期争议最大的两种种—多度分布模型(对数级数分布和对数正态分布)及其所对应的种—面积关系。
(1) 对数级数分布: 它是群落中种—多度分布最为普遍的方式之一(Fisher et al., 1943; Williams, 1944), 群落中多度为n的物种数可表述为α×xn/n (其中α为Fisher多样性指数; x 为小于1且与取样面积相关的常数)。一般调查尺度较小的、破坏严重的、或者先锋群落具有对数系列的种—多度分布(Hughes, 1986)。这类群落一般具有较多的稀有种(rare species), 而丰富种(abundant species)较少, 可能产生对数型种—面积关系, 但其截距和斜率取决于物种的扩散能力(Fisher et al., 1943; He & Legendre, 1996, 2002)。
(2) 对数正态分布: 它是群落内种—多度分布的另一种常见方式, 群落内具有中等数量个体(密度)的种类最多(Preston, 1962a; McGill & Collins, 2003)。Preston (1948)认为群落内种—多度分布应该符合经典的对数正态分布, Fisher所提出的对数级数种—多度分布只是群落内的局部取样。对数正态的种—多度分布一般出现于较大尺度内的、稳定的、达到平衡状态的群落, 特别是物种极其丰富的群落, 如热带雨林(Hughes, 1986; He & Legendre, 2002)。具有对数正态种—多度分布的群落可以推导出幂函数种—面积关系(Preston, 1962a; May, 1975), 但其参数与物种分布的聚集程度密切相关(He & Legendre, 1996, 2002)。
Hubbell(2001)在其群落中性理论中提出了集合群落(meta-community)的概念, 认为Fisher的对数级数分布是集合群落的抽样分布, 而Preston的对数正态分布描述的是局域群落(local community)的分布。
除了种—多度分布对种—面积关系的影响外, He和Legendre(2002)还发现, 物种在空间分布上聚集程度越高, 小面积中可观察的物种会越少, 物种数随面积增加的速率会下降, 即具有较小的斜率。Tjorve等(2008)发现, 物种聚集程度主要影响种—面积曲线的中间部分, 而对两端影响不大; 稀有种对种—面积关系形状的影响比丰富种大; 丰富种的聚集程度只会在很小的尺度上影响曲线的斜率, 稀有种的聚集程度在较大尺度上改变种—面积曲线斜率。
4 种—面积关系的尺度效应与区域分异
4.1 种—面积关系的尺度效应
在不同尺度, 影响生物多样性分布格局的因素不同(Schmida & Wilson, 1985; Turner & Tjorve, 2005; Londono-Cruz & Tokeshi, 2007), 因此种—面积关系表现出明显的尺度效应, 主要体现在幂函数种—面积关系的斜率(即幂指数z值)在不同尺度上的差异(Palmer & White, 1994; Rosenzweig, 1995; Lomolino, 2001; Allen & White, 2003; Fridley et al., 2005)。幂函数种—面积关系的这一变化规律最早由Preston(1960)提出, 他在系统论述群落内种—多度分布规律后, 认为幂函数的种—面积关系在不同的尺度具有不同的斜率, 在双对数坐标轴上为“S”形, 并据此提出了“三段式种—面积关系(triphasic species-area relationship)”(图3)。三段式种—面积关系认为群落到局域尺度的种—面积关系受取样效应以及随机过程等因素的影响, 斜率较大(图3 Phase 1); 景观到区域尺度的种—面积关系主要受生境异质性影响, 斜率较小(图3 Phase 2); 而在区域到洲际以至到全球尺度, 由于包含了不同的生物地理区以及不同的种库, 斜率较大(图3 Phase 3)。Rosenzweig(1995)将种—面积关系按照其空间尺度归纳为三类: 生物地理区之间(between biogeographical provinces)、生物地理区内(within biogeographical provinces)以及岛屿(或隔离生境斑块)种—面积关系, 其斜率(z值)分别在0.5-1, 0.1-0.2和0.2-0.5之间。
图3
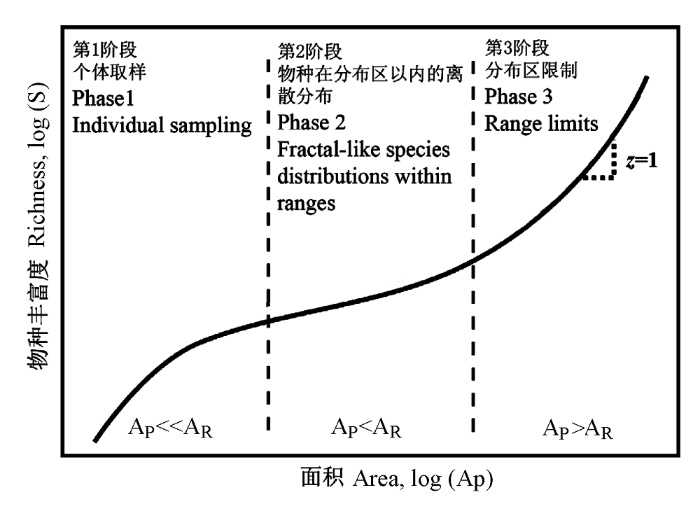
图3
不同尺度的种—面积关系及主要影响因素。在双对数坐标轴上, 随着取样面积的增加, 幂函数种—面积关系表现出3个阶段: 在小尺度(调查面积AP远小于物种平均分布范围AR), 斜率(z值)较大; 在中尺度(AP小于AR), 斜率较小; 而在大尺度(AP大于AR), 斜率又开始增加(修订自Allen & White, 2003)。
Fig. 3
Species-area relationship and main factors influencing the slopes at different scales. The power-law species area relationship showed three phases: large z-values at micro-scale (with plot area, AP, much smaller than the mean range size, AR); small z-values at the meso-scale (AP smaller than AR), and large z-values at the macro-scale (AP larger than AR) (revised from Allen & White, 2003).
4.2 种—面积关系的区域分异
除了研究尺度以外, 区域气候、生境异质性、植被以及地质历史过程等因素对种—面积关系也有显著影响(Lyons & Willig, 2002; Ricklefs & Bermingham, 2004; Drakare et al., 2006; Kalmar & Currie, 2006; Qian et al., 2007; Kreft et al., 2008)。
幂函数种—面积关系的斜率(z值)是物种多样性面积效应的直接体现, 它虽然稳定在一定的范围内(Rosenzweig, 1995; Fridley et al., 2005), 但在不同的区域体现出显著的差异。一般而言, 物种在低纬度气候适宜的区域周转快(Koleff et al., 2003), 物种多样性更依赖于生境的异质性(Kerr & Paker, 1997), 面积或生境多样性对物种多样性的影响要比气候严酷地区更为显著, 因此其斜率(z)大于气候严酷的地区(Wright, 1983; Weiher, 1999; Drakare et al., 2006; Kalmar & Currie, 2006; Qian et al., 2007; Wang et al., 2009); 相对于大陆而言, 岛屿生物的迁移能力一般较弱, 分布幅度较小, 因此受面积的影响更为强烈, 其种—面积关系的斜率(z)高于大陆(Preston, 1962a; Drakare et al., 2006; Kreft et al., 2008)。
种—面积关系的区域分异特征在不同的类群和尺度具有显著的差异, 如Qian等(2007)发现, 北美大陆植物种—面积关系的斜率(z)随纬度增加而减小, 而Lyons和Willig(2002)、Storch等(2005)的研究均表明, 动物群落种—面积关系的斜率随纬度的增加而增加。Soininen等(2007)认为尺度是造成这种差异的主要原因, 尺度大时(>1 km2), 斜率随着纬度增加而增加, 尺度小时(<1 km2)则随纬度增加而减小。但即使同为小尺度(0.1-100 m2)的巢式样方, Weiher(1999)与Pastor等(1996)也得出截然相反的结论。这些研究结果均表明: 虽然种—面积关系沿气候梯度可能具有某种显著的格局, 但其具体的变化方式还有待进一步的研究。
种—面积关系的尺度效应和区域分异表明: 简单地利用区域尺度的种—面积关系来估算更大区域的多样性将会导致严重的低估(Rosenzweig, 2001; Collins et al., 2002)。
5 种—面积关系的应用
早期的种—面积关系主要用于比较不同区域的生物多样性以及确定群落的最小表现面积和适宜的取样调查强度(Cain, 1938)。随后, 外推估算较大区域的物种多样性成为长期以来种—面积关系的主要应用方向(Hopkins, 1957; Connor & McCoy, 1979; Usher, 1979; Plotkin et al., 2000b)。但由于种—面积关系的尺度效应, 巢式样方系列的种—面积关系不适合于外推估算大面积的物种数量(Collins et al., 2002)。
20世纪90年代群落生态学的种库假说(Zobel, 1997)提出以后, 估算区域的种库一直成为一个难题(Peet et al., 2003)。受区域气候、局域种库等的影响, 区域内(intra-provincial)种—面积关系不适宜外推区域多样性; 而区域之间(inter-provincial)种—面积关系由于包含了各种可能出现的生境及其局域种库, 因此可以有效估算更大区域的多样性(Rosenzweig, 2001)。研究表明, 利用组合样方系列构建包含多个区域的种—面积关系, 可有效估算较大区域的生物多样性, 从而为估算群落种库和区域种库提供新的思路和途径(Inouye, 1998; Bartha & Ittzes, 2001; Quigley & Platt, 2003; Ugland et al., 2003; Mao et al., 2005)。
种—面积关系的另一个主要应用方向在于比较不同区域的生物多样性以及选择生物多样性的保护优先区(Rahbek & Graves, 2000; Willig et al., 2003)。在比较不同区域的生物多样性时, 由于面积不同, 比较时需要利用种—面积关系对记录的生物多样性进行校正, 种—面积关系是对不同面积条件的多样性进行比较的基础。例如, Rahbek和Graves (2000)利用种—面积关系将多样性调整为等面积情况下, 比较了不同尺度南美洲鸟类多样性的分布格局。Fattorini(2006)利用爱琴群岛(Aegean Islands)不同岛屿的面积与甲虫多样性之间的关系, 依据种—面积关系的残差大小确定了该群岛生物多样性保护的热点地区。
在全球变化的背景下, 种—面积关系常被用于估算由于生境丧失或者碎裂化所引起的全球或区域生物多样性的丧失(Pimm et al., 1995; Pimm & Raven, 2000; Lewis, 2006; Pereira & Daily, 2006)。例如Thomas等(2004)和Malcolm等(2006)利用幂函数种—面积关系分别推算了气候变化引起的生境丧失或生境质量变化所造成的全球生物多样性与特有种的丧失。全球变化的另一种表现是生物入侵。利用区域间以及区域内的种—面积关系, 可以有效评价生物跨区域交流(或生物入侵)对全球或区域生物多样性的影响(Collins et al., 2002)。如McKinney(1998)评价了生物入侵对全球生物多样性的影响, 认为最终全球生物入侵可能会引起近60%的物种丧失, 而Rosenzweig(2001)则认为生物入侵在增加区域生物多样性的同时, 从长远看并不会引起全球生物多样性的丧失。
6 研究实例: 利用组合样方系列构建的种—面积关系估算秦岭山地的物种数
为了检验利用组合系列种—面积关系估算区域生物多样性的可行性, 我们利用秦岭山脉东、中、西段大量的群落调查资料, 估算秦岭山地不同地段和整个区域的物种数, 并与实际记录的物种数进行对比。作者曾在秦岭东(牛背梁自然保护区: 108.9°E, 33.8°N, 2,802 m)、中(太白山自然保护区: 107.6°E, 33.9°N, 3,767 m)、西段(甘肃小陇山头二三滩自然保护区: 106.3°E, 33.5°N, 2,446 m)的南北坡沿海拔梯度每隔50 m 设置1个20 m×30 m 的样方, 共调查样方248个(其中牛背梁自然保护区51个, 太白山自然保护区156个, 头二三滩自然保护区41个)。
对处于同一山体的样方进行随机组合, 获取组合样方系列, 构建该山地的种—面积关系(图4)。具体组合方法依照图1B, 为了减小组合的随机性, 可穷尽所有随机组合方式; 数据分析在群落分析软件PC-ORD (McCune & Grace, 2002)中实现。得出不同山区的种—面积关系可用对数方程拟合:
太白山自然保护区:
牛背梁自然保护区:
头二三滩自然保护区:
秦岭山脉:
图4
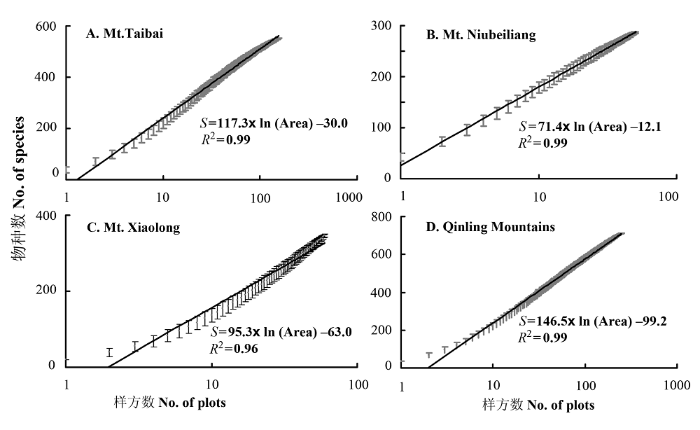
图4
秦岭山脉不同山体种—面积关系。A:太白山; B:牛背梁; C:小陇山头二三滩自然保护区; D: 秦岭山脉。横坐标为以样方数表示的面积(样方面积600 m2)。
Fig. 4
Species-area relationships of different mountains in the Qinling Mountains. The x axis shows area indicated as no. of plots (each with an area of 600 m2).
这些样方在设置上包含了秦岭山脉各种主要的植被类型, 样方的空间布局具有系统性, 因此可以依据这些方程进行外推。根据以上公式, 估算出太白山自然保护区(500 km2)、牛背梁自然保护区(164 km2)、甘肃小陇山头二三滩自然保护区(319.4 km2)以及秦岭山脉(狭义, 面积71,120 km2)的种子植物数量分别为1,570, 906, 1,193和2,624种, 而上述区域实际记录的种子植物种数分别为1,782种(应俊生等, 1990), 950种(李景侠等, 1999), 1,258种(李莉, 2006)和2,742种(应俊生, 1994, 秦岭山脉共有种子植物3,124种, 其中382种不出现在狭义秦岭范围以内), 估算值与实际记录值接近。
上述结果表明, 利用组合样方的种—面积关系, 可以有效地估算某一地区的物种丰富度(Ugland et al., 2003)。但野外调查以及外推计算过程中, 应注意以下几点: (1) 实地调查应尽量覆盖区域内所有的植被类型; (2) 调查样方的面积要一致; (3) 各区域种—面积关系的参数具有针对性, 不能将某一区域的种—面积关系方程直接套用到区域内的亚区域或区域中的某一群落类型。
参考文献
Neutral models fail to reproduce observed species-area and species-time relationships in Kansas grassland
The power of time, spatiotemporal scaling of species diversity
Evidence for a general species-time-area relationship
Effects of range size on species-area relationships
Demographic analysis of Hubbell’s neutral theory of biodiversity
DOI:10.1016/j.jtbi.2008.12.024
URL
PMID:19168081
[本文引用: 2]

Hubbell's neutral model is increasingly applied in both theoretical and empirical studies but so far little attention has been paid to the ecological mechanisms that determine species diversity in neutral communities. In this contribution we use a stochastic individual-based Markovian model to provide an explicit derivation of Hubbell's local community model from the fundamental processes of reproduction, mortality, and immigration, and show that such derivation provides important insights on the mechanisms regulating species diversity that cannot be obtained from the original model and its previous extensions. One important insight is that the basic parameters of Hubbell's model, community size (J) and the probability that a dying individual will be replaced by an immigrant (m), cannot be considered independent and that their interdependency leads to a counterintuitive trade-off between community size and species diversity. We further demonstrate that Hubbell's treatment of community size as a free parameter hides fundamental mechanisms that influence species diversity through their effect on the size of the community. For example, while in Hubbell's model immigration can only increase species diversity by promoting colonization rates, the demographic derivation shows that immigration can also promote species diversity by reducing extinction rates. Our demographic derivation also unifies previous contrasting predictions about the effect of reproduction on species diversity by showing that both positive and negative effects are possible, and that the balance between the two effects depends on the size of the community. The demographic derivation also reconciles an apparent contradiction between Hubbell's theory and patch occupancy theory, and integrates three previously proposed mechanisms of species diversity, the More Individuals Hypothesis, the rescue effect, and the dilution effect, within a single, unified framework.
The specific character of plant communities. II. A quantitative approach
Geographic range, turnover rate and the scaling of species diversity
Statistical investigations in the constitution of plant associations
Habitat heterogeneity overrides the species-area relationship
Local richness-species pool ratio: a consequence of the species-area relationship
Community structure, a neutral model analysis
Comparing classical community models, theoretical consequences for patterns of diversity
DOI:10.1086/324112
URL
PMID:18707398
[本文引用: 3]
Mechanisms proposed to explain the maintenance of species diversity within ecological communities of sessile organisms include niche differentiation mediated by competitive trade-offs, frequency dependence resulting from species-specific pests, recruitment limitation due to local dispersal, and a speciation-extinction dynamic equilibrium mediated by stochasticity (drift). While each of these processes, and more, have been shown to act in particular communities, much remains to be learned about their relative importance in shaping community-level patterns. We used a spatially-explicit, individual-based model to assess the effects of each of these processes on species richness, relative abundance, and spatial patterns such as the species-area curve. Our model communities had an order-of-magnitude more individuals than any previous such study, and we also developed a finite-size scaling analysis to infer the large-scale properties of these systems in order to establish the generality of our conclusions across system sizes. As expected, each mechanism can promote diversity. We found some qualitative differences in community patterns across communities in which different combinations of these mechanisms operate. Species-area curves follow a power law with short-range dispersal and a logarithmic law with global dispersal. Relative-abundance distributions are more even for systems with competitive differences and trade-offs than for those in which all species are competitively equivalent, and they are most even when frequency dependence (even if weak) is present. Overall, however, communities in which different processes operated showed surprisingly similar patterns, which suggests that the form of community-level patterns cannot in general be used to distinguish among mechanisms maintaining diversity there. Nevertheless, parameterization of models such as these from field data on the strengths of the different mechanisms could yield insight into their relative roles in diversity maintenance in any given community.
Species-area curves, homogenization and the loss of global diversity
The statistics and biology of the species-area relationship
The imprint of the geographical, evolutionary and ecological context on species-area relationships
Spatial models for species-area curves
Detecting biodiversity hotspots by species-area relationships: a case study of Mediterranean beetles
DOI:10.1111/j.1523-1739.2006.00418.x
URL
PMID:16922233
[本文引用: 1]
Any method of identifying hotspots should take into account the effect of area on species richness. I examined the importance of the species-area relationship in determining tenebrionid (Coleoptera: Tenebrionidae) hotspots on the Aegean Islands (Greece). Thirty-two islands and 170 taxa (species and subspecies) were included in this study. I tested several species-area relationship models with linear and nonlinear regressions, including power exponential, negative exponential, logistic, Gompertz, Weibull, Lomolino, and He-Legendre functions. Islands with positive residuals were identified as hotspots. I also analyzed the values of the C parameter of the power function and the simple species-area ratios. Species richness was significantly correlated with island area for all models. The power function model was the most convenient one. Most functions, however identified certain islands as hotspots. The importance of endemics in insular biotas should be evaluated carefully because they are of high conservation concern. The simple use of the species-area relationship can be problematic when areas with no endemics are included. Therefore the importance of endemics should be evaluated according to different methods, such as percentages, to take into account different levels of endemism and different kinds of
The relationship between the number of species and the number of individual in a random sample of an animal population
Integration of local and regional species-area relationships from space-time species accumulation
DOI:10.1086/505761
URL
PMID:16874624
[本文引用: 4]
A long-standing observation in community ecology is that the scaling of species richness, as exemplified by species-area curves, differs on local and regional scales. This decoupling of scales may be largely due to sampling processes (the increasing constraint imposed by sampling fewer individuals at fine scales), as distinct from ecological processes, such as environmental heterogeneity, that operate across scales. Removal of the sampling constraint from fine-scale richness estimates should yield species-area curves that behave like those of the regions in which they are embedded, but an effective method for this removal has not been available. We suggest an approach that incorporates the manner in which small areas accumulate species over time as a way to remove the signature of sampling processes from fine-scale species-area curves. We report for three species-rich grasslands from two continents how local plant species richness is distributed through time at multiple, nested spatial scales, and we ask whether sampling-corrected curves reflect the spatial scaling of richness of each larger floristic province. Our analysis suggests that fine-scale values of richness are highly constrained by sampling processes, but once these constraints are removed, the spatial scaling of species richness is consistent from the scale of individuals to that of an entire province.
Connecting fine- and broad- scale species-area relationships of southeastern U.S. flora
On species accumulation and species-area curves
Biodiversity scales from plots to biomes with a universal species-area curve
DOI:10.1111/j.1461-0248.2009.01328.x
URL
PMID:19486123
[本文引用: 1]
Classic theory predicts species richness scales as the quarter-power of area, yet species-area relationships (SAR) vary widely depending on habitat, taxa, and scale range. Because power-law SAR are used to predict species loss under habitat loss, and to scale species richness from plots to biomes, insight into the wide variety of observed SAR and the conditions under which power-law behavior should be observed is needed. Here we derive from the maximum entropy principle, a new procedure for upscaling species richness data from small census plots to larger areas, and test empirically, using multiple data sets, the prediction that up to an overall scale displacement, nested SAR lie along a universal curve, with average abundance per species at each scale determining the local slope of the curve. Power-law behaviour only arises in the limit of increasing average abundance, and in that limit, the slope approaches zero, not (1/4). An extrapolation of tree species richness in the Western Ghats to biome scale (60,000 km(2)) using only census data at plot scale ((1/4) ha) is presented to illustrate the potential for applications of our theory.
Species diversity patterns derived from species-area models
Dispersal and establishment, spatial patterns and species-area relationships
Theories and models of species abundance
Species-area curves and estimates of total species richness in an old field chronosequence
The distribution of the flora in the alpine zone
How does habitat diversity affect the species-area relationship?
A global model of island biogeography
Habitat heterogeneity as a determinant of mammal species richness in high energy regions
Exponential values for the species-area relation
DOI:10.1126/science.141.3587.1276
URL
PMID:17813327
[本文引用: 1]
Data on vegetation types in six 900-m(2) plots in the Midwest reveal that the species-area curves are not logarithmic but more nearly approach an exponential equation of the form y = kx(2) for areas less than 100 m(2). For larger areas the curve appears to be sigmoid.
Are there latitudinal gradients in species turnover?
Global diversity of island floras from a macroecological perspective
DOI:10.1111/j.1461-0248.2007.01129.x
URL
PMID:18036182
[本文引用: 2]
Islands harbour a significant portion of all plant species worldwide. Their biota are often characterized by narrow distributions and are particularly susceptible to biological invasions and climate change. To date, the global richness pattern of islands is only poorly documented and factors causing differences in species numbers remain controversial. Here, we present the first global analysis of 488 island and 970 mainland floras. We test the relationship between island characteristics (area, isolation, topography, climate and geology) and species richness using traditional and spatial models. Area is the strongest determinant of island species numbers (R(2) = 0.66) but a weaker predictor for mainlands (R(2) = 0.25). Multivariate analyses reveal that all investigated variables significantly contribute to insular species richness with area being the strongest followed by isolation, temperature and precipitation with about equally strong effects. Elevation and island geology show relatively weak yet significant effects. Together these variables account for 85% of the global variation in species richness.
Neutral theory, a historical perspective
DOI:10.1111/j.1420-9101.2007.01410.x
URL
PMID:17956380
[本文引用: 2]
To resolve a panselectionist paradox, the population geneticist Kimura invented a neutral theory, where each gene is equally likely to enter the next generation whatever its allelic type. To learn what could be explained without invoking Darwinian adaptive divergence, Hubbell devised a similar neutral theory for forest ecology, assuming each tree is equally likely to reproduce whatever its species. In both theories, some predictions worked; neither theory proved universally true. Simple assumptions allow neutral theorists to treat many subjects still immune to more realistic theory. Ecologists exploit far fewer of these possibilities than population geneticists, focussing instead on species abundance distributions, where their predictions work best, but most closely match non-neutral predictions. Neutral theory cannot explain adaptive divergence or ecosystem function, which ecologists must understand. By addressing new topics and predicting changes in time, however, ecological neutral theory can provide probing null hypotheses and stimulate more realistic theory.
Climate change, species-area curves and the extinction crisis
Study on diversity of seed plants from Niubeiliang Nature Reserve
Research on diversity of vascular plants in Touersantan Nature Reserve
Ecology’s most general, yet protean pattern: the species-area relationship
The species-area relationship: new challenges for an old pattern
Testing scale variance in species-area and abundance-area relationships in a local assemblage, an example from a subtropical boulder shore
Analysis of an evolutionary species-area relationship
DOI:10.1038/35048558
URL
PMID:11130721
[本文引用: 1]
Large islands typically have more species than comparable smaller islands. Ecological theories, the most influential being the equilibrium theory of island biogeography, explain the species-area relationship as the outcome of the effect of area on immigration and extinction rates. However, these theories do not apply to taxa on land masses, including continents and large islands, that generate most of their species in situ. In this case, species-area relationships should be driven by higher speciation rates in larger areas, a theory that has never been quantitatively tested. Here we show that Anolis lizards on Caribbean islands meet several expectations of the evolutionary theory. Within-island speciation exceeds immigration as a source of new species on all islands larger than 3,000 km2, whereas speciation is rare on smaller islands. Above this threshold island size, the rate of species proliferation increases with island area, a process that results principally from the positive effects of area on speciation rate. Also as expected, the slope of the species-area relationship jumps sharply above the threshold. Although Anolis lizards have been present on large Caribbean islands for over 30 million years, there are indications that the current number of species still falls below the speciation-extinction equilibrium.
Species richness, latitude, and scale-sensitivity
On the relative abundance of bird species
Global warming and extinctions of endemic species from biodiversity hotspots
DOI:10.1111/j.1523-1739.2006.00364.x
URL
PMID:16903114
[本文引用: 2]
Estimating the species accumulation curve using mixtures
DOI:10.1111/j.1541-0420.2005.00316.x
URL
PMID:16011689
[本文引用: 1]
As a significant tool in ecological studies, the species accumulation curve or the collector's curve is the graph of the expected number of detected species as a function of sampling effort. The problem of estimating the species accumulation curve based on an empirical data set arising from quadrat sampling is studied in a nonparametric binomial mixture model. It will be shown that estimating the species accumulation curve not only is independent of the unknown number of species but also includes estimating the number of species as a limiting case. For the purpose of interpolation, moment-based estimators, associated with asymptotic confidence intervals, are developed from several points of view. A likelihood-based procedure is developed for the purpose of extrapolation, associated with bootstrap confidence intervals. The proposed methods are illustrated by ecological data sets.
Analysis of Ecological Communities
A unified theory for macroecology based on spatial patterns of abundance
Species abundance distributions, moving beyond single prediction theories to integration within an ecological framework
DOI:10.1111/j.1461-0248.2007.01094.x
URL
PMID:17845298
[本文引用: 2]
Species abundance distributions (SADs) follow one of ecology's oldest and most universal laws--every community shows a hollow curve or hyperbolic shape on a histogram with many rare species and just a few common species. Here, we review theoretical, empirical and statistical developments in the study of SADs. Several key points emerge. (i) Literally dozens of models have been proposed to explain the hollow curve. Unfortunately, very few models are ever rejected, primarily because few theories make any predictions beyond the hollow-curve SAD itself. (ii) Interesting work has been performed both empirically and theoretically, which goes beyond the hollow-curve prediction to provide a rich variety of information about how SADs behave. These include the study of SADs along environmental gradients and theories that integrate SADs with other biodiversity patterns. Central to this body of work is an effort to move beyond treating the SAD in isolation and to integrate the SAD into its ecological context to enable making many predictions. (iii) Moving forward will entail understanding how sampling and scale affect SADs and developing statistical tools for describing and comparing SADs. We are optimistic that SADs can provide significant insights into basic and applied ecological science.
On predicting biotic homogenization: species-area patterns in marine biota
Prediction of species richness of breeding birds by landscape-level factors of urban wood in Osaka Prefecture, Japan
Habitat loss and changes in the species-area relationship
Scale dependence and the species-area relationship
Species-area curves and diversity-productivity relationships in beawer meadows of Voyageurs National Park, Minnesota, USA
Variation in species richness and species pool size across a pH gradient in forests of the southern Blue Ridge Mountains
Modeling biodiversity dynamics in countryside landscapes
DOI:10.1890/0012-9658(2006)87[1877:mbdicl]2.0.co;2
URL
PMID:16937624
[本文引用: 1]
The future of biodiversity hinges to a great extent on the conservation value of countryside, the growing fraction of Earth's surface heavily influenced by human activities. How many species, and which species, can persist in such landscapes (and analogous seascapes) are open questions. Here we explore two complementary theoretical frameworks to address these questions: species-area relationships and demographic models. We use the terrestrial mammal fauna of Central America to illustrate the application of both frameworks. We begin by proposing a multi-habitat species-area relationship, the countryside species-area relationship, to forecast species extinction rates. To apply it, we classify the mammal fauna by affinity to native and human-dominated habitats. We show how considering the conservation value of countryside habitats changes estimates derived from the classic species-area approach We also examine how the z value of the species-area relationship affects extinction estimates. Next, we present a framework for assessing the relative vulnerability of species to extinction in the countryside, based on the Skellam model of population dynamics. This model predicts the minimum area of contiguous native habitat required for persistence of a species, which we use as an indicator of vulnerability to habitat change. To apply the model, we use our habitat affinity classification of mammals and we estimate life-history parameters by species and habitat type. The resulting ranking of vulnerabilities is significantly correlated with the World Conservation Union (IUCN) Red List assessment.
Speciation-rate dependence in species-area relationships
Extinction in number
DOI:10.1038/35002708 URL PMID:10706267 [本文引用: 1]
The future of biodiversity
DOI:10.1126/science.269.5222.347
URL
PMID:17841251
[本文引用: 1]
Recent extinction rates are 100 to 1000 times their pre-human levels in well-known, but taxonomically diverse groups from widely different environments. If all species currently deemed
Species-area curves, spatial aggregation, and habitat specialization in tropical forests
DOI:10.1006/jtbi.2000.2158
URL
PMID:11027481
[本文引用: 1]
The relationship between species diversity and sampled area is fundamental to ecology. Traditionally, theories of the species-area relationship have been dominated by random-placement models. Such models were used to formulate the canonical theory of species-area curves and species abundances. In this paper, however, armed with a detailed data set from a moist tropical forest, we investigate the validity of random placement and suggest improved models based upon spatial aggregation. By accounting for intraspecific, small-scale aggregation, we develop a cluster model which reproduces empirical species-area curves with high fidelity. We find that inter-specific aggregation patterns, on the other hand, do not affect the species-area curves significantly. We demonstrate that the tendency for a tree species to aggregate, as well as its average clump size, is not significantly correlated with the species' abundance. In addition, we investigate hierarchical clumping and the extent to which aggregation is driven by topography. We conclude that small-scale phenomena such as dispersal and gap recruitment determine individual tree placement more than adaptation to larger-scale topography.
Predicting species diversity in tropical forests
The canonical distribution of commonness and rarity. Part I
The canonical distribution of commonness and rarity. Part II
The latitudinal gradient of species-area relationships for vascular plants of North America
Composition and structure of seasonally deciduous forests in the Americas
Detection of macro-ecological patterns in South American hummingbirds is affected by spatial scale
History and the species-area relationship in Lesser Antillean birds
DOI:10.1086/381002
URL
PMID:14970924
[本文引用: 2]
We examined the species-area relationship for three historically distinct subsets of Lesser Antillean birds identified by molecular phylogenetic analysis of island and continental populations. The groups comprised recent colonists from continental or Greater Antillean source populations, old taxa having recently expanded distributions within the Lesser Antilles, and old endemic taxa lacking evidence of recent dispersal between islands. The number of young taxa was primarily related to distance from the source of colonists in South America. In a multiple regression, the logarithmic slope of the species-area relationship for this group was shallow (0.066+/-0.016). Old endemic taxa were restricted to islands with high elevation, and within this subset, species richness was related primarily to island area, with a steep slope (0.719+/-0.110). The number of recently spread endemic taxa was related primarily to island elevation, apparently reflecting the persistence of such populations on islands with large areas of forested and montane habitats. Historical analysis of the Lesser Antillean avifauna supports the dynamic concept of island biogeography of MacArthur and Wilson, rather than the more static view of David Lack, in that colonists exhibit dispersal limitation and extinction plays a role in shaping patterns of diversity. However, the avifauna of the Lesser Antilles is probably not in equilibrium at present, and the overall species-area relationship might reflect changing proportions of historically distinguishable subsets of species.
The four questions, what does the introduction of exotic species do to diversity?
A hierarchical perspective of plant diversity
DOI:10.1086/433058 URL [本文引用: 1]
Six types of species-area curves
DOI:10.1046/j.1466-822X.2003.00061.x URL [本文引用: 4]
Biological determinants of species diversity
DOI:10.2307/2845026 URL [本文引用: 1]
The distance decay of similarity in ecological communities
DOI:10.1111/eco.2007.30.issue-1 URL [本文引用: 1]
The species- area-energy relationship
DOI:10.1111/j.1461-0248.2005.00740.x
URL
PMID:21352452
[本文引用: 4]
Area and available energy are major determinants of species richness. Although scale dependency of the relationship between energy availability and species richness (the species-energy relationship) has been documented, the exact relationship between the species-area and the species-energy relationship has not been studied explicitly. Here we show, using two extensive data sets on avian distributions in different biogeographic regions, that there is a negative interaction between energy availability and area in their effect on species richness. The slope of the species-area relationship is lower in areas with higher levels of available energy, and the slope of the species-energy relationship is lower for larger areas. This three-dimensional species-area-energy relationship can be understood in terms of probabilistic processes affecting the proportions of sites occupied by individual species. According to this theory, high environmental energy elevates species' occupancies, which depress the slope of the species-area curve.
Extinction risk from climate change
DOI:10.1038/nature02121
URL
PMID:14712274
[本文引用: 1]
Climate change over the past approximately 30 years has produced numerous shifts in the distributions and abundances of species and has been implicated in one species-level extinction. Using projections of species' distributions for future climate scenarios, we assess extinction risks for sample regions that cover some 20% of the Earth's terrestrial surface. Exploring three approaches in which the estimated probability of extinction shows a power-law relationship with geographical range size, we predict, on the basis of mid-range climate-warming scenarios for 2050, that 15-37% of species in our sample of regions and taxa will be 'committed to extinction'. When the average of the three methods and two dispersal scenarios is taken, minimal climate-warming scenarios produce lower projections of species committed to extinction ( approximately 18%) than mid-range ( approximately 24%) and maximum-change ( approximately 35%) scenarios. These estimates show the importance of rapid implementation of technologies to decrease greenhouse gas emissions and strategies for carbon sequestration.
Shapes and functions of species-area curves: a review of possible models
DOI:10.1046/j.1365-2699.2003.00877.x URL [本文引用: 2]
Species-area relationship: separating the effects of species abundance and spatial distribution
DOI:10.1111/jec.2008.96.issue-6 URL [本文引用: 1]
A model for the species-area-habitat relationship
DOI:10.1046/j.1365-2699.2003.00805.x URL [本文引用: 2]
Scale-dependence in species-area relationships
DOI:10.1111/j.2005.0906-7590.04273.x URL [本文引用: 1]
The species-accumulation curve and estimation of species richness
DOI:10.1046/j.1365-2656.2003.00748.x URL [本文引用: 4]
Changes in the species-area relations of higher plant of nature reserves
In this study, three month-old seedlings of Chinese fir (Cunninghamia laceolata) were grown in solution culture with 1 mmol x L(-1) Al at pH 4.0 for 80 days to evaluate the effects of varying concentrations of Ca, P, and NH4+-N or NO3(-)-N in solution on their growth. The morphological indexes (fresh weight, dry weight, shoot length, root length and relative elongation ratio) and physiological indexes (MDA content and POD activity) were submitted to statistical analysis and compared. The results indicated that the seedlings weight or shoot length had a significantly positive correlation with the molar ratio of solution Ca/Al. The MDA content and POD activity decreased with the increasing molar ratio of Ca/Al, and Ca/Al > or = 2.8 was the critical ratio. Similar to Ca/Al, high P/Al molar ratio also had an obvious effect on the growth of Chinese fir seedlings under Al stress, and P/Al > or = 4.5 was the critical ratio. The growth of Chinese fir seedlings was improved by increased NH4+-N supply, but the effect was less obvious than Ca and P. Solution NH4+-N/Al > or = 4.7 was the critical molar ratio. Solution NO3(-)-N could mitigate some adverse effects of Al on Chinese fir seedlings growth, but no regular effects were found with the change of solution NO3(-)-N/Al molar ratio.
Temperature dependence, spatial scale, and tree species diversity in eastern Asia and North America
DOI:10.1073/pnas.0905030106 URL [本文引用: 1]
The combined effects of scale and productivity on species richness
DOI:10.1046/j.1365-2745.1999.00412.x URL [本文引用: 4]
Some applications of the logarithmic series and the index of diversity to ecological problems
DOI:10.2307/2256485 URL [本文引用: 2]
Latitudinal gradients of biodiversity: pattern, process, scale, and synthesis
Species-energy theory: an extension of species-area theory
DOI:10.2307/3544109 URL [本文引用: 3]
An analysis of the flora of Qinling Mountain Range: its nature, characteristics, and origin
Observations on the flora and vegetation of Taibaishan, Qinling Mountain Range, southern Shaanxi, China
The relative role of species pools in determining plant species richness: an alternative explanation of species coexistence?
DOI:10.1016/s0169-5347(97)01096-3
URL
PMID:21238064
[本文引用: 1]
Explanations of the pattern of species have traditionally relied on small-scale, local processes occurring in ecological time. Differences in species richness have associated with different mechanisms avoiding competition, such as spatiotemporal heterogeneity (weaker competitors may find a more favourable place or time) or environmental stress (competition is assumed to be less intensive under difficult conditions). More recently, large-scale process have been taken into account, raising such questions as: which plant species may potentially grow in a certain community? Are evolutionary processes and species dispersal responsible for the differences between communities? The species-pool theory attempts to answer these general questions, and information about species pools is needed for the design of experiments where the number of species in a community is manipulated.
Spatial-accumulation pattern and extinction rates of Mediterranean flora as related to species confinement to habitats in preserves and larger areas
DOI:10.1046/j.1523-1739.2002.99547.x URL [本文引用: 1]
