Toggle navigation
Home
About
Editorial Board
Editorial Board
Youth Editorial Board
Author Guidelines
Writing Requirements
Contribution Template
Copyright Agreement
Endnote Style
Current Issue
Accepted Articles
Archives
Ethcis Statement
Login
Chinese
Image/Table Caption
Advanced options
Journals
Article DOI
ALL
Biolog Div
Grassland Research
Integr Cons
J Integr Plant Biol
J Plant Ecol
J Syst Evol
Plant Diversity
Pratacultural Science
Guihaia
JOURNAL OF FORESTRY RESEARCH
J Nanjing Forest Univ Nat Sci Ed
Journal of Tropical Biology
Journal of Tropical and Subtropical Botany
Life World
Biodiv Sci
J Biores Bioprod
Subtropical Plant Science
Chinese Wildlife
Natural Products and Bioprospecting
Chin J Appl Envir Biol
Plant Sci J
Chin J Plant Ecol
Chinese Bulletin of Botany
Bulletin of Botanical Research
Chinese Wild Plant Resources
Publication Year From
Publication Year To
FromYear
1951
1952
1953
1954
1955
1956
1957
1958
1959
1960
1961
1962
1963
1964
1965
1966
1967
1968
1969
1970
1971
1972
1973
1974
1975
1976
1977
1978
1979
1980
1981
1982
1983
1984
1985
1986
1987
1988
1989
1990
1991
1992
1993
1994
1995
1996
1997
1998
1999
2000
2001
2002
2003
2004
2005
2006
2007
2008
2009
2010
2011
2012
2013
2014
2015
2016
2017
2018
2019
2020
2021
2022
2023
2024
2025
2026
ToYear
2026
2025
2024
2023
2022
2021
2020
2019
2018
2017
2016
2015
2014
2013
2012
2011
2010
2009
2008
2007
2006
2005
2004
2003
2002
2001
2000
1999
1998
1997
1996
1995
1994
1993
1992
1991
1990
1989
1988
1987
1986
1985
1984
1983
1982
1981
1980
1979
1978
1977
1976
1975
1974
1973
1972
1971
1970
1969
1968
1967
1966
1965
1964
1963
1962
1961
1960
1959
1958
1957
1956
1955
1954
1953
1952
1951
Volume
Issue
Author
Institution
Journals
Publication Years
Table 1 Tested plants species
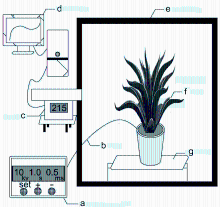
Figure 1 Schematic of detecting negative air ions concentration by plant in a sealed chamber
Table 2 Factors and levels for orthogonal test
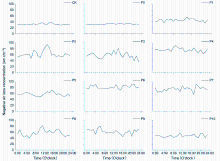
Figure 2 The changes in negative air ions concentration over 24 h for plant varieties under normal condition
Table 3 Analysis of negative air ions concentration generated by plants among 24 h in natural conditions (ion·cm
-3
)
Table 4 Analysis of negative air ions concentration generated by plants upon different combinational parameters of pulsed electrical stimulation (means±SD)
Table 5 Analysis between voltage of plants and negative air ions concentration (means±SD)
Table 6 The negative air ion concentration of plants under pulsed electrical field stimulation in different light intensity (means± SD)
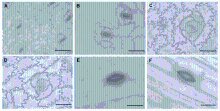
Figure 3 The stomatal shape feature of three plant species under the stimulation of high voltage pulsed electrical field with optimal combinational parameters (The shape feature of three plant species were observed under 40× objectives)
Table 7 The negative air ions concentration and stomata quantitative feature of plants under high voltage pulsed electrical field stimulation (means±SD)
Table 1 Available quantity of data for 2003-2007 based on the principle of conservation energy
Table 2 Model parameter (α), standard deviation (Sd), mean and coefficient variation (CV) using the least square method
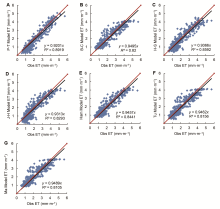
Figure 1 Daily evapotrans piration (ET) observation and ET simulation on average of years
Table 3 Correlation analysis of daily evapotranspiration (ET) observation and ET simulation on average
Table 4 Monthly change of evapotranspiration (ET) observation and ET simulation of years (mm·m
-1
)
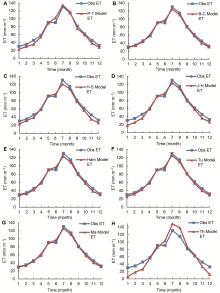
Figure 2 Comparison of monthly evapotranspiration (ET) observation and ET simulation of years on average
Table 5 Monthly evapotranspiration (ET) observation and ET simulation on average of years
Table 6 Correlation coefficient (R) of meteorological factor and evapotranspiration (ET) observation under Person correlation test
page
Page 1 of 1738
Total 34745 records
First page
Prev page
Next page
Last page