| 1 |
Aguirre O, GadowK, Jiménez J (2003) An analysis of spatial forest structure using neighborhood-based variables. Forest Ecology and Management, 183, 137-145.
|
| 2 |
Clark PJ, Evans FC (1954) Distance to nearest neighbor as a measure of spatial relationships in populations. Ecology, 35, 445-453.
|
| 3 |
Gao BJ, Li DY Cai WP, Yu FC (1999) Community characteris- tics of degraded Chinese pine stands and their biodiversity restoration. Acta Ecologica Sinica, 19, 647-653.
|
| 4 |
Hui GY, Gadow K, Albert M (1999) A new parameter for stand spatial structure—neighbourhood comparison. Forest Research, 12(1), 1-6.
|
| 5 |
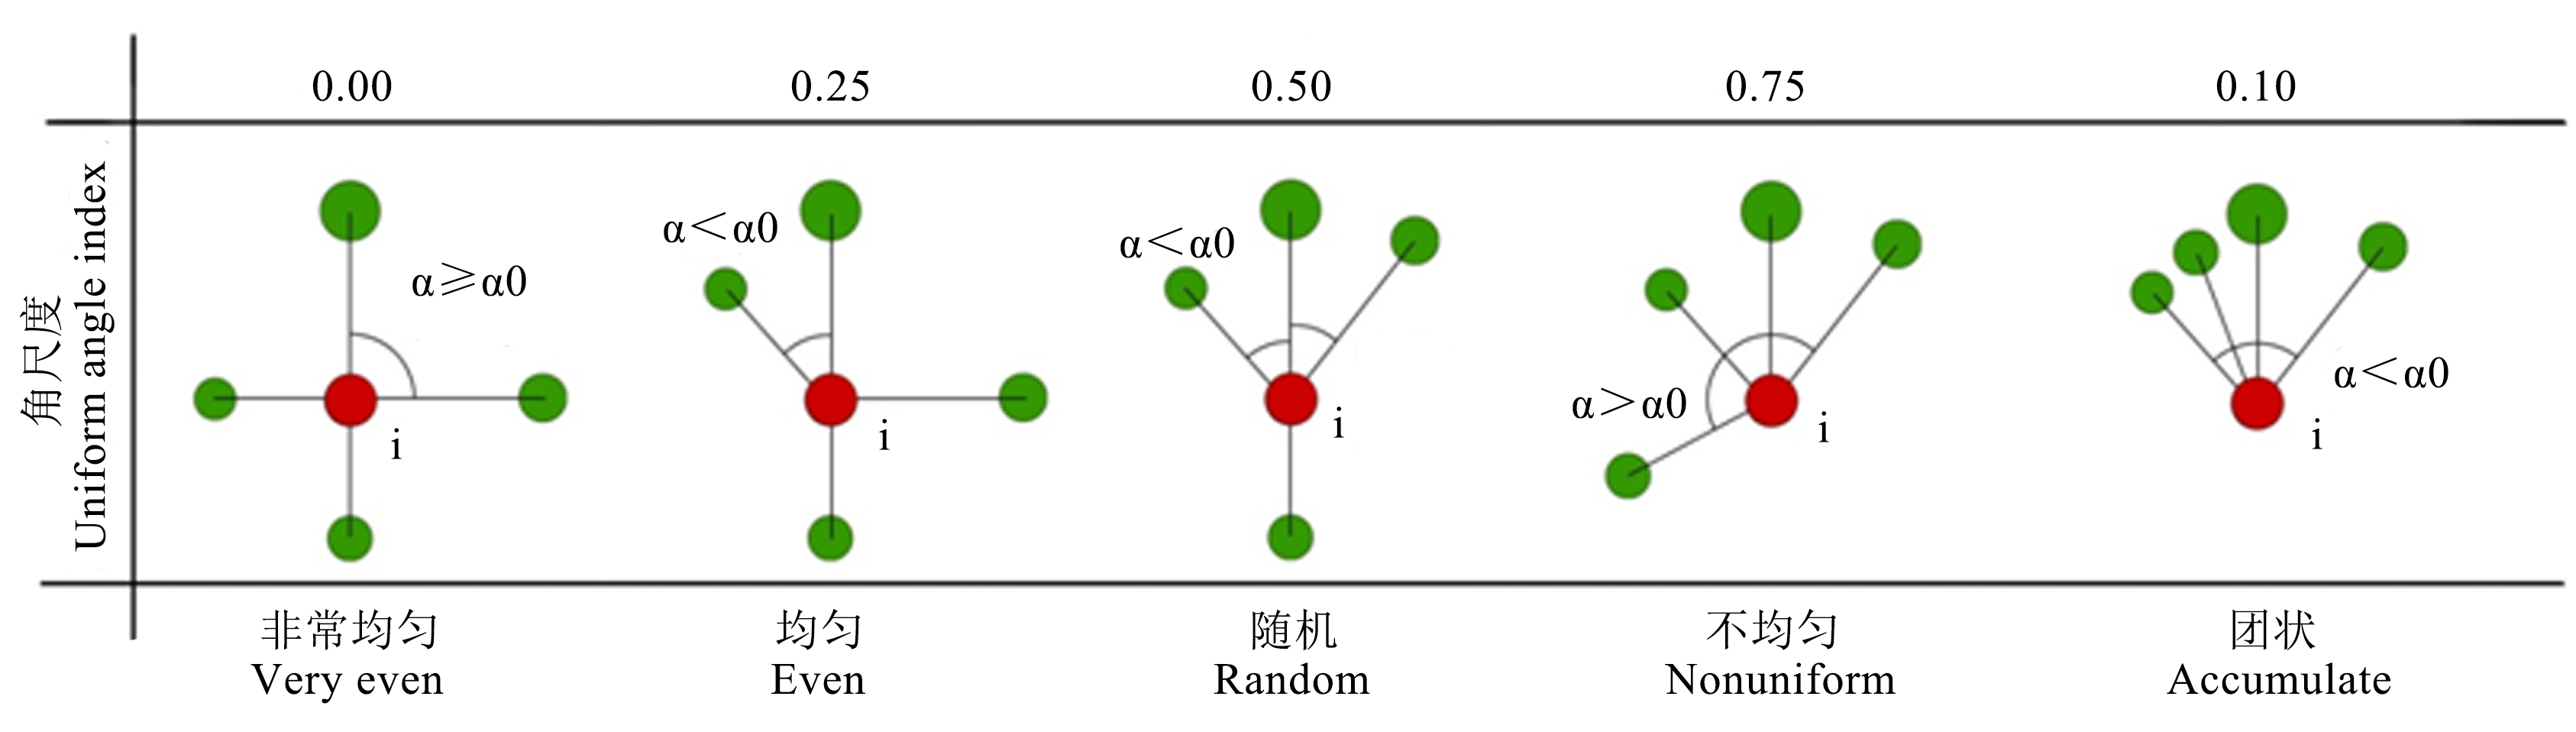
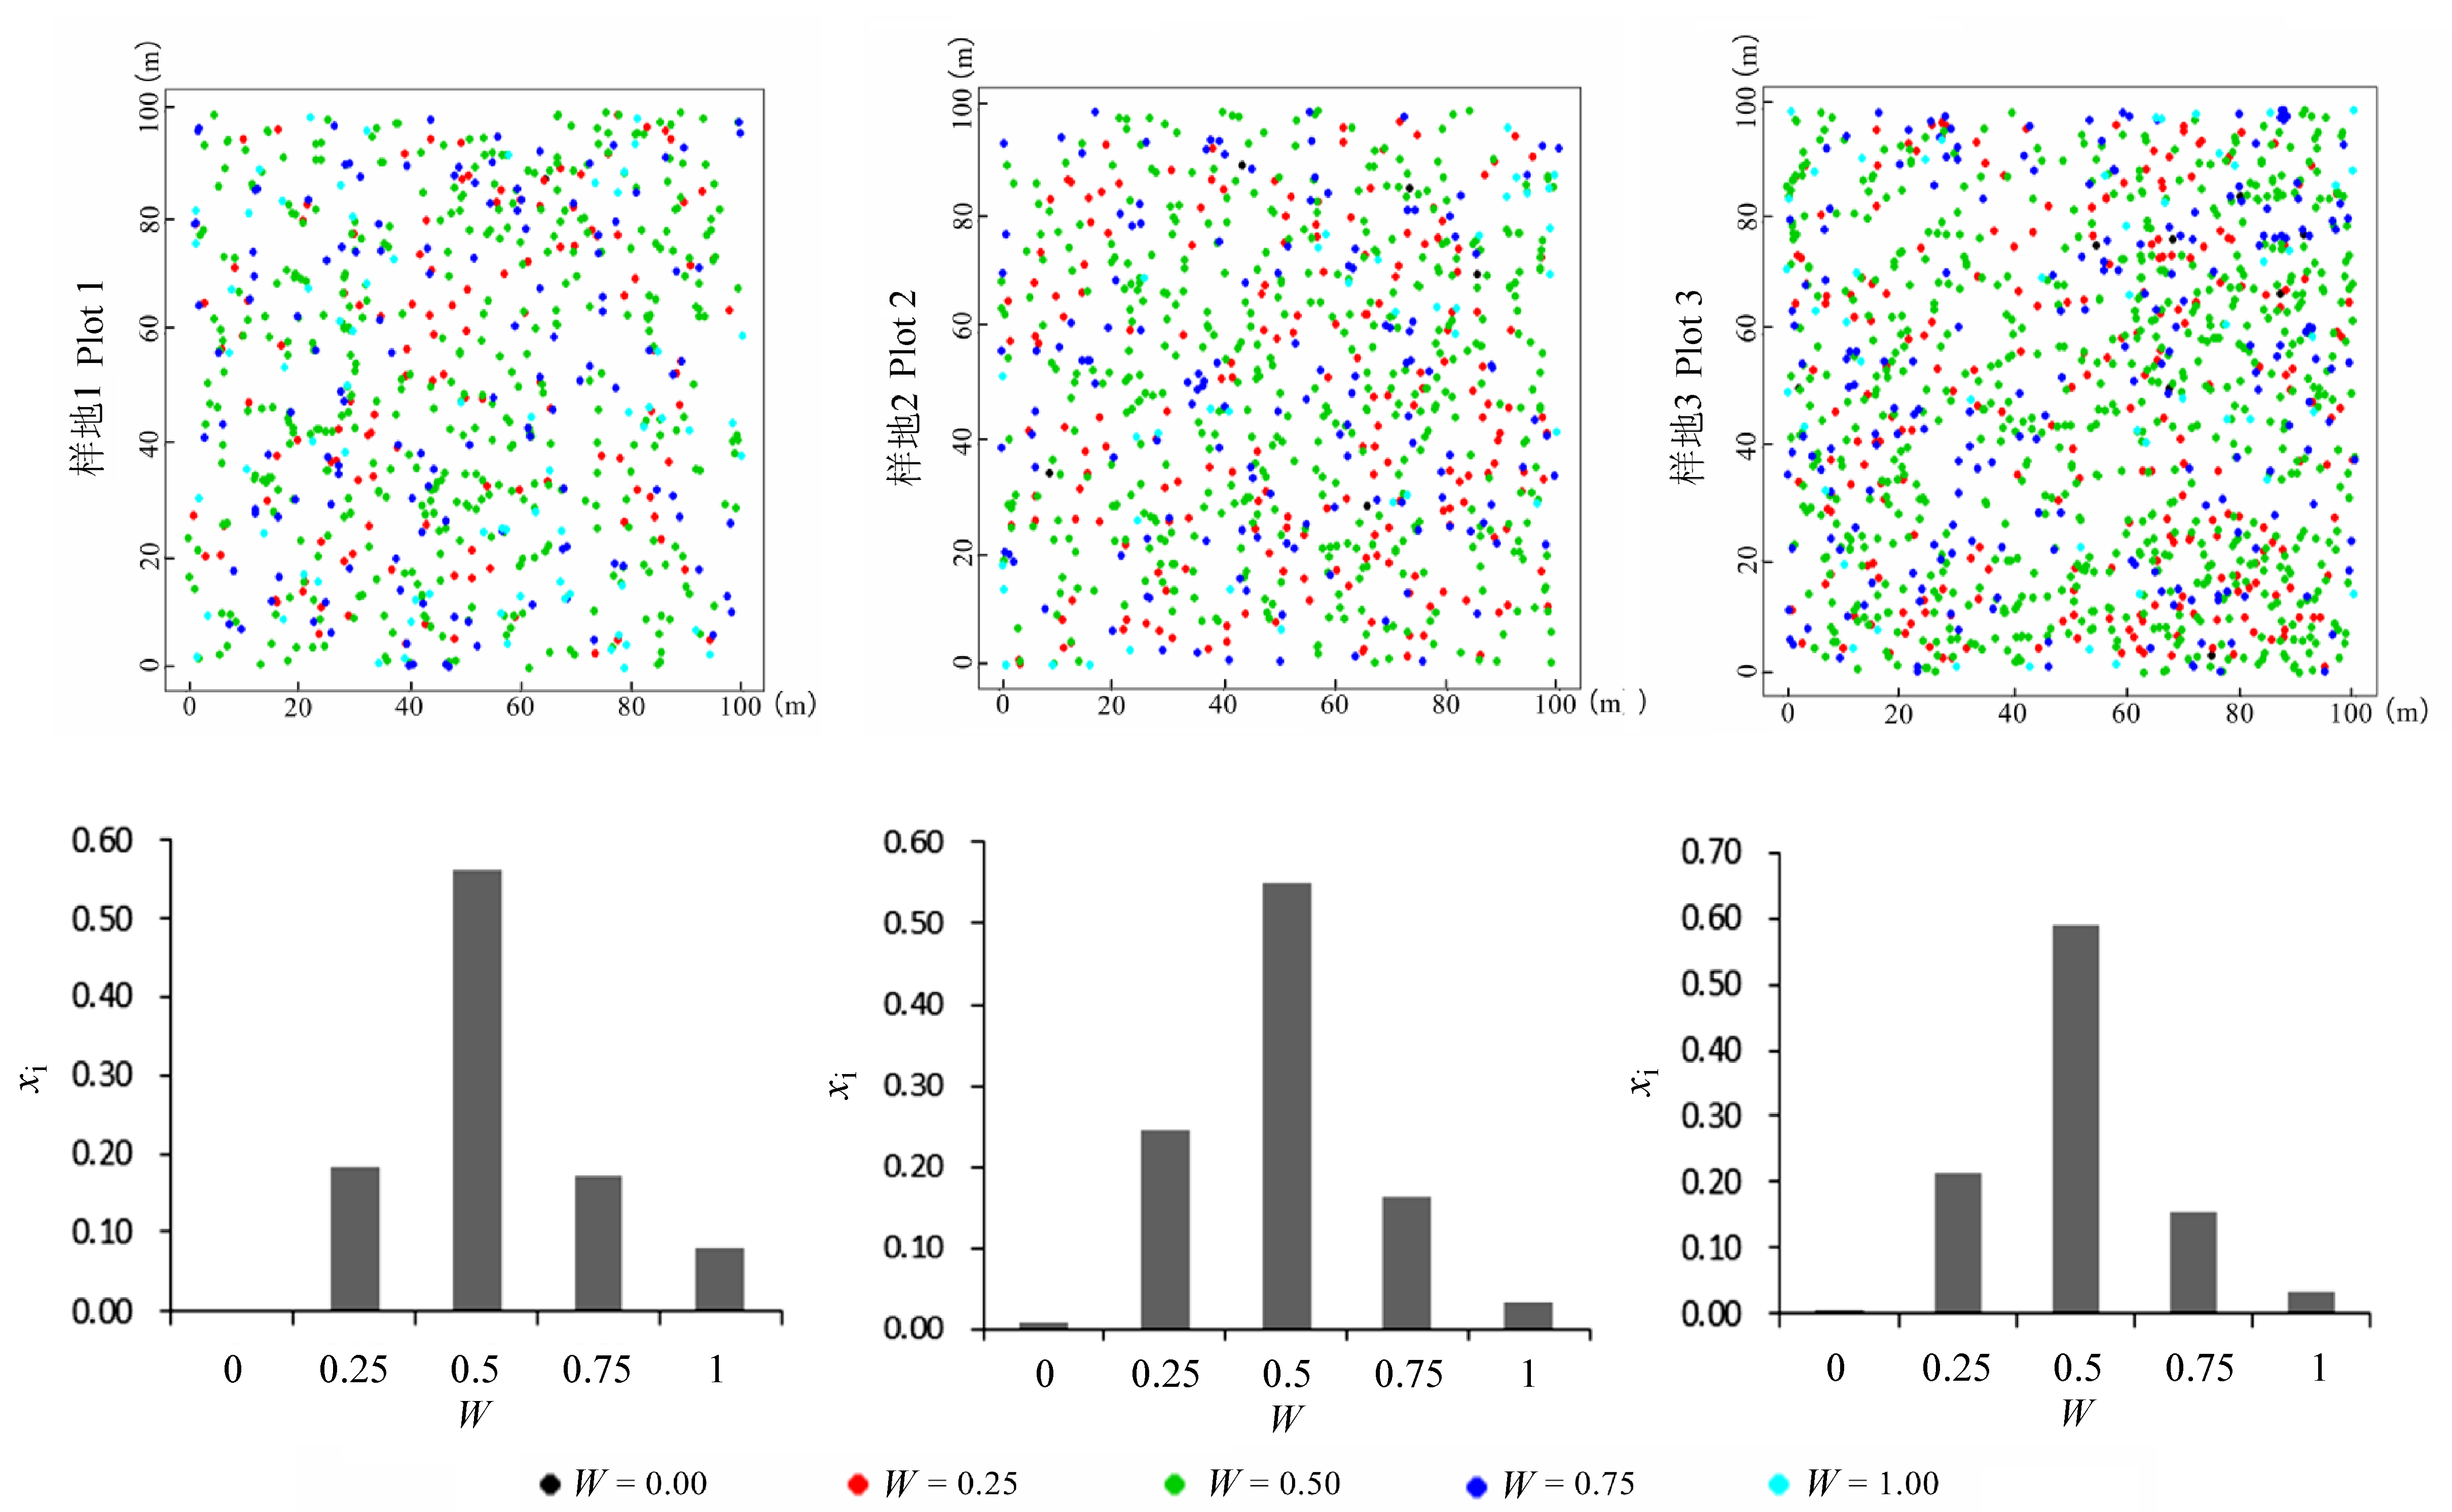
Hui GY, Gadow K, Hu YB (2004) The optimum standard angle of the uniform angle index. Forest Research, 17, 687-692.(in Chinese with English abstract)
|
|
[惠刚盈, Gadow K, 胡艳波 (2004) 林分空间结构参数角尺度的标准角选择. 林业科学研究, 17, 687-692.]
|
| 6 |
Hui GY (2013) Studies on the application of stand spatial structure parameters based on the relationship of neighborhood trees. Journal of Beijing Forestry University(北京林业大学学报), 35(4), 1-8.(in Chinese with English abstract)
|
|
[惠刚盈 (2013) 基于相邻木关系的林分空间结构参数应用研究. 北京林业大学学报, 35(4), 1-8.]
|
| 7 |
Hui GY, Gadow K (2003) Quantitative Analysis of Forest Spatial Structure. China Science and Technology Press, Beijing.(in Chinese)
|
|
[惠刚盈, Gadow K (2003) 森林空间结构量化分析方法. 中国科学技术出版社, 北京.]
|
| 8 |
Hui GY, Hu YB, Xu H (2006) Beziehungen zwischen Baum- dimensionen und kleinräumiger Strukturvielfalt in einem Mischwald in Nordostchina. Allgemeine Forst und Jagdzeitung, 177(10/11), 199-205. (in German)
|
| 9 |
Kint V, van Meirvenne M, Nachtergale L, Geudens G, Lust N (2003) Spatial methods for quantifying forest stand structure development: a comparison between nearest-neighbor indices and variogram analysis. Forest Science, 49, 36-49.
|
| 10 |
Krebs CJ (1999) Ecological Methodology. Benjamin/ Cummings Menlo Park, California.
|
| 11 |
Kuuluvainen T, Penttinen A, Leinonen K, Nygren M (1996) Statistical opportunities for comparing stand structural heterogeneity in managed and primeval forests: an example from boreal spruce forest in southern Finland. Silva Fennica, 30, 315-328.
|
| 12 |
Kuuluvainen T (2002) Natural variability of forests as a reference for restoring and managing biological diversity in boreal Fennoscandia. Silva Fennica, 36, 97-125.
|
| 13 |
Lei XD, Tang SZ (2002) Indicators on structural diversity within-stand: a review. Scientia Silvae Sinicae, 38(3), 140-145.(in Chinese with English abstract)
|
|
[雷相东, 唐守正 (2002) 林分结构多样性指标研究综述. 林业科学, 38(3), 140-145.]
|
| 14 |
Li JQ (2006) Forest Ecology. Higher Education Press, Beijing.(in Chinese)
|
|
[李俊清 (2006) 森林生态学. 高等教育出版社, 北京.]
|
| 15 |
Ma KP (马克平) (2013) Studies on biodiversity and ecosystem function via manipulation experiments. Biodiversity Science(生物多样性), 21, 247-248.(in Chinese)
|
|
[马克平 (2013) 生物多样性与生态系统功能的实验研究. 生物多样性, 21, 247-248.]
|
| 16 |
Ma KP, Qian YQ (1998) Biodiversity conservation and its research progress. Chinese Journal of Applied and Environmental Biology, 4, 95-99.(in Chinese with English abstract)
|
|
[马克平, 钱迎倩 (1998) 生物多样性保护及其研究进展. 应用与环境生物学报, 4, 95-99.]
|
| 17 |
McNaughton SJ (1977) Diversity and stability of ecological communities: a comment on the role of empiricism in ecology. The American Naturalist, 111, 515-525.
|
| 18 |
Pommerening A (2002) Approaches to quantifying forest structures. Forestry, 75, 305-324.
|
| 19 |
Purvis A, Hector A (2000) Getting the measure of biodiversity. Nature, 405, 212-219.
|
| 20 |
Ripley BD (1977) Modeling spatial patterns. Journal of the Royal Statistical Society Series B (Methodological), 39, 172-212.
|
| 21 |
Simpson EH (1949) Measurement of diversity. Nature, 21, 213-251.
|
| 22 |
Spiecker H (2003) Silvicultural management in maintaining biodiversity and resistance of forests in Europe temperate zone. Journal of Environmental Management, 67, 55-56.
|
| 23 |
Stapanian MA, Cline SP, Cassell DL (1997) Evaluation of a measurement method for forest vegetation in a large-scale ecological survey. Environmental Monitoring and Assess- ment, 45, 237-257.
|
| 24 |
Shannon CE, Weaver W (1959) The Mathematical Theory of Communication. University of Illinois Press, Urbana.
|
| 25 |
Tang MP, Zhou GM, Chen YG, Zhao MS, He YB (2009) Mingling of evergreen broad-leaved forests in Tianmu Mountain based on Voronoi diagram. Scientia Silvae Sinicae, 45(6), 1-5.(in Chinese with English abstract)
|
|
[汤孟平, 周国模, 陈永刚, 赵明水, 何一波 (2009) 基于Voronoi图的天目山常绿阔叶林混交度. 林业科学, 45(6), 1-5.]
|
| 26 |
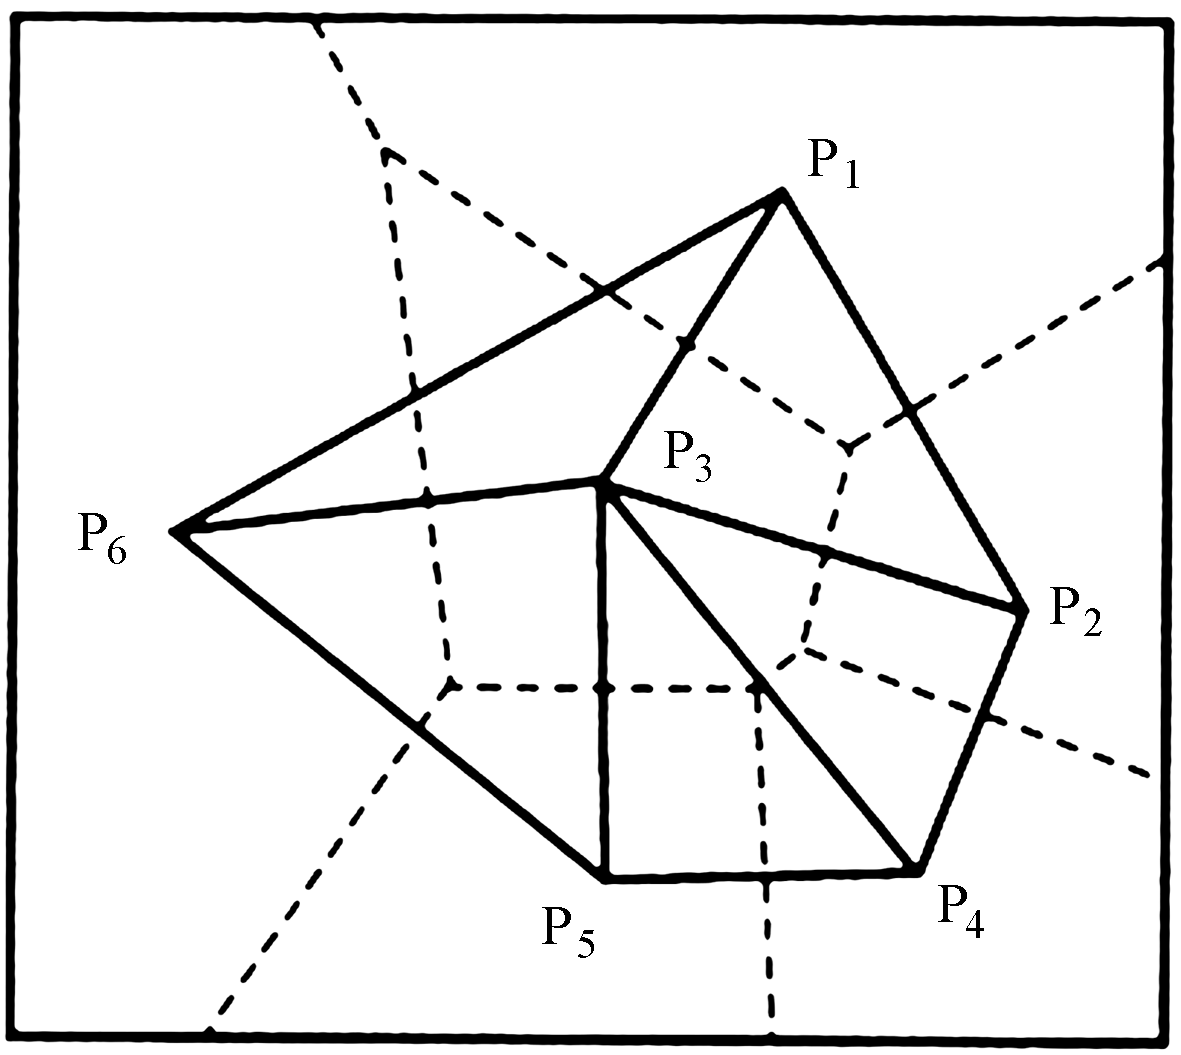
Zhao CY, Li JP, Li JJ (2010) Quantitative analysis of forest stand spatial structure based on Voronoi diagram & Delaunay triangulated network. Scientia Silvae Sinicae, 46(6), 78-84.(in Chinese with English abstract)
|
|
[赵春燕, 李际平, 李建军 (2010) 基于Voronoi图和Delaunay三角网的林分空间结构量化分析. 林业科学, 46(6), 78-84.]
|
| 27 |
Zhao ZH, Hui GY, Hu YB, Wang HX, Zhang GQ, Gadow K (2014) Testing the significance of different tree spatial distribution patterns based on the uniform angle index. Canadian Journal of Forest Research, 44, 1417-1425.
|
| 28 |
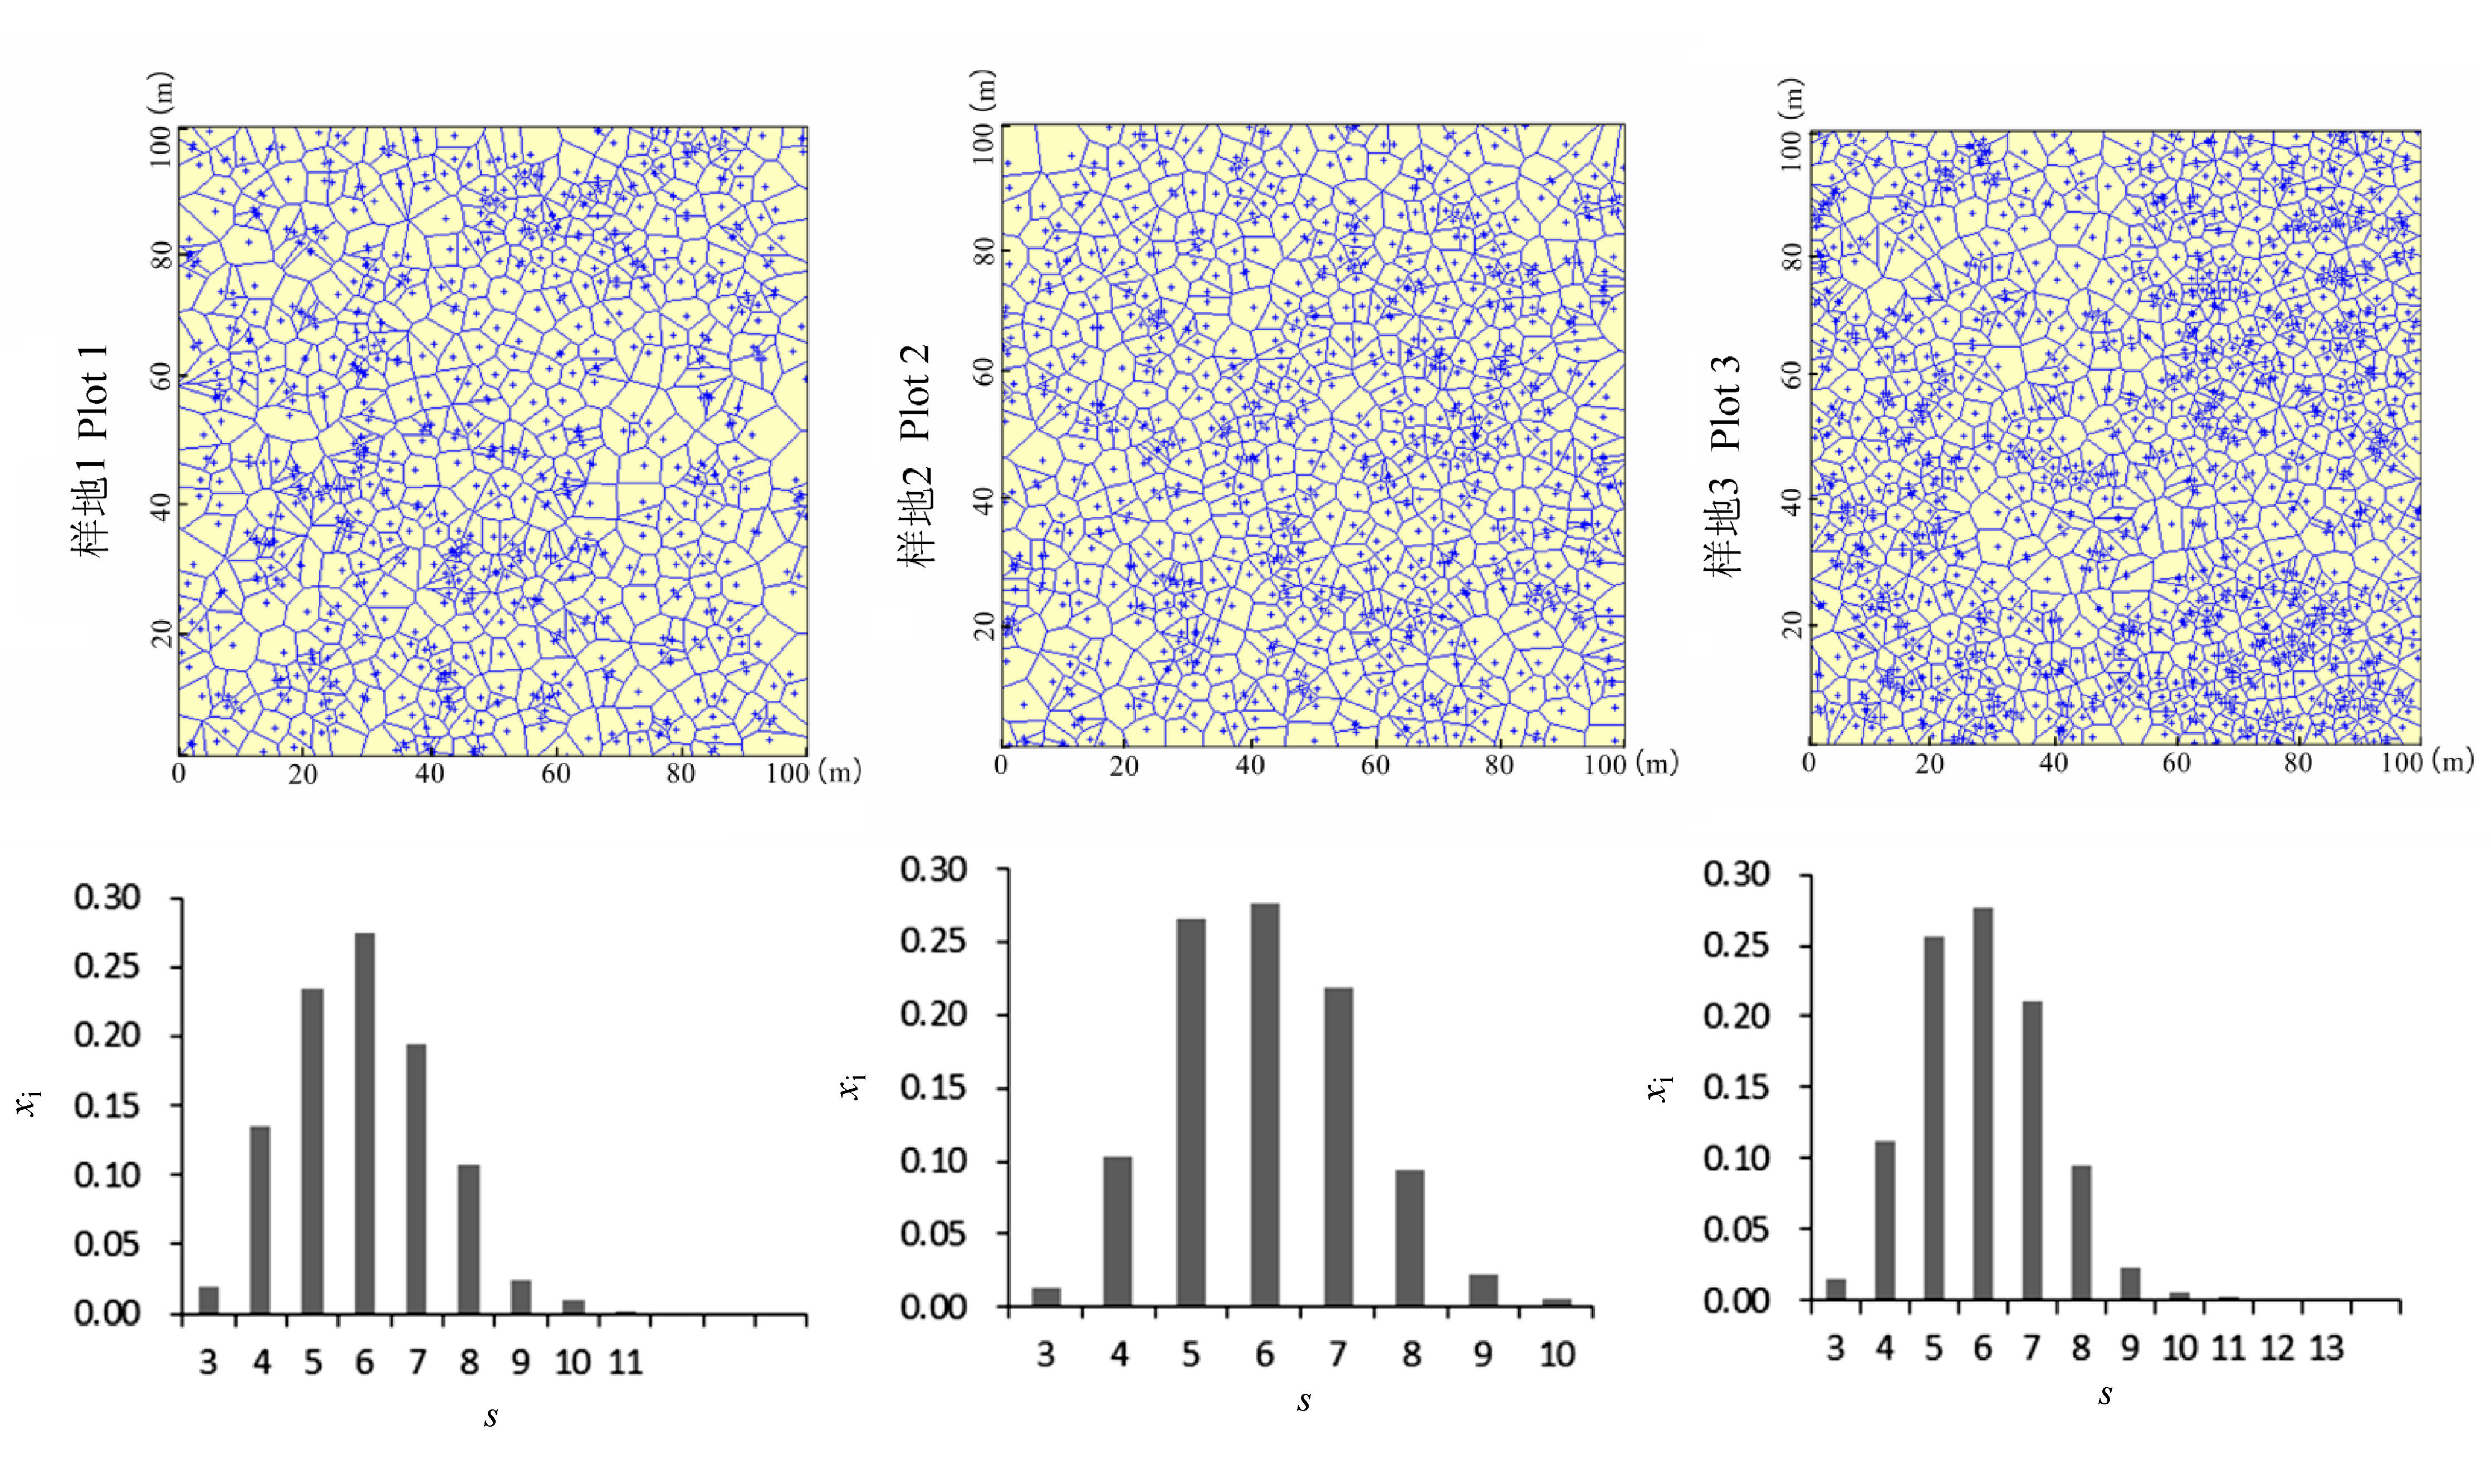
Zhang GQ, Hui GY (2015) Analysis and application of polygon side distribution of Voronoi diagram in tree patterns. Journal of Beijing Forestry University, 37(4), 1-7.(in Chinese with English abstract)
|
|
[张弓乔, 惠刚盈 (2015) Voronoi多边形的边数分布规律及其在林木格局分析中的应用. 北京林业大学学报, 37(4), 1-7.]
|

 ), 张弓乔, 赵中华, 胡艳波, 白超