


所有生物都是特定生物群落的一员, 并与群落中的其他生物进行着互作, 物种及种间互作共同构成了整个群落(Proulx et al, 2005)。生态网络(ecological network)的理念将群落中的物种组成和种间互作统一在一个整体的理论框架之内, 用来揭示群落的组织模式和动态机制(Proulx et al, 2005)。通过生态网络分析, 我们可以从两方面理解生物群落: (1)生态过程和进化过程及其共同作用在塑造群落物种组成和互作中的作用。生态过程包括外在因素(external factors)和内在动力(internal dynamics): 外在因素包括扩散限制(dispersal constraints)和环境限制(environmental constraints); 内在动力包括竞争、捕食、共生等种间互作(Belyea & Lancaster, 1999)。进化过程包括系统发育追踪、适应性辐射、协同进化等(Ponisio et al, 2019; Blasco-Costa et al, 2021)。(2)间接作用对网络结构的影响。网络结构展示了物种间的直接和间接互作的路径, 呈现了间接作用的影响如何在系统中扩散, 如何影响物种的种群动态和种间关系。而且, 由于构建网络的数据和目的不同, 我们可以构建不同类型的网络, 用于呈现生态系统中能量和物质的流动、集合群落动态(metacommunity dynamics)、免疫遗传多样性和协同进化等多种生物学过程和关系。因此, 网络分析能够揭示生态系统的构建过程以及直接效应和间接效应对生态系统动态的影响(Guimarães, 2020)。
网络的概念源自数学的一个分支——图论(graph theory)。网络指由顶点(vertex)和边(edge)组成的图形, 顶点有时也被称为节点(node), 边有时也被称为连接(link)。生态网络的数据本质是包括了物种及种间互作的邻接矩阵(adjacency matrix)。该邻接矩阵可以图形化为由节点和连接组成的图形, 即网络。理论上, 任何包括了节点及其互作的邻接矩阵都可以图示为一个网络, 无论这些节点代表的是蛋白质、个体、群体、物种甚至一个群落。在生态学领域, 节点可能是不同的生物组织水平(个体、物种、种群、功能团、群落或网络) (Pilosof et al, 2017; Guimarães, 2020)。
网络可分为单模(one-mode network, 如食物网或物种共存网络) (Pascual & Dunne, 2005; Freilich et al, 2018)和双模(two-mode network, 也称为二分网络bipartite network, 如植物-传粉者、寄主-寄生者等) (Dormann et al, 2008)。单模网络中所有的节点之间都可能发生互作关系。双模网络将整个网络节点分为两类, 连接只存在于两类节点之间, 而不发生在两类节点之内(Saavedra et al, 2009)。例如: 昆虫与植物的双模网络, 两类节点分别是昆虫和植物, 这样的网络中仅考虑昆虫和植物之间的互作, 而不考虑昆虫和昆虫或植物与植物同一类别内的互作。双模网络的优势是互作关系的类型以及互作的对象都是确定的, 因此容易解释其生态学意义。根据连接的类型, 可将双模网络分为互惠网络和拮抗网络。互惠网络, 如: 植物-传粉者(黄双全, 2007; Schleuning et al, 2014; Librán-Embid et al, 2021)、果实-种子传播者(Emer et al, 2018)以及植物-蚂蚁(王剑等, 2020)之间的相互作用网络。拮抗网络, 如: 寄主-寄生者(Runghen et al, 2021)以及植物-植食昆虫(Ibanez et al, 2016)之间的相互作用网络。
网络分析已经成为群落生态学中多物种互作关系研究的常见方法。但是不同的研究因其构建网络的数据集不同(例如: 基于多度、共存频率的网络或基于实际观测到的物种互作频率的网络)而得到不同的网络类型(例如: 单模网络/二分网络或加权/非加权网络) (Proulx et al, 2005)。研究者常常选择计算特定的指标来描述网络, 丰富的(或冗余的)网络指标常常令读者困惑。而有些指标仅适用于特定的网络类型, 使用不当不仅无法解释其生态学意义, 还可能会造成误解, 得出错误的结论。
生态网络的研究中基于物种共存关系进行的网络推断在方法和结果上存在争议(Freilich et al, 2018; Blanchet et al, 2020)。而基于实验观测的、确定的种间关系构建的生态网络接受度更高(Fang & Huang, 2013; 黄双全, 2018; Li et al, 2020), 相关的研究案例和新的理念、方法不断迭代, 解释力逐步深入。因此, 本文将仅仅讨论基于实验观测的、互作关系明确的二分网络及其研究进展。本文的主要目的包括: (1)解释常见的全局(global network metric)及局域网络指标(local network metric)的生态学意义及指标的相关性并解释网络的β多样性; (2)对网络指标进行统计分析的思路; (3)呈现从集合群落(metacommunity)到集合网络(metanetwork)的研究趋势; (4)对网络分析的未来发展方向进行展望。
1 网络的指标描述: 网络指标和网络的β多样性
1.1 单一网络指标
我们可以计算一系列指标来描述单个网络, 这些网络指标可分为描述网络整体属性的全局网络指标, 以及描述网络节点或连接的局部属性的局部网络指标。R软件的Bipartite包是进行网络分析的附加包, 其中用于计算网络指标的函数有34个(Dormann et al, 2008)。根据指标代表的网络属性以及指标的生态学意义, 我们将网络指标划分为9大类: 连通性、对称性、专化性、多样性、嵌套性、模块性、聚集性、稳健性及群落指标(附录1)。每一个网络属性可能由多个指标来描述。为了对网络的属性和具体的指标进行区分, 我们用“某某性”来描述一类网络属性, 例如: 连通性、对称性; 我们用“某某度”来描述具体的网络指标, 例如: 连接度(connectance)、互作专化度(specialization, H2')、互作均匀度(interaction evenness)等。这些指标一部分来自经典的网络分析, 例如: 描述局域网络特征的连接度、平均连接数、网络不对称度等指标。另外一些指标来自生态学研究。例如, 描述二分网络嵌套性的多个指标最初用来描述岛屿上物种分布的重合度, 在网络分析中则用于描述物种互作对象的重合度(刘灿然等, 2002; Almeida-Neto et al, 2008)。还有一些指标来自群落生态学, 描述了物种资源利用的分化或重叠, 包括, 生态位重叠(niche overlap)、聚集度(togetherness)、分化度(C score)等。这些网络指标虽然来源领域不同但往往是对同一网络属性从不同角度的观察。在理解网络指标计算过程的基础上阐明其可能的生态学意义, 对科研实践中选择合理的网络指标至关重要。
1.1.1 采样强度对网络指标的影响
生态网络分析需要对群落物种组成和互作关系进行采样, 采样的完整性会影响网络指标的计算结果(Llopis-Belenguer et al, 2023)。对物种丰富度(species richness)的采样表明, 一个群落的物种丰富度会随着采样强度的增加而趋近渐近线(asymptote), 对物种互作关系的采样也会呈现类似的模式(Henriksen et al, 2019)。获得群落中物种互作关系的渐近线比得到物种多度的渐近线更加困难, 因为物种互作关系可能具有多种组合, 而稀有种互作关系需要更大的采样强度才能呈现(Henriksen et al, 2019)。一项对植物-传粉者网络的研究显示, 当对传粉者类群的采样强度达到80%时, 对互作关系的记录仅达到了55%, 当采样强度再增加64%, 可以检测到90%的传粉者, 但要检测到90%的互动需要增加5倍的采样强度(Chacoff et al, 2012)。对于植物-传粉者网络来说, 多数植物-传粉者关系的采样都是不完整的, 特别是对于花期长、花量大的专性互作, 亦或者那些花期短且花朵稀少的兼性互作植物。因此, 采样强度不仅影响网络的物种数量(网络大小), 也会影响种间互作关系, 而网络大小和互作关系会进一步影响其他网络指标(Nielsen & Bascompte, 2007)。
可以使用计算机模拟数据和对实际采样数据进行重抽样的方法来研究采样强度对网络参数的影响。一项基于模拟网络数据的研究结果表明, 对于泛化互作网络, 网络指标倾向于高估专性互作的作用; 基于物种丰富度的采样完整性估计则会导致网络的互作专化性被高估(Fründ et al, 2016)。而对实际采样数据的研究表明: 互作专化度不受采样强度和网络大小的影响(Blüthgen et al, 2006)。较低的采样强度会导致低的模块度, 而嵌套度(Nielsen & Bascompte, 2007)、连接度和互作专化度对采样强度是稳健的(Rivera-Hutinel et al, 2012; Llopis- Belenguer et al, 2023)。互作矩阵的填充度(指邻接矩阵中非0单元格的数量, 代表了互作关系的采样量)对分化度和嵌套性的影响很大, 而且对边际多度的分布也有影响(Ulrich & Gotelli, 2007)。Casas等(2018)采用自助法(bootstrapping)对节点数从16到115, 连接数从17到2,745的网络进行的模拟研究显示, 连接度、嵌套度、模块度3个指标达到稳定所需的采样强度是不同的。而且, 对于其中两个最大的网络, 重抽样可以获得稳定的网络指标, 但是对于3个最小的网络, 网络指标随着重抽样数量的增加并未呈现出逐渐稳定的趋势(Casas et al, 2018)。
专性互作可能对网络指标具有显著的影响, 但是之前尚未进行过这方面的研究。而在群落数据的分析中, 该问题已经得到了相当大的关注。尽管一对一互作在网络中的比例很高(约为40%), 而且它们可能会在某些指标的计算中非常关键, 排除一对一互作无论是对人工模拟网络还是对观测网络的指标影响都较小(Dormann et al, 2009)。对于定性指标, 对单个观测值的不敏感暗示稀有互作是随机分布的。然而, 对于定量指标, 这种不敏感暗示物种间高的互作频率在指标的计算中占主导地位。另一种可能是, 除了高频互作之外, 其他互作频率的变化对指标的影响很小。其生态学解释是, 稀有物种对二阶网络模式(如连通度、嵌套性等)的贡献不大, 暗示它们在传粉网络中的生态重要性较低。
采样的完整性不仅决定网络的组成, 还能决定网络中物种间的互作, 从而对网络指标造成影响。虽然一些研究表明网络指标对采样的完整性是稳健的, 但是这种关系可能和网络本身的特征有关。有些网络倾向于更普遍的泛化互作, 而另外一些倾向于由专性互作组成, 网络本身的性质也会决定采样完整性和网络指标间的关系。因此, 在进行网络分析之前进行采样的完整性估计是必要的步骤。而且不仅可以对个体数-物种数进行稀疏曲线估计, 还可以通过互作频率-互作关系数量的稀疏曲线来估计互作关系采样的完整性。
1.1.2 网络指标间的相关性
大量的指标为从不同角度描述网络特征提供了丰富的选项, 但是指标的冗余和指标间的相关性使得在实际分析中选择合适的指标成为一个棘手的问题。网络分析的初始数据是通过野外观察、采样得到的物种互作矩阵, 网络指标都是基于该矩阵计算得到的。各种不同的指标实际上都是在衡量维度(即物种数量)或连接(互作的数量)这两个网络特征。网络维度和连接是最基本的网络描述, 从数据的角度看, 网络指标可分为一阶指标(如物种数量、多度及其互作关系、频率)和二阶指标(如连通度和嵌套度)。由于二阶指标是基于一阶指标计算得到的, 因此可以看作一阶指标的衍生结果, 指标间的关联成为由计算方法决定的必然。在实际分析中, 选择合适的指标是分析的第一步。合理的指标选择策略应该紧扣所提出的科学问题, 在明确指标生态学意义的基础上根据研究网络的特性来选择。甚至, 在对数据的预分析中可以提供选择指标的过程, 通过主成分分析(principal component analysis, PCA)或因子分析的方法来对主要的网络指标进行概括和提炼, 以此作为指标选择的依据。对于不同类型的互作网络(例如: 传粉网络、寄生者-寄主网络、资源利用网络), 由于网络的连接所代表的生态学意义不同, 指标间可能表现出不同的相关模式。
连接度是最常用的网络指标, 与多个其他网络指标间表现出显著的相关, 如与脆弱度(vulnerability)、连接密度(linkage density)、网络不对称度(web asymmetry)、分化度成负相关, 与互作均匀度(Alatalo interaction evenness)、聚类系数(cluster coefficient)、聚集度成正相关(Dormann et al, 2009)。连接度是描述网络连接性的指标, 导致连接度和其他指标之间存在相关的原因是, 其他的网络指标可能反映了连接性的一个方面(例如: 连接的普遍度、聚集度或连接专化度)亦或不同层次(例如: 营养级水平、物种水平)的连接性。
除了对网络指标进行相关分析, 还可以对其进行聚类和主成分分析, 以探讨网络指标间的共性。基于观察到的传粉网络的标准化指标, 对网络指标进行分组的结果表明, PCA第一主轴主要代表描述高营养级物种或受高营养级物种数影响的指标, 而第二主轴主要受到低营养级物种数量、关联度(V-ratio)和普遍度(generality)的影响。网络维度对几乎所有网络指标都具有根本的影响(Dormann et al, 2009)。聚类分析展示了一些指标之间的显著相关, 例如: 脆弱度和连接密度本质上测量同一属性; 而连接度和聚类系数测量同一属性; 高营养级生态位重叠度(niche overlap of higher trophic level)和分化度也是如此。只有极少数指标提供独立的网络特征描述, 包括互作专化度、嵌套度和互作均匀度。传粉网络对随机灭绝的响应与传粉昆虫共享植物的平均数量和植物的数量高度相关。从生态学的角度来理解, 这种相关暗示高营养级物种资源利用的丰富程度(低营养级物种数量)和专化度(共享寄主数量)促进了网络的稳健性。
1.2 网络的β多样性
两个网络间互作的总差异(βWN)由βST和βOS组成), βST指由物种组成的变化导致的互作差异, βOS指共有物种互作的不同(Poisot et al, 2012), 即:
根据定义, βWN和βST将随网络间的βS (物种组成差异)而变化(附录1)。鉴于βOS是βWN的一个组成部分, 则总是满足不等式βOS ≤ βWN, 并且βST取值在0和βWN之间。取值为0表示两个网络之间的差异完全由共享物种互作不同来解释, 取值为βWN表示共享物种以相同的方式互作, 两个网络之间的所有差异都由物种组成的变化来解释。
网络中互作差异的计算参照了群落物种组成的β多样性的计算方法(Krebs, 1999)。假设两个网络A和B中, c是A中唯一的互作关系, b是B中唯一的互作关系, a是A和B中共享的互作关系, 因此, a + b + c是两个网络的总体互作关系。则两个网络A和B之间的差异(dissimilarity)计算方法如下:
网络的β多样性测量了成对网络的差异, 考虑了物种和互作沿空间、时间或环境梯度的变化, 适用于不同类型的网络和不同的β多样性测量。Poisot等(2012)将网络β多样性应用于宿主和寄生者互作网络, 结果显示物种β多样性和互作β多样性之间没有相关性, 这表明物种和互作是由不同的机制决定的。网络β多样性不仅可以用于比较不同地点间的互作关系差异, 也可用于展示地理距离与网络β多样性的关系。例如: Dáttilo和Vasconcelos (2019)发现蚂蚁和植物组成的相似性随着距离的增加而降低。Carstensen等(2014)量化了跨空间互作的β多样性, 并研究了成对互作的改变, 展示了地理距离与物种和网络β多样性之间的正相关。White等(2022)的研究结果表明, 物种更替(尤其是植物)是互作更替的主要驱动因素, 且这种贡献随环境差异而增加, 随空间距离的增加而增加。但Burkle和Alarcón (2011)基于传粉网络的研究发现, 地理距离和网络β多样性之间没有相关性, 也没有发现跨网络的互作相似性。暗示不同类型的网络β多样性模式不仅源自自身的特征, 也受非生物环境因子的强烈影响。网络的β多样性描述了两个网络互作关系的总体差异, 相当于对网络互作的类型进行了降维处理。虽然我们可以通过用环境梯度差异和网络β多样性进行相关或回归分析的方式来解释β多样性, 但是忽略了较多的细节, 在对网络β多样性的解释上丢失了较多信息。
2 对网络指标的统计分析
早期的生态网络多以单一的网络为对象, 统计、描述网络的节点组成、互作特征以及网络指标。然而人们更想探讨的问题是, 不同类型的网络指标之间是否具有统计学差异, 以及哪些因素影响了网络指标。对单一网络或少数网络的分析中, 常见的做法是与基于零模型方法的随机网络进行比较来推断网络全局指标的统计显著性, 或者使用重抽样的方法结合置换检验来对网络指标进行比较, 或对网络的β多样性进行两两比较。此外, 可以根据物种特征使用显性模型或机器学习算法对局域网络指标进行统计推断, 从物种特征解释网络的连接特性(Pichler et al, 2020)。最近, 随着大量网络数据集的累积, 已经可以结合环境因子, 在线性模型的框架下来解释影响网络指标的原因, 推断解释变量对网络组织和结构的影响, 或呈现网络β多样性与环境因子差异之间的相关性。
2.1 对网络指标的比较
计算得到的网络指标是对网络特征的描述, 因此对网络的比较即是对网络指标的比较。在现实的研究中我们常常想知道网络的指标是否具有统计学意义。统计检验的思路包括两种:
(1)零模型(null model)方法。其原假设为: 观测到的网络与随机生成的网络指标没有差异。对通过零模型方法得到的随机网络指标, 重复若干次(一般重复999次), 得到多个指标, 合并在一起即形成了指标的重抽样分布。使用重抽样指标中大于或小于观测网络指标的数量与总的指标数量的比值来近似比观测值分布更偏的重抽样网络指标的概率(即为P值), 据此概率, 做出接受或拒绝原假设的推断。
针对定性和定量的网络, 需选择合适的零模型方法。常用的零模型算法有3种: (1) Patefield算法, 该算法根据已有的定量矩阵(例如附录1中图S1(A)的植物-传粉者互作矩阵), 保持边缘和(marginal total, 行或列的总和)不变的前提下, 对单元格进行随机填充, 生成新的随机矩阵, 构建网络; (2) shuffle算法是在维持网络维度不变的情况下, 将观测的互作值散布到矩阵中; (3) swap算法首先利用Patefield算法产生矩阵, 随后将连接限制为与原始数据同样的值(Dormann et al, 2009)。
(2)自助法, 即放回重抽样。可以使用自助法对两个或多个网络指标进行比较。首先对每个网络进行多次有放回的重抽样, 然后使用置换单因素方差分析(permutation tests of analysis of variance)比较指标间的整体差异, 及两两指标之间是否具有统计显著性(Wang et al, 2022)。
上述方法都是针对少数几个网络进行比较的思路。通过这些方法, 我们可以比较处于不同时间或空间的网络指标的大小。但是, 寻找影响网络指标的原因, 并推断这些原因的作用过程, 是生态学家更进一步的目标。
2.2 用环境因子解释全局网络指标及其生态学过程
总体来看, 探讨环境因子对网络影响的分析思路有两种。其一, 对沿环境梯度构建的多个网络, 计算各自的网络指标(全局网络指标), 以网络指标为因变量, 环境因子为自变量, 在线性模型框架下进行拟合(Classen et al, 2020)。其二, 以环境因子(例如, 季节、空间的不同)之间的差异为自变量, 以网络的β多样性为因变量, 使用线性模型分析影响网络β多样性的因素(Burkle & Alarcón, 2011; White et al, 2022)。第一种分析思路的优点是可以解释环境因子对网络α多样性指标的影响, 例如: 网络的大小、连接度、嵌套性、稳定性等, 结果具有较好的解释性。第二种分析思路将环境因子首先转换为距离再作为自变量与网络的β多样性指标进行回归或相关分析, 这样可以解释环境因子之间的差异对网络β多样性(互作差异)的影响, 但是无法定量解释网络随环境的变化。
对网络指标进行因果推断使得我们可以深入理解群落对自然环境变化以及人类活动干扰的响应机制。自然环境变化, 包括气候、栖息地、海拔、斑块大小和纬度梯度的变化; 人类引起的环境变化包括人类活动引起的气候变化以及物种灭绝和入侵, 两者都可能导致物种的多度、物候、行为和物种共存的改变(肖宜安等, 2015)。这种改变不仅会影响群落的物种组成和种间互作, 还会改变生态网络的结构和动态, 甚至会导致物种灭绝等更显著的网络组成和结构变化(Tylianakis et al, 2008)。使用环境因子对网络进行统计推断需要沿环境梯度的多个网络数据, 对数据量的要求较高。而且, 除了环境梯度, 网络也会随时间而变化, 需要控制时间的影响进行分析。
环境因子并不能完全预测网络指标, 其结果会随着网络分析中包含的互作对象类群的不同而异, 如Minachilis等(2020)的研究表明, 在高海拔群落中, 熊蜂-植物(bumblebee-plant)互作网络的嵌套度增加, 但网络特化与海拔之间没有相关性。Ramos-Jiliberto等(2010)基于安第斯山脉不同海拔的植物-传粉者网络的研究发现, 在高海拔, 每种植物的潜在传粉者数量减少, 物种的度分布(degree distribution, 物种连接数量的分布)更接近随机分布。另一方面, 嵌套结构随着海拔的降低而降低, 网络模块性显著高于随机网络; 随着海拔的增加, 传粉网络组成了较少的但是更强的连接模块。Classen等(2020)对沿海拔梯度的植物-传粉者网络的研究表明, 互作专化度在不同的传粉者类群中是不同的, 但是与传粉者特征无关; 网络的稳健度在高度特化的网络中都是最低的。此外, 所研究物种的物候特性也对网络具有显著的影响。例如: Oliveira等(2022)在蝙蝠-植物互作网络的研究中发现, 与雨季相比, 在干季网络的嵌套性变低而模块性增加, 这一结果可能是由于干季食物资源变少, 对食物的竞争加剧导致的。
寻找影响网络指标的因素, 推断其背后的生态学过程是网络分析的最终目的。Tylianakis和Morris (2017)将环境变化影响网络的机制归纳为3类: (1)网络物种组成的变化。例如: 由物种的灭绝和生物入侵导致的相互作用改变, 造成网络结构的改变。特化物种更有可能灭绝, 而入侵者通常是高度泛化的, 因此这些过程增加了每个物种的平均连接数量。一些物种数量的增加导致其对其他物种互作的吸引力和互作频率增强。(2)通过改变物种行为(例如对食物或授粉植物的搜索效率)或共存(例如, 时、空上的重叠), 导致互作频率的变化。因为栖息地环境限制互作对象的分布或因为物种在空间或时间上没有重叠, 本来可能的物种互作并没有真实发生。(3)协同进化过程和模式的改变。环境因素可以改变物种互作的普遍程度, 而这些互作对系统发育趋同模式与可以产生这些模式的协同进化过程具有重要影响。因此, 考虑时、空过程能进一步解释网络的变异, 并提高网络对环境变化响应的预测。
3 从集合群落到集合网络
涉及物种互作的生态学过程可能发生在不同的空间尺度。其中一种生态学过程是由于不同的生境斑块中存在不同大小(密度)的种群, 因此在斑块间存在物种个体的扩散而导致的群落空间动态机制, 称为质量效应(mass effect) (Shmida & Wilson, 1985)。另一种是源-汇效应(source-sink effects), 用来描述种群在不同生境之间的迁移(Pulliam, 1988)。该机制中“源”指的是资源丰富、生境条件良好, 能够支持物种的生存和繁殖的地区; 而“汇”指资源相对贫乏、生境条件较差的地区, 物种在这些地区的生存和繁殖受到限制。物种从“源”位点迁入“汇”位点, 从而强化了“汇”位点的种群, “源”位点种群大小(密度)降低。例如, 物种互作可以发生在多个局域群落中, 相较于传统的基于种群动态方程的研究, 在基于多个群落的区域尺度中, 种间互作能在更大的尺度上(相比单个群落的局域尺度)影响物种定殖和灭绝。局域群落的种间互作和种群动态也会受群落间空间动态的影响, 例如那些能造成质量效应的个体水平的扩散和源-汇间的种群扩散动态。这些动态涉及较大尺度上(相比单个群落的局域尺度)多个局域群落中的种间互作, 这里研究的由多个局域群落形成的总体称为集合群落(Leibold et al, 2004)。集合群落是由多个具有互作关系的物种的扩散联系起来的一系列局域群落, 即一组存在物种扩散互作的局域群落(Wilson, 1992)。集合群落为生态学家提供了一种在更大尺度上寻求解释生态模式的原理方法, 可以识别更大空间尺度上生态系统特征变化的模式。
在集合群落中, 局域群落的结构和动态变化是由物种的种群在局域群落间的扩散和种间相互作用共同决定的。将群落的物种组成和种间互作相结合来描述群落动态是生态学家的夙愿。将多个局域群落的物种组成和种间互作相结合, 分析其差异及导致差异的原因, 产生了集合网络的概念(Thompson & Gonzalez, 2017)。集合网络呈现了局域群落中多个可以互作的物种相连接的局域群落构成, 描述了集合群落的物种组成、种间互作、动态变化模式及其影响因素。
Pilosof等(2017)提出了一个构建多层网络的框架, 整体网络包括多层, 层内为互作网络。这里的层可以表示不同时间、空间、营养级甚至不同类型的互作关系。这样的多层网络可用来表示集合群落, 每一层代表一个群落, 节点表示物种, 层内的连接表示互作, 层间的连接代表物种的扩散(图1)。这样的集合网络可以比较网络的β多样性与环境因子的相关性; 全局网络指标随环境因子(在多层网络中表示各层的环境因子)的变化; 通过对节点在层内和层间连接性的比较, 可以推断物种在集合群落中的角色和重要性; 通过将集合网络中的物种按照功能团(guild)或生物学特征(例如, 不同类群、体型、食性)进行划分, 探讨这些因素对局域网络特征(连接度、中介性、密接性)的影响。
图1
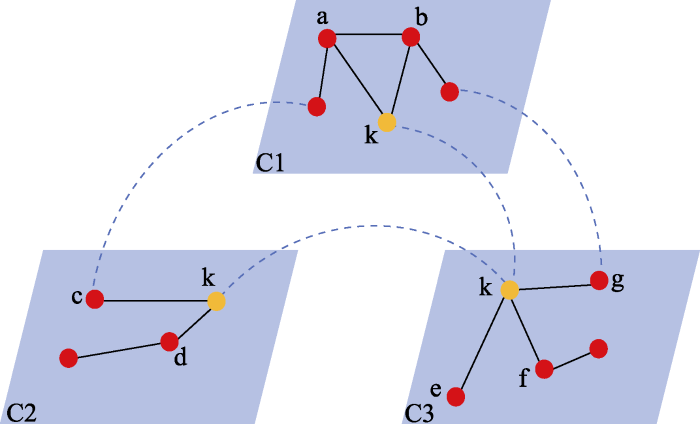
图1
具有3个层的多层网络示意图。蓝色平行四边形框表示网络的层(C1, C2, C3)。彩色圆点代表层内的网络节点, 红色表示一般节点, 黄色表示在3层中都出现的节点k。小写字母是节点标记。黑色实线为层内连接, 蓝色虚线为层间连接(仿Pilosof等(2017))。这里的层可以代表不同的时间、空间、互作类型。
Fig. 1
A schematic diagram to show a three-layered multilayer network. Blue parallelograms represent layers (C1, C2, C3) of the network. Colored dots represent network nodes for each layer, red dots denote normal nodes, yellow dots are employed to emphasize the presence of node k, which is shared across all three layers. The lowercase letters denote identity of nodes. Black lines are links within the layer, and blue dash lines represent among-layer links (simulated Pilosof et al (2017)). Layers can be of different time, space, or interaction types.
一种构建集合网络的方法是基于局域群落中的物种互作网络(二分网络), 以物种间的互作(例如, 种子-食果者互作、植物-昆虫互作)和局域群落作为网络中的节点, 边表示互作在局域群落中的存在状态(有/无数据)。由此构建的集合网络可用来识别局域群落的关键互作(例如, 连接度或中介性比较高的互作关系), 这些互作对于维持集合群落功能至关重要(Librán-Embid et al, 2021)。Li等(2020)基于构建的集合网络, 根据网络的模块内标准连接度(z值)来定量评估一个物种在模块内的中心性。用参与度(participation coefficient, PC)来描述连通度, 可以发现网络中的关键连接(关键互作关系)。连接不同栖息地的互作关系可以在不同的斑块间进行物种的扩散, 影响局域群落物种的种群动态。例如, Li等(2020)对食果鸟-树种子散布集合网络的研究表明, 当按照取食的空间分布(树上取食、树下取食、树上树下共同取食)把鸟划分成不同的功能团(guilds)时, 树上取食和树上树下共同取食的鸟类对集合网络组织的贡献更大, 而树下取食的鸟类更多地涉及到局域生态过程。Emer等(2018)基于鸟-种子散布的集合网络研究发现, 涉及大体型物种的互作在面积较小(小于10,000 ha)的斑块中消失, 暗示生境片断化对鸟-种子互作中功能多样性的强过滤作用。持续的互作发生在小种子、快速生长的植物物种以及泛化的、小体型的能够跨斑块扩散的鸟类之间。这样的集合网络将群落视为网络的一部分, 将共有的互作看作连接不同群落的网络连接, 这会导致遗漏一些能在群落间扩散的物种。基于这样的数据进行群落扩散模式的分析会出现极大的误判。对于一些能够在两个群落间扩散的物种, 与其互作的物种可能并不同时存在于两个群落中。例如, 假设一个超级泛化互作的物种k, 其在群落C1中与a、b物种发生互作, 在群落C2中与c、d物种发生互作, 在群落C3中与e、f、g物种发生互作, 这样的泛化互作物种可以与多个物种互作, 并在3个群落间扩散, 应该是连接度很高的物种(图1)。但是基于Li等(2020)和Emer等(2018)的方法, 这样的物种其连接度是不高的, 因为它在3个群落间并没有共享的连接, 也无法分析其扩散对群落的影响。这样的情况最可能发生在沿海拔梯度分布的动、植物互作网络。扩散能力强的动物可能沿海拔广泛分布, 但是与其互作的植物只能分布在特定海拔的生境中。基于互作关系构建的集合网络会低估这样的泛化互作物种在群落动态中的作用。
Fricke和Svenning (2020)基于全球植物-食果动物互作数据, 构建了全球的集合网络。该集合网络并未像Li等(2020)那样使用物种互作与局域群落的对应关系来构建, 而是直接使用物种和互作关系及其在不同区域的分布。结果发现, 物种的引入减少了生物地理层面的模块性。这种同质性的影响沿空间尺度延伸, 减少了局域网络的β多样性和局域网络的模块性。生物入侵引起的物种互作的发生率与人类对环境的修饰程度直接相关, 而且在逐渐提速, 在过去的75年间增加了7倍。这些动态改变了互利共生物种的协同进化环境, 而且外来种与其他外来种之间具有更高的互作比例。这些过程很可能会加剧未来生态系统中生物同质化的趋势, 同时可能会降低生态系统的弹性, 因为它们会使干扰更快地传播, 并使不同的生态系统面临类似的压力。相比于物种互作关系-斑块构建的集合网络, 基于物种及其互作关系构建的网络更加直接。Fricke和Svenning (2020)根据物种及其互作关系构建集合网络, 将不同的群落作为影响集合网络节点的空间解释变量(节点的属性), 在呈现集合网络特性以及对节点局域网络指标的解释上更加直接。
集合网络的研究能促进景观水平对群落动态的理解。Hall等(2022)的研究表明, 景观水平的集合网络可以识别传粉者提供的生态系统服务, 并以多种方式制定保护目标, 从而确保实施针对性的物种保护措施。也会从物种的生物地理特征(例如系统地理分布、范围动态)、种间互作或迁徙习性方面提供与局域网络互补的新视角。
4 总结与展望
生态网络结合了群落的物种组成及其互作关系两方面数据, 扩展了人们看待群落的方式。网络分析可以与群落生态学的不同方向、不同尺度的研究进行整合。网络分析与群落构建的理念相结合可用于分析进化因素和物种特征在网络组织和互作形成中的作用。从对单个网络指标的描述和稳定性分析到对沿着环境梯度解释网络β多样性的成因, 及至与集合群落的理念结合, 解释物种及其互作关系在区域尺度的动态变化。网络分析为群落的组织、形成及动态变化的研究提供了新的观察角度和理解方式, 展现出强大的解释力。生态网络分析常常定位于以下科学问题:
(1)网络基本属性和特征。一个特定的网络由哪些节点组成? 具有怎样的互作特征? 节点的特征在网络的组织中发挥着怎样的作用? 如何根据节点特征预测可能的网络互作? 哪些节点或互作是网络的核心节点或核心互作? 这些核心节点或核心互作在网络的组织和稳定性维持中具有怎样的作用? 节点或连接对网络稳定性的贡献对制定生物多样性保护策略具有怎样的启示?
(3)物种共存与生态网络。基于物种共存数据, 如何准确地预测互作网络? 能否根据已有的物种互作预测未观测到的物种互作?
基于上述问题的研究日益增加, 而在网络分析的实践中仍有以下3方面不足有待解决。其一, 如何将进化关系纳入网络分析的考量, 参考物种的进化历史, 揭示网络的形成机制? 物种系统发育在很大程度上决定了互作伙伴、模块组成、物种角色和嵌套模式, 尽管这些影响在不同类型的网络中并不总是一致的(Peralta, 2016; Bastazini et al, 2017)。目前的网络分析大部分都尚未考虑物种之间的系统发育关系。Rafferty和Ives (2013)提出的系统发育线性混合模型(phylogenetic linear mixed model, PLMM)将种间成对互作的强度作为因变量, 将两个互作类群的系统发育距离作为协变量, 分析物种特征对互作强度的影响。Gallinat和Pearse (2021)提出的系统发育广义线性混合模型(phylogenetic generalized linear mixed model, PGLMM)可用于回答以下问题: (1)区域尺度物种对环境的响应是否受到进化约束? (2)进化上物种对竞争的反应如何影响现存的种间竞争? (3)类群间的关联是否受到进化约束? 虽然上述研究提出了将系统发育与网络分析相结合的研究框架, 但是研究性论文仍然缺乏。结合系统发育关系从进化的角度揭示网络的构造, 会提供更有启发性的解释。将网络分析与群落构建理论相融合, 同时探讨进化历史(系统发育关系匹配、特征演化)和物种互作(互作频率、特征匹配)对群落的塑造机制会更有解释力。其二, 如何将不同类型的互作网络统一起来, 呈现一个完整群落的组成和动态, 即多层网络? 哪些指标能够描述多层网络? 目前的网络分析大多是基于某种特定的种间互作关系(例如: 传粉、取食或寄生等), 或者一个特定的营养级来构建网络。然而, 在现实的群落中, 这些不同类型、不同营养级的网络之间也存在互作。如何将这些不同类型的网络统一到一个框架之内进行综合分析, 需要理念和方法上的创新。使用机器学习算法和多层网络理念探讨环境变化对网络结构和功能的影响, 实现理论和实证研究的整合是值得探索的方向(李海东等, 2021)。其三, 如前文所述, 目前有两种不同的思路来进行集合网络分析。如果分析方法不同可能无法在不同研究之间进行比较, 因此有必要统一对集合网络的分析思路, 形成一致的分析方法。
在群落生态学的研究中, 网络不仅可以呈现不同类型的种间互作关系, 也可以通过构建物种-资源利用网络呈现物种对资源的利用关系(Marini et al, 2019)。构建物种-资源利用网络需要合理的解释网络指标的生态学意义, 许多已有的网络指标可用于描述物种在资源利用上的重叠、分化或嵌套。例如, 描述二分网络嵌套性的多个指标最初用来描述物种在岛屿上的嵌套分布(刘灿然等, 2002; Almeida-Neto et al, 2008), 在一个物种-资源网络中, 嵌套性可用来描述物种资源利用的嵌合度。在实际分析中, 网络的构建和指标的选择没有固定的标准, 应该从具体的问题出发。指标选择是否合理的评判依据是其能否有效地呈现互作关系, 是否具有生态学意义, 以及通过对网络指标的分析能否解释网络的结构动态和影响因素。
附录 Supplementary Material
附录1 网络指标及其生态学意义
Appendix 1 Description of network metrics and their ecological significance
参考文献
A consistent metric for nestedness analysis in ecological systems: Reconciling concept and measurement
DOI:10.1111/j.0030-1299.2008.16644.x URL [本文引用: 2]
A straightforward computational approach for measuring nestedness using quantitative matrices
Mutualistic networks
DOI:10.1890/080026 URL [本文引用: 1]
Untangling the tangled bank: A novel method for partitioning the effects of phylogenies and traits on ecological networks
DOI:10.1007/s11692-017-9409-8 [本文引用: 1]
Assembly rules within a contingent ecology
DOI:10.2307/3546646 URL [本文引用: 1]
Co-occurrence is not evidence of ecological interactions
DOI:10.1111/ele.13525
PMID:32429003
[本文引用: 1]

There is a rich amount of information in co-occurrence (presence-absence) data that could be used to understand community assembly. This proposition first envisioned by Forbes (1907) and then Diamond (1975) prompted the development of numerous modelling approaches (e.g. null model analysis, co-occurrence networks and, more recently, joint species distribution models). Both theory and experimental evidence support the idea that ecological interactions may affect co-occurrence, but it remains unclear to what extent the signal of interaction can be captured in observational data. It is now time to step back from the statistical developments and critically assess whether co-occurrence data are really a proxy for ecological interactions. In this paper, we present a series of arguments based on probability, sampling, food web and coexistence theories supporting that significant spatial associations between species (or lack thereof) is a poor proxy for ecological interactions. We discuss appropriate interpretations of co-occurrence, along with potential avenues to extract as much information as possible from such data.© 2020 John Wiley & Sons Ltd/CNRS.
Next-generation cophylogeny: Unravelling eco-evolutionary processes
DOI:10.1016/j.tree.2021.06.006 URL [本文引用: 1]
Measuring specialization in species interaction networks
Network analyses of plant-animal interactions hold valuable biological information. They are often used to quantify the degree of specialization between partners, but usually based on qualitative indices such as 'connectance' or number of links. These measures ignore interaction frequencies or sampling intensity, and strongly depend on network size.Here we introduce two quantitative indices using interaction frequencies to describe the degree of specialization, based on information theory. The first measure (d') describes the degree of interaction specialization at the species level, while the second measure (H2') characterizes the degree of specialization or partitioning among two parties in the entire network. Both indices are mathematically related and derived from Shannon entropy. The species-level index d' can be used to analyze variation within networks, while H2' as a network-level index is useful for comparisons across different interaction webs. Analyses of two published pollinator networks identified differences and features that have not been detected with previous approaches. For instance, plants and pollinators within a network differed in their average degree of specialization (weighted mean d'), and the correlation between specialization of pollinators and their relative abundance also differed between the webs. Rarefied sampling effort in both networks and null model simulations suggest that H2' is not affected by network size or sampling intensity.Quantitative analyses reflect properties of interaction networks more appropriately than previous qualitative attempts, and are robust against variation in sampling intensity, network size and symmetry. These measures will improve our understanding of patterns of specialization within and across networks from a broad spectrum of biological interactions.
The future of plant-pollinator diversity: Understanding interaction networks across time, space, and global change
DOI:10.3732/ajb.1000391
PMID:21613144
[本文引用: 2]
Structural analysis of plant-pollinator networks has revealed remarkably high species and interaction diversity and highlighted the species important for pollination services. Although techniques to analyze plant-pollinator networks began to emerge a decade ago, the characterization of spatiotemporal variation of interactions is still in its infancy. Understanding the ecological and evolutionary causes and consequences of spatial and temporal variation in plant-pollinator interactions is important for both basic and applied questions in community structure and function, the evolution of floral traits, and the development of optimal conservation strategies. Here we review observational, theoretical, and experimental studies of temporal and spatial variation in plant-pollinator interaction networks to establish a foundation for future studies to incorporate perspectives in spatiotemporal variation. Such perspectives are crucial given the rapid environmental changes associated with habitat loss, climate change, and biological invasions, which we discuss in this context. The inherent plasticity of plant-pollinator interactions and network structure suggests that many species should be able to persist by responding to environmental changes quickly, even though the identity of their mutualistic partners may change.
The beta-diversity of species interactions: Untangling the drivers of geographic variation in plant-pollinator diversity and function across scales
DOI:10.3732/ajb.1500079
PMID:26590380
[本文引用: 1]
Geographic patterns of biodiversity have long inspired interest in processes that shape the assembly, diversity, and dynamics of communities at different spatial scales. To study mechanisms of community assembly, ecologists often compare spatial variation in community composition (beta-diversity) across environmental and spatial gradients. These same patterns inspired evolutionary biologists to investigate how micro- and macro-evolutionary processes create gradients in biodiversity. Central to these perspectives are species interactions, which contribute to community assembly and geographic variation in evolutionary processes. However, studies of beta-diversity have predominantly focused on single trophic levels, resulting in gaps in our understanding of variation in species-interaction networks (interaction beta-diversity), especially at scales most relevant to evolutionary studies of geographic variation.We outline two challenges and their consequences in scaling-up studies of interaction beta-diversity from local to biogeographic scales using plant-pollinator interactions as a model system in ecology, evolution, and conservation.First, we highlight how variation in regional species pools may contribute to variation in interaction beta-diversity among biogeographic regions with dissimilar evolutionary history. Second, we highlight how pollinator behavior (host-switching) links ecological networks to geographic patterns of plant-pollinator interactions and evolutionary processes. Third, we outline key unanswered questions regarding the role of geographic variation in plant-pollinator interactions for conservation and ecosystem services (pollination) in changing environments.We conclude that the largest advances in the burgeoning field of interaction beta-diversity will come from studies that integrate frameworks in ecology, evolution, and conservation to understand the causes and consequences of interaction beta-diversity across scales.© 2016 Botanical Society of America.
Beta diversity of plant-pollinator networks and the spatial turnover of pairwise interactions
Assessing sampling sufficiency of network metrics using bootstrap
DOI:10.1016/j.ecocom.2018.09.005 URL [本文引用: 2]
Evaluating sampling completeness in a desert plant-pollinator network
DOI:10.1111/j.1365-2656.2011.01883.x
PMID:21815890
[本文引用: 1]
1. The study of plant-pollinator interactions in a network context is receiving increasing attention. This approach has helped to identify several emerging network patterns such as nestedness and modularity. However, most studies are based only on qualitative information, and some ecosystems, such as deserts and tropical forests, are underrepresented in these data sets. 2. We present an exhaustive analysis of the structure of a 4-year plant-pollinator network from the Monte desert in Argentina using qualitative and quantitative tools. We describe the structure of this network and evaluate sampling completeness using asymptotic species richness estimators. Our goal is to assess the extent to which the realized sampling effort allows for an accurate description of species interactions and to estimate the minimum number of additional censuses required to detect 90% of the interactions. We evaluated completeness of detection of the community-wide pollinator fauna, of the pollinator fauna associated with each plant species and of the plant-pollinator interactions. We also evaluated whether sampling completeness was influenced by plant characteristics, such as flower abundance, flower life span, number of interspecific links (degree) and selectiveness in the identity of their flower visitors, as well as sampling effort. 3. We found that this desert plant-pollinator network has a nested structure and that it exhibits modularity and high network-level generalization. 4. In spite of our high sampling effort, and although we sampled 80% of the pollinator fauna, we recorded only 55% of the interactions. Furthermore, although a 64% increase in sampling effort would suffice to detect 90% of the pollinator species, a fivefold increase in sampling effort would be necessary to detect 90% of the interactions. 5. Detection of interactions was incomplete for most plant species, particularly specialists with a long flowering season and high flower abundance, or generalists with short flowering span and scant flowers. Our results suggest that sampling of a network with the same effort for all plant species is inadequate to sample interactions. 6. Sampling the diversity of interactions is labour intensive, and most plant-pollinator networks published to date are likely to be undersampled. Our analysis allowed estimating the completeness of our sampling, the additional effort needed to detect most interactions and the plant traits that influence the detection of their interactions.© 2011 The Authors. Journal of Animal Ecology © 2011 British Ecological Society.
Spatial scale dictates the productivity-biodiversity relationship
Variation in plant-pollinator network structure along the elevational gradient of the San Francisco Peaks, Arizona
DOI:10.3390/insects12121060
URL
[本文引用: 1]
The structural patterns comprising bimodal pollination networks can help characterize plant–pollinator systems and the interactions that influence species distribution and diversity over time and space. We compare network organization of three plant–pollinator communities along the altitudinal gradient of the San Francisco Peaks in northern Arizona. We found that pollination networks become more nested, as well as exhibit lower overall network specialization, with increasing elevation. Greater weight of generalist pollinators at higher elevations of the San Francisco Peaks may result in plant–pollinator communities less vulnerable to future species loss due to changing climate or shifts in species distribution. We uncover the critical, more generalized pollinator species likely responsible for higher nestedness and stability at the higher elevation environment. The generalist species most important for network stability may be of the greatest interest for conservation efforts; preservation of the most important links in plant–pollinator networks may help secure the more specialized pollinators and maintain species redundancy in the face of ecological change, such as changing climate.
Specialization of plant-pollinator interactions increases with temperature at Mt
Macroecological patterns and correlates of ant-tree interaction networks in Neotropical savannas
DOI:10.1111/geb.v28.9 URL [本文引用: 2]
Indices, graphs and null models: Analyzing bipartite ecological networks
DOI:10.2174/1874213000902010007 URL [本文引用: 4]
Introducing the bipartite package: Analysing ecological networks
Seed-dispersal interactions in fragmented landscapes—A metanetwork approach
DOI:10.1111/ele.2018.21.issue-4 URL [本文引用: 3]
A directed network analysis of heterospecific pollen transfer in a biodiverse community
Community studies have shown that plant species are often pollinated by multiple pollinators; however, networks of heterospecific pollen transfer (HPT) in natural communities remain largely unexplored. We analyzed pollen deposition on stigmas of 57 flowering species to build a picture of plant-plant interactions via HPT in a biodiverse alpine meadow in southwest China. Plant species were categorized as pollen donors or recipients by their link numbers and link qualities. We identified 3609 heterospecific pollen grains, representing 410 links among 69 pollen species. Each plant species received on average 7.2 pollen species and donated its pollen to 5.5 species; only a few species donated or received large amounts of pollen or pollen from a large number of species. Compared to specialized plants, generalized plants tended to receive more heterospecific pollen but exported no more pollen to other species. Plant position in the network was related to both floral traits (stigma position) and pollinator generalization level. When different species share the same pollinator, bidirectional HPT may occur, but this was rarely observed in the species-rich community, indicating that interspecific pollen interference was largely unidirectional. Our study highlights the importance of understanding how sympatric flowering plants reduce deleterious effects of HPT, for example via stigma position. This study is the first to present a pollen transfer network for an entire community and to unravel its properties using directed network analysis.
Species co-occurrence networks: Can they reveal trophic and non-trophic interactions in ecological communities?
DOI:10.1002/ecy.2142
PMID:29336480
[本文引用: 2]
Co-occurrence methods are increasingly utilized in ecology to infer networks of species interactions where detailed knowledge based on empirical studies is difficult to obtain. Their use is particularly common, but not restricted to, microbial networks constructed from metagenomic analyses. In this study, we test the efficacy of this procedure by comparing an inferred network constructed using spatially intensive co-occurrence data from the rocky intertidal zone in central Chile to a well-resolved, empirically based, species interaction network from the same region. We evaluated the overlap in the information provided by each network and the extent to which there is a bias for co-occurrence data to better detect known trophic or non-trophic, positive or negative interactions. We found a poor correspondence between the co-occurrence network and the known species interactions with overall sensitivity (probability of true link detection) equal to 0.469, and specificity (true non-interaction) equal to 0.527. The ability to detect interactions varied with interaction type. Positive non-trophic interactions such as commensalism and facilitation were detected at the highest rates. These results demonstrate that co-occurrence networks do not represent classical ecological networks in which interactions are defined by direct observations or experimental manipulations. Co-occurrence networks provide information about the joint spatial effects of environmental conditions, recruitment, and, to some extent, biotic interactions, and among the latter, they tend to better detect niche-expanding positive non-trophic interactions. Detection of links (sensitivity or specificity) was not higher for well-known intertidal keystone species than for the rest of consumers in the community. Thus, as observed in previous empirical and theoretical studies, patterns of interactions in co-occurrence networks must be interpreted with caution, especially when extending interaction-based ecological theory to interpret network variability and stability. Co-occurrence networks may be particularly valuable for analysis of community dynamics that blends interactions and environment, rather than pairwise interactions alone.© 2018 by the Ecological Society of America.
Accelerating homogenization of the global plant-frugivore meta-network
DOI:10.1038/s41586-020-2640-y [本文引用: 3]
Sampling bias is a challenge for quantifying specialization and network structure: Lessons from a quantitative niche model
DOI:10.1111/oik.2016.v125.i4 URL [本文引用: 1]
Phylogenetic generalized linear mixed modeling presents novel opportunities for eco-evolutionary synthesis
DOI:10.1111/oik.2021.v130.i5 URL [本文引用: 1]
The structure of ecological networks across levels of organization
DOI:10.1146/ecolsys.2020.51.issue-1 URL [本文引用: 2]
Pollen-insect interaction meta-networks identify key relationships for conservation in mosaic agricultural landscapes
The effect of network size and sampling completeness in depauperate networks
DOI:10.1111/1365-2656.12912
PMID:30291749
[本文引用: 2]
The accurate estimation of interaction network structure is essential for understanding network stability and function. A growing number of studies evaluate under-sampling as the degree of sampling completeness (proportional richness observed). How the relationship between network structural metrics and sampling completeness varies across networks of different sizes remains unclear, but this relationship has implications for the within- and between-system comparability of network structure. Here, we test the combined effects of network size and sampling completeness on the structure of spatially distinct networks (i.e., subwebs) in a host-parasitoid model system to better understand the within-system variability in metric bias. Richness estimates were used to quantify a gradient of sampling completeness of species and interactions across randomly subsampled subwebs. The combined impacts of network size and sampling completeness on the estimated values of twelve unweighted and weighted network metrics were tested. The robustness of network metrics to under-sampling was strongly related to network size, and sampling completeness of interactions were generally a better predictor of metric bias than sampling completeness of species. Weighted metrics often performed better than unweighted metrics at low sampling completeness; however, this was mainly evident at large rather than small subweb size. These outcomes highlight the significance of under-sampling for the comparability of both unweighted and weighted network metrics when networks are small and vary in size. This has implications for within-system comparability of species-poor networks and, more generally, reveals problems with under-sampling ecological networks that may otherwise be difficult to detect in species-rich networks. To mitigate the impacts of under-sampling, more careful considerations of system-specific variation in metric bias are needed.© 2018 The Authors. Journal of Animal Ecology © 2018 British Ecological Society.
Studies on plant-pollinator interaction and its significances
DOI:10.1360/biodiv.070294 URL [本文引用: 1]
植物与传粉者相互作用的研究及其意义
DOI:10.1360/biodiv.070294
[本文引用: 1]
The majority of flowering plants and crops rely in whole or part on animals for pollination. The mutualism between plants and pollinators has attracted ecologists and evolutionists to use this type of interspecific interaction as a model system to study species adaptation and diversification since Charles Darwin. Recent debate on the nature of pollination systems call for studies of this interaction at different levels, ranging from single species to entire communities in a given area. At the species level, detailed studies suggest that floral traits are under selection from mutualists and antagonists as well as the physical environment. In contrast, studies at community-level are rare, but recent analyses indicate considerable spatial and temporal variation in both generalized and specialized pollination systems. This special issue of Biodiversity Science focuses on plant-pollinator interaction, presenting current research status in this area from China. Papers include floral traits and pollinator behaviors addressed by phenotypic manipulation, estimates of pollen removal and receipt, anatomy of flowers, histochemistry analysis and spatial and temporal comparison. The taxa being investigated include wild orchid and cultivated legume, endemic, endangered and invasive species with diverse sexual systems. These thirteen experimental studies and three reviews show the development of pollination biology in China and expose how to facilitate our understanding of the critical ecological proc-esses underlying interspecific interaction in both natural and agricultural ecosystems.
A better understanding of ecological networks needs studying plant-pollinator interactions
DOI:10.17520/biods.2018154 URL [本文引用: 1]
了解生态网络需要监测植物与传粉者的相互作用
DOI:10.17520/biods.2018154 [本文引用: 1]
How phylogeny shapes the taxonomic and functional structure of plant-insect networks
DOI:10.1007/s00442-016-3552-2
PMID:26787076
[本文引用: 1]
Phylogenetically related species share a common evolutionary history and may therefore have similar traits. In terms of interaction networks, where traits are a major determinant, related species should therefore interact with other species which are also related. However, this prediction is challenged by current evidence that there is a weak, albeit significant, phylogenetic signal in species' taxonomic niche, i.e., the identity of interacting species. We studied mutualistic and antagonistic plant-insect interaction networks in species-rich alpine meadows and show that there is instead a very strong phylogenetic signal in species' functional niches-i.e., the mean functional traits of their interactors. This pattern emerges because related species tend to interact with species bearing certain traits that allow biotic interactions (pollination, herbivory) but not necessarily with species from all the same evolutionary lineages. Those traits define a set of potential interactors and show clear patterns of phylogenetic clustering on several portions of plants and insect phylogenies. Thus, this emerging pattern of low phylogenetic signal in taxonomic niches but high phylogenetic signal in functional niches may be driven by the interplay between functional trait convergence across plants' and insects' phylogenies and random sampling of the potential interactors.
Ecological Methodology, 2nd edn
Beta diversity and specialization in plant-pollinator networks along an elevational gradient
DOI:10.1111/jbi.13615
[本文引用: 1]
Aim To assess whether the reduced nutritional resources available for pollinators due to plant community simplification along an elevational plant-diversity gradient changes pollinator niche breadth and richness. Additionally, we evaluated how body size and proboscis length of pollinators shifted along the gradient, and whether these changes were related to pollinator niche breadth. Location An elevational gradient (2,350-3,520 m a.s.l.) on the oceanic high-mountain strato-volcano of El Teide (Tenerife, Canary Islands). Taxon Flowering plant and pollinator species. Methods We compared quantitative plant-pollinator networks along the plant-diversity gradient. We calculated a set of niche-based topological metrics that capture the degree of specialization, niche breadth and niche overlap. Furthermore, we obtained beta-diversity measures and the proportion of replacement and richness components. Results There was an overall decline in species richness of pollinators with increasing elevation. This decline was mainly driven by the loss of species along the elevational gradient, which conformed a nested subset pattern. The whole network showed less specialization, greater connectance and lower modularity towards the summit. At high elevations, pollinators were more generalized and less selective in their flower choice, showing a greater trophic niche breadth compared to pollinators at lower elevations. Mean body size of pollinators increased with elevation, and species body size and proboscis length were positively associated with the number of plant species visited. Main conclusions Overall, results indicated that the elevational gradient filters pollinator species, probably according to their thermal tolerance and ability to exploit a wide range of trophic resources. The finding that pollinators become more generalized and opportunistic at higher elevations is a novel result, which may have implications for new research into how ecological networks vary over environmental gradients. From an applied perspective, our results highlight the importance of considering the spatial variation of species assemblages when aiming to construct functionally reliable interaction networks along environmental gradients.
The metacommunity concept: A framework for multi-scale community ecology
DOI:10.1111/ele.2004.7.issue-7 URL [本文引用: 1]
The functional roles of species in metacommunities, as revealed by metanetwork analyses of bird-plant frugivory networks
DOI:10.1111/ele.v23.8 URL [本文引用: 5]
Assembly, ecosystem functions, and stability in species interaction networks
DOI:10.17521/cjpe.2019.0159 URL [本文引用: 1]
种间互作网络的结构、生态系统功能及稳定性机制研究
DOI:10.17521/cjpe.2019.0159
[本文引用: 1]
生态群落中不同物种间发生多样化的相互作用, 形成了复杂的种间互作网络。复杂生态网络的结构如何影响群落的生态系统功能及稳定性是群落生态学的核心问题之一。种间互作直接影响到物质和能量在生态系统不同组分之间的流动和循环以及群落构建过程, 使得网络结构与生态系统功能和群落稳定性密切相关。在群落及生态系统水平上开展种间互作网络研究将为群落的构建机制、生物多样性维持、生态系统稳定性、物种协同进化和性状分化等领域提供新的视野。当前生物多样性及生态系统功能受到全球变化的极大影响, 研究种间互作网络的拓扑结构、构建机制、稳定性和生态功能也可为生物多样性的保护和管理提供依据。该文从网络结构、构建机制、网络结构和稳定性关系、种间互作对生态系统功能的影响等4个方面综述当前种间网络研究进展, 并提出在今后的研究中利用机器学习和多层网络等来探究环境变化对种间互作网络结构和功能的影响, 并实现理论和实证研究的有效整合。
A plant-pollinator metanetwork along a habitat fragmentation gradient
DOI:10.1111/ele.13892
PMID:34612562
[本文引用: 2]
To understand how plant-pollinator interactions respond to habitat fragmentation, we need novel approaches that can capture properties that emerge at broad scales, where multiple communities engage in metanetworks. Here we studied plant-pollinator interactions over 2 years on 29 calcareous grassland fragments selected along independent gradients of habitat size and surrounding landscape diversity of cover types. We associated network centrality of plant-pollinator interactions and grassland fragments with their ecological and landscape traits, respectively. Interactions involving habitat specialist plants and large-bodied pollinators were the most central, implying that species with these traits form the metanetwork core. Large fragments embedded in landscapes with high land cover diversity exhibited the highest centrality; however, small fragments harboured many unique interactions not found on larger fragments. Intensively managed landscapes have reached a point in which all remaining fragments matter, meaning that losing any further areas may vanish unique interactions with unknown consequences for ecosystem functioning.© 2021 The Authors. Ecology Letters published by John Wiley & Sons Ltd.
Nestedness: Methods mechanisms and implications for biological conservation
嵌套性: 研究方法、形成机制及其对生物保护的意义
岛屿或者“生境岛”中的生物区系常常显示出一种嵌套结构,即物种较贫乏的岛屿中的物种是物种较丰富的岛屿中的物种的一个适当的子集,如果将各个岛屿中的生物区系排列起来就形成一个嵌套的序列。与种-面积关系一样,嵌套结构在很多生境类型和生物类群中也都存在。嵌套性对生物保护也有一定的意义,特别是与SLOSS争论(是单个大的还是几个小的保护区能保护更多的物种)有一定关系。在过去的十几年中,已经提出了一些方法,可以对嵌套性进行定量刻画和统计检验。同时,对嵌套性的形成机制也进行了大量的研究,其中选择性的迁移和选择性的灭绝是两个主要的原因。由于嵌套性分析只需要物种的存在) 不存在数据,使得很多调查数据都能够利用起来,因此,这是一个值得深入研究的领域。
Sensitivity of bipartite network analyses to incomplete sampling and taxonomic uncertainty
Species- habitat networks: A tool to improve landscape management for conservation
DOI:10.1111/jpe.2019.56.issue-4 URL [本文引用: 1]
Weak trophic interactions and the balance of nature
Bumblebee diversity and pollination networks along the elevation gradient of Mount Olympus, Greece
DOI:10.1111/ddi.v26.11 URL [本文引用: 1]
Ecological networks, nestedness and sampling effort
DOI:10.1111/jec.2007.95.issue-5 URL [本文引用: 2]
Diversity indices for ecological networks: A unifying framework using Hill numbers
DOI:10.1111/ele.13221
PMID:30675974
[本文引用: 2]
Describing how ecological interactions change over space and time and how they are shaped by environmental conditions is crucial to understand and predict ecosystem trajectories. However, it requires having an appropriate framework to measure network diversity locally, regionally and between samples (α-, γ- and β-diversity). Here, we propose a unifying framework that builds on Hill numbers and accounts both for the probabilistic nature of biotic interactions and the abundances of species or groups. We emphasise the importance of analysing network diversity across different species aggregation levels (e.g. from species to trophic groups) to get a better understanding of network structure. We illustrate our framework with a simulation experiment and an empirical analysis using a global food-web database. We discuss further usages of the framework and show how it responds to recent calls on comparing ecological networks and analysing their variation across environmental gradients and time.© 2019 John Wiley & Sons Ltd/CNRS.
The structure of tropical bat-plant interaction networks during an extreme El Niño-Southern Oscillation event
DOI:10.1111/mec.16363
PMID:35064726
[本文引用: 1]
Interaction network structure reflects the ecological mechanisms acting within biological communities, which are affected by environmental conditions. In tropical forests, higher precipitation usually increases fruit production, which may lead frugivores to increase specialization, resulting in more modular and less nested animal-plant networks. In these ecosystems, El Niño is a major driver of precipitation, however, we still lack knowledge of how species interactions change under this influence. To understand bat-plant network structure during an extreme ENSO event, we determined the links between frugivorous bat species and the plants they consume by DNA barcoding seeds and pulp in bat faeces. These interactions were recorded in the dry forest and rainforest of Costa Rica, during the dry and the wet seasons of an extreme El Niño year. From these we constructed seasonal and whole-year bat-plant networks and analyzed their structures and dissimilarities. In general, networks had low nestedness, high modularity, and were dominated by one large compartment which included most species and interactions. Contrary to our expectations, networks were less nested and more modular in drier conditions, both in the comparison between forest types and between seasons. We suggest that increased competition, when resources are scarce during drier seasons and habitats, lead to higher resource partitioning among bats and thus higher modularity. Moreover, we have found similar network structures between dry and rainforests during El Niño and non El Niño years. Finally, most interaction dissimilarity among networks occurred due to interaction rewiring among species, potentially driven by seasonal changes in resource availability.This article is protected by copyright. All rights reserved.
Merging evolutionary history into species interaction networks
DOI:10.1111/fec.2016.30.issue-12 URL [本文引用: 1]
Machine learning algorithms to infer trait-matching and predict species interactions in ecological networks
DOI:10.1111/mee3.v11.2 URL [本文引用: 1]
The multilayer nature of ecological networks
The dissimilarity of species interaction networks
DOI:10.1111/ele.12002
PMID:22994257
[本文引用: 4]
In a context of global changes, and amidst the perpetual modification of community structure undergone by most natural ecosystems, it is more important than ever to understand how species interactions vary through space and time. The integration of biogeography and network theory will yield important results and further our understanding of species interactions. It has, however, been hampered so far by the difficulty to quantify variation among interaction networks. Here, we propose a general framework to study the dissimilarity of species interaction networks over time, space or environments, allowing both the use of quantitative and qualitative data. We decompose network dissimilarity into interactions and species turnover components, so that it is immediately comparable to common measures of β-diversity. We emphasise that scaling up β-diversity of community composition to the β-diversity of interactions requires only a small methodological step, which we foresee will help empiricists adopt this method. We illustrate the framework with a large dataset of hosts and parasites interactions and highlight other possible usages. We discuss a research agenda towards a biogeographical theory of species interactions.© 2012 Blackwell Publishing Ltd/CNRS.
A network perspective for community assembly
DOI:10.3389/fevo.2019.00103 URL [本文引用: 1]
Network thinking in ecology and evolution
DOI:10.1016/j.tree.2005.04.004 URL [本文引用: 3]
Sources, sinks, and population regulation
DOI:10.1086/284880 URL [本文引用: 1]
Phylogenetic trait-based analyses of ecological networks
Ecological networks of two interacting guilds of species, such as flowering plants and pollinators, are common in nature, and studying their structure can yield insights into their resilience to environmental disturbances. Here we develop analytical methods for exploring the strengths of interactions within bipartite networks consisting of two guilds of phylogenetically related species. We then apply these methods to investigate the resilience of a plant-pollinator community to anticipated climate change. The methods allow the statistical assessment of, for example, whether closely related pollinators are more likely to visit plants with similar relative frequencies, and whether closely related pollinators tend to visit closely related plants. The methods can also incorporate trait information, allowing us to identify which plant traits are likely responsible for attracting different pollinators. These questions are important for our study of 14 prairie plants and their 22 insect pollinators. Over the last 70 years, six of the plants have advanced their flowering, while eight have not. When we experimentally forced earlier flowering times, five of the six advanced-flowering species experienced higher pollinator visitation rates, whereas only one of the eight other species had more visits; this network thus appears resilient to climate change, because those species with advanced flowering have ample pollinators earlier in the season. Using the methods developed here, we show that advanced-flowering plants did not have a distinct pollinator community from the other eight species. Furthermore, pollinator phylogeny did not explain pollinator community composition; closely related pollinators were not more likely to visit the same plant species. However, differences among pollinator communities visiting different plants were explained by plant height, floral color, and symmetry. As a result, closely related plants attracted similar numbers of pollinators. By parsing out characteristics that explain why plants share pollinators, we can identify plant species that likely share a common fate in a changing climate.
Topological change of Andean plant-pollinator networks along an altitudinal gradient
DOI:10.1016/j.ecocom.2009.06.001 URL [本文引用: 1]
Effects of sampling completeness on the structure of plant-pollinator networks
DOI:10.1890/11-1803.1
PMID:22919906
[本文引用: 1]
Plant-animal interaction networks provide important information on community organization. One of the most critical assumptions of network analysis is that the observed interaction patterns constitute an adequate sample of the set of interactions present in plant-animal communities. In spite of its importance, few studies have evaluated this assumption, and in consequence, there is no consensus on the sensitivity of network metrics to sampling methodological shortcomings. In this study we examined how variation in sampling completeness influences the estimation of six network metrics frequently used in the literature (connectance, nestedness, modularity, robustness to species loss, path length, and centralization). We analyzed data of 186 flowering plants and 336 pollinator species in 10 networks from a forest-fragmented system in central Chile. Using species-based accumulation curves, we estimated the deviation of network metrics in undersampled communities with respect to exhaustively sampled communities and the effect of network size and sampling evenness on network metrics. Our results indicate that: (1) most metrics were affected by sampling completeness but differed in their sensitivity to sampling effort; (2) nestedness, modularity, and robustness to species loss were less influenced by insufficient sampling than connectance, path length, and centralization; (3) robustness was mildly influenced by sampling evenness. These results caution studies that summarize information from databases with high, or unknown, heterogeneity in sampling effort per species and should stimulate researchers to report sampling intensity to standardize its effects in the search for broad patterns in plant-pollinator networks.
Network analysis: Ten years shining light on host- parasite interactions
DOI:10.1016/j.pt.2021.01.005
PMID:33558197
[本文引用: 1]
Biological interactions are key drivers of ecological and evolutionary processes. The complexity of such interactions hinders our understanding of ecological systems and our ability to make effective predictions in changing environments. However, network analysis allows us to better tackle the complexity of ecosystems because it extracts the properties of an ecological system according to the number and distribution of links among interacting entities. The number of studies using network analysis to solve ecological and evolutionary questions in parasitology has increased over the past decade. Here, we synthesise the contribution of network analysis toward disentangling host-parasite processes. Furthermore, we identify current trends in mainstream ecology and novel applications of network analysis that present opportunities for research on host-parasite interactions.Copyright © 2021 Elsevier Ltd. All rights reserved.
A simple model of bipartite cooperation for ecological and organizational networks
DOI:10.1038/nature07532 [本文引用: 1]
Ecological, historical and evolutionary determinants of modularity in weighted seed-dispersal networks
DOI:10.1111/ele.12245
PMID:24467289
[本文引用: 1]
Modularity is a recurrent and important property of bipartite ecological networks. Although well-resolved ecological networks describe interaction frequencies between species pairs, modularity of bipartite networks has been analysed only on the basis of binary presence-absence data. We employ a new algorithm to detect modularity in weighted bipartite networks in a global analysis of avian seed-dispersal networks. We define roles of species, such as connector values, for weighted and binary networks and associate them with avian species traits and phylogeny. The weighted, but not binary, analysis identified a positive relationship between climatic seasonality and modularity, whereas past climate stability and phylogenetic signal were only weakly related to modularity. Connector values were associated with foraging behaviour and were phylogenetically conserved. The weighted modularity analysis demonstrates the dominating impact of ecological factors on the structure of seed-dispersal networks, but also underscores the relevance of evolutionary history in shaping species roles in ecological communities. © 2014 John Wiley & Sons Ltd/CNRS.
Biological determinants of species diversity
DOI:10.2307/2845026 URL [本文引用: 1]
Perspectives on plant-pollinator interactions from the evolution of cooperation
DOI:10.3724/SP.J.1003.201214027 URL [本文引用: 1]
从合作的进化探讨植物与传粉者的相互作用
DOI:10.3724/SP.J.1003.201214027
[本文引用: 1]
合作的进化为研究植物–传粉者相互关系提供了新的视角。植物与传粉者通过“报酬换服务”建立种间合作关系。这一合作关系从建立、维持到解体面临着3个关键问题: (1)在植物和传粉者不了解对方质量信息时, 双方如何选择出最适伙伴, 进而建立合作关系; (2)合作方如何限制欺骗策略(比如, 盗蜜和欺骗性传粉)的扩散以维持合作关系; (3)什么过程可导致传粉合作关系的解体。植物与传粉者间信号博弈或筛选博弈可促进二者合作关系的建立。面对欺骗策略, 传粉者和植物分别采用伙伴选择机制和防御机制加以应对。合作者与欺骗者的稳定共存也有助于植物–传粉者合作的维持。从合作转向对抗、转向新的伙伴和合作放弃3个过程可导致植物–传粉者的合作关系的解体。植物与传粉者合作关系的理论预期已经得到了部分实验结果支持, 深化了我们对植物与传粉者合作过程中关键机制的理解。在今后的研究中, 需要进一步探讨以下问题: (1)传粉者对植物信号诚实性的选择作用和植物对传粉者的筛选作用; (2)植物与传粉者各自应对欺骗策略的可能机制及其相对重要性; (3)合作者与欺骗者稳定共存的机制; (4)植物与传粉者合作系统对全球变化的响应。
Dispersal governs the reorganization of ecological networks under environmental change
Global change and species interactions in terrestrial ecosystems
DOI:10.1111/j.1461-0248.2008.01250.x
PMID:19062363
[本文引用: 1]
The main drivers of global environmental change (CO2 enrichment, nitrogen deposition, climate, biotic invasions and land use) cause extinctions and alter species distributions, and recent evidence shows that they exert pervasive impacts on various antagonistic and mutualistic interactions among species. In this review, we synthesize data from 688 published studies to show that these drivers often alter competitive interactions among plants and animals, exert multitrophic effects on the decomposer food web, increase intensity of pathogen infection, weaken mutualisms involving plants, and enhance herbivory while having variable effects on predation. A recurrent finding is that there is substantial variability among studies in both the magnitude and direction of effects of any given GEC driver on any given type of biotic interaction. Further, we show that higher order effects among multiple drivers acting simultaneously create challenges in predicting future responses to global environmental change, and that extrapolating these complex impacts across entire networks of species interactions yields unanticipated effects on ecosystems. Finally, we conclude that in order to reliably predict the effects of GEC on community and ecosystem processes, the greatest single challenge will be to determine how biotic and abiotic context alters the direction and magnitude of GEC effects on biotic interactions.
Ecological networks across environmental gradients
DOI:10.1146/ecolsys.2017.48.issue-1 URL [本文引用: 1]
Disentangling community patterns of nestedness and species co-occurrence
DOI:10.1111/j.2007.0030-1299.16173.x URL [本文引用: 1]
Spatial variation in ant-tree bipartite networks is driven by a bottom-up process
DOI:10.1111/een.v47.6 URL [本文引用: 1]
Spatial variation in ant-tree network organization in the Xishuangbanna National Nature Reserve
DOI:10.17520/biods.2020019
[本文引用: 1]
Network analysis helps reveal the details of community organization by holistically assessing species diversity and the relationships contained therein. In this study, we collected arboreal ants from their host trees at three sites (Nabanhe, Menglun, and Bubeng) in the Xishuangbanna National Nature Reserve. Following computation of species diversity, network metrics, and community metrics, we compared the ant-tree bipartite networks between the three sample sites. Network metrics were evaluated using Z values standardized according to two different null models. Tree species composition differed across the three experimental sites, and the ant communities were correspondingly diverse. Ant and tree species number and the tree heterogeneity index (Shannon-Wiener diversity index, Simpson diversity index) were highest in Menglun, and lowest in Bubeng. Extinction slopes showed the same trends as the indices for ant and tree species number and tree heterogeneity, but did not display the same pattern as ant species heterogeneity. Evaluated parameters included: weighted nestedness metrics (WNODF), links per species, specialization, modularity, connectance, extinction slope exponent, and niche overlap. The absolute Z values of these parameters were highest in Menglun and lowest in Bubeng. In conclusion, tree species number and heterogeneity determine the ant-tree network stability, which is measured by extinction slope. WNODF and links per species are positively correlated with community stability. In specialized and modular networks, species populating higher trophic levels experience extinction events in direct correlation with those in lower trophic levels.
西双版纳国家级自然保护区蚂蚁-树互作网络空间变异
DOI:10.17520/biods.2020019
[本文引用: 1]
网络分析(network analysis)可以同时分析群落中的物种多样性和种间关系, 为了解生态群落的稳定性机制提供了新的分析思路和方法。本研究从西双版纳国家级自然保护区的纳板河、勐仑和勐腊(补蚌)三个地点采集了树栖性蚂蚁及树木的种类和数量数据, 对蚂蚁-树组成的二分网络进行了分析, 探讨了3个采样点物种的多样性、网络指标以及群落指标之间的关系。我们采用零模型的方法比较了3个样点的标准化网络参数差异。结果表明: 蚂蚁和树木的物种数以及树的异质性指数(Shannon-Wiener多样性指数、Simpson多样性指数)都呈现出勐仑 > 纳板河 > 补蚌的趋势。树木-蚂蚁的灭绝曲线系数大小关系同样为勐仑 > 纳板河 > 补蚌, 灭绝曲线与树的物种数及异质性指数大小趋势一致, 而与蚂蚁的异质性指数并不吻合。根据Z值的绝对值来看, 网络参数(加权嵌套性、平均连接数、特化水平、模块性、连接度)与群落参数(灭绝曲线系数、生态位重叠)的大小趋势相同, 表现出勐仑 > 纳板河 > 补蚌的趋势。综上所述, 蚂蚁-树互作网络的稳定性(灭绝曲线系数)主要由树的数量和异质性指数决定。网络的加权嵌套性和网络中节点的平均连接数也能促进群落的稳定性。而在一个特化的(数值越大表示专性互作越多)和模块化(具有较多密切互作的节点单元)的网络中, 当低营养级物种灭绝时高营养级物种数量将迅速减少。
Anthropogenic induced beta diversity in plant-pollinator networks: Dissimilarity, turnover, and predictive power
DOI:10.3389/fevo.2022.806615
URL
[本文引用: 2]
Biogeography has traditionally focused on the distribution of species, while community ecology has sought to explain the patterns of community composition. Species interactions networks have rarely been subjected to such analyses, as modeling tools have only recently been developed for interaction networks. Here, we examine beta diversity of ecological networks using pollination networks sampled along an urbanization and agricultural intensification gradient in east Leinster, Ireland. We show, for the first time, that anthropogenic gradients structure interaction networks, and exert greater structuring force than geographical proximity. We further showed that species turnover, especially of plants, is the major driver of interaction turnover, and that this contribution increased with anthropogenic induced environmental dissimilarity, but not spatial distance. Finally, to explore the extent to which it is possible to predict each of the components of interaction turnover, we compared the predictive performance of models that included site characteristics and interaction properties to models that contained species level effects. We show that if we are to accurately predict interaction turnover, data are required on the species-specific responses to environmental gradients. This study highlights the importance of anthropogenic disturbances when considering the biogeography of interaction networks, especially in human dominated landscapes where geographical effects can be secondary sources of variation. Yet, to build a predictive science of the biogeography of interaction networks, further species-specific responses need to be incorporated into interaction distribution modeling approaches.
Complex interactions in metacommunities, with implications for biodiversity and higher levels of selection
DOI:10.2307/1941449 URL [本文引用: 1]
