


建立自然保护地是减缓生物多样性丧失的一项全球性战略(D’Amen et al, 2011), 目前全球设立的自然保护地已覆盖15.5%左右的陆地面积和7.5%左右的海洋面积(IUCN, 2021)。然而自然保护地的保护成效尚存在争议, 研究表明全球有1/3的自然保护地承受着巨大的人类活动压力(Jones et al, 2018)。自然保护区作为自然保护地的重要类型之一, 也存在保护成效未达预期的问题: 秦岭地区26%的自然保护区减缓水源涵养服务降低的作用不如保护区外(曹明等, 2021), 青藏高原地区草原类型自然保护区的净初级生产力(net primary production, NPP)保护成效较差(张镱锂等, 2015), 2013-2017年, 全国86.72%的自然保护区人类活动压力呈上升趋势(张涵等, 2021)等。因此自然保护区保护成效的定量评估对于准确认识保护现状具有重要意义, 同时也成为充分发挥保护区潜力的迫切需求。
保护成效评估存在诸多不确定性, 传统评估多基于保护区内外指标的直接对比(Liu & Commes, 2016; Jiang & Yu, 2019), 未考虑保护区内外土壤、植被及地形等环境差异, 因此难以区分相关指标的变化是保护区建立后取得的保护成效, 还是其内外环境差异所引起的(王伟等, 2016)。为解决这一问题, 有学者将倾向得分匹配法(propensity score matching, PSM)引入到保护成效评估中, 该方法通过选择特定的协变量, 在保护区外去匹配与区内环境类似的对照组, 可显著减少实验组与对照组的标准偏差, 提高评估精度(Geldmann et al, 2019)。保护成效评估的不确定性还体现在泄漏和溢出效应方面(Ford et al, 2020; Li et al, 2022): 当气候变化和人类活动等原因导致保护区周边的保护效果远低于更远区域时, 便产生了泄漏效应, 该效应会加速景观破碎化, 破坏甚至抵消保护成效(宋瑞玲等, 2018); 反之, 当保护区周边的保护效果远高于更远区域时, 便产生了溢出效应(陈冰等, 2017; Feng et al, 2021)。《生物多样性公约》第8条强调应促进保护区周边环境的无害化和可持续发展(CBD, 1992), “爱知目标”第11条也提出应将保护区及其周边区域视为一个整体进行综合保护(CBD, 2010)。因此, 在保护成效评估过程中应充分考虑保护区内外环境差异及溢出/泄漏效应。保护成效和溢出/泄漏效应往往受自然和社会经济等因素的影响(Barros et al, 2022), 识别其影响因素对于保护政策的调整以及保护成效的提高具有重要意义。
河南伏牛山处于中国北亚热带向暖温带过渡的地区, 同时也是秦岭山地与黄淮海平原的过渡地带(张晓东等, 2018; 张静静等, 2020), 是我国生物物种东西向扩散与交汇的天然廊道。因此, 河南伏牛山地区自然保护区群的保护成效评估对于维持和提高区域生物多样性以及生态系统稳定性具有重要意义。然而, 在伏牛山地区的保护区保护成效评估中, 同时考虑保护区内外环境差异与周边区域溢出/泄漏效应的研究相对不足。因此, 本文采用倾向得分匹配法消除保护区内外的环境差异, 然后选取NPP和人类扰动指数对区域内的伏牛山国家级自然保护区、宝天曼国家级自然保护区和南阳恐龙蛋化石群国家级自然保护区(以下分别简称为伏牛山保护区、宝天曼保护区和南阳保护区) 2000- 2020年的保护成效及其溢出/泄漏效应进行评估, 探讨其影响因素, 并基于评估结果提出针对性建议, 以期提升研究区内保护区的保护成效。
1 材料与方法
1.1 研究区域概况
伏牛山位于河南省西部, 是秦岭山系的重要余脉, 呈西北-东南走向, 西至河南与陕西省界, 东至方城北部, 北与熊耳山、外方山相接, 南至南阳盆地, 包括8个完整的县域单元, 总面积约20,000 km2 (图1)。复杂的气候和地貌条件形成了从暖温带落叶阔叶林向北亚热带常绿落叶混交林过渡的多样化植被类型, 土壤以棕壤、黄棕壤和褐土为主(张晓东等, 2018)。目前区域内建有3处国家级自然保护区, 分别为伏牛山保护区、宝天曼保护区和南阳保护区。其中伏牛山和宝天曼保护区为森林生态系统类型保护区, 前者的主要保护对象为过渡带森林生态系统, 后者主要保护过渡带森林生态系统和珍稀动植物; 南阳保护区为古生物遗迹类型保护区, 主要保护对象为恐龙蛋化石。
图1
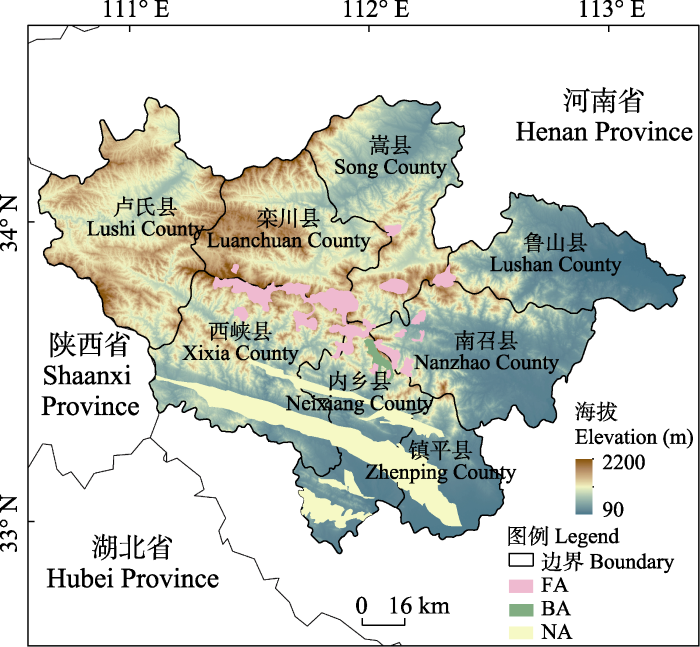
图1
河南伏牛山地区概况。FA: 伏牛山国家级自然保护区; BA: 宝天曼国家级自然保护区; NA: 南阳恐龙蛋化石群国家级自然保护区。
Fig. 1
Overview of Funiu Mountain area in Henan Province. FA, Funiu Mountain National Nature Reserve (NNR); BA, Baotianman NNR; NA, Nanyang Dinosaur Eggs Fossil Cluster NNR.
1.2 数据来源及预处理
自然保护区数据: 自然保护区矢量数据来自于中国科学院资源环境科学与数据中心的全国自然保护区边界数据集(
保护成效及溢出/泄漏效应评估数据: (1) NPP数据来自于MODIS的MOD17A3HGF产品(
协变量及保护成效与溢出/泄漏效应影响因素数据: (1)地形数据。采用ASTER GDEM数据(
1.3 研究方法
1.3.1 研究指标计算
(1) NPP变化率。运用趋势分析法(邓晨晖等, 2018)模拟每个栅格NPP的年际变化率, 计算公式如下:
式中, Slope为单个栅格回归方程的斜率, 代表NPP的变化趋势; n表示年份; Ci表示第i年的NPP值。对变化趋势进行F检验, 将NPP变化趋势分为3个等级: 退化(Slope < 0, P < 0.05); 改善(Slope > 0, P < 0.05); 稳定(P > 0.05)。
(2)人类扰动指数。首先, 在赵国松等(2014)的基础上, 结合研究区实际状况对伏牛山生态系统划分扰动分级指数: 湿地为0, 林地、草地、水体为1, 耕地为2, 人造地表为3。其次, 在ArcGIS中构建1 km × 1 km的规则网格, 计算每个网格的人类扰动指数。计算方法如下:
式中, Ai表示第i级生态系统的扰动分级指数, Pi表示第i级生态系统的面积所占百分比, D表示人类扰动指数。D取值在0-1, 值越大表示该区域人类扰动程度越大。
最后, 计算网格尺度人类扰动指数的变化比例, 计算公式如下:
式中, i、j分别表示第i年和第j年, Di、Dj分别表示i、j年时的人类扰动指数, 10表示以10年为间隔计算, R(i, j)表示i到j时段人类扰动指数的变化程度。根据变化程度的大小将其划分为明显下降(小于-5%)、较明显下降(-5%至-1%)、轻微下降(-1%至-0.1%)、基本持衡(-0.1%至0.1%)、轻微上升(0.1%至1%)、较明显上升(1%至5%)以及明显上升(大于5%) 7类。
1.3.2 保护成效与溢出/泄漏效应评估
将研究区域划分成1 km × 1 km的网格, 使用ArcGIS提取环境变量以及评估指标的值, 并删除无效值。使用R 4.0.5中的MatchIt程序包对各区域的网格进行匹配, 匹配方法采用最邻近法, 匹配比例为1:1, 卡嵌值为0.02, 筛选出环境变量相似的最佳样本对。对比保护区(外围缓冲区域)与对照区域的指标差异可评估保护区的保护成效(溢出/泄漏效应), 该差异称为平均处理效应(average treatment effects, ATT), 并通过t检验分析差异的显著性(宋瑞玲等, 2018)。
1.3.3 保护成效与溢出/泄漏效应影响因素
首先对保护成效与溢出/泄漏效应结果进行分类, 分别为: 成效好、成效不明显、成效差; 溢出、无溢出/无泄漏、泄漏。然后通过单因素方差分析对比各分类下影响因素的差异。NPP影响因素选择NPP本底值、气温和降水量3个指标, 人类扰动影响因素选择人口和GDP两个指标。
2 结果
2.1 伏牛山地区NPP年际变化
2000-2010年伏牛山NPP以改善区域为主(81%), 其次是稳定区域(17.44%), 退化区域极少(1.65%), NPP变化率均值为12.51 gC•m-2•yr-1 (图2)。在此期间, 伏牛山、宝天曼和南阳自然保护区的NPP变化率均值分别为13.55 gC•m-2•yr-1、13.49 gC•m-2•yr-1以及13.83 gC•m-2•yr-1, 略高于区域均值。2011-2020年NPP以稳定区域为主(79.21%), 其次是改善区域(19.36%), 退化区域极少(1.43%), NPP变化率均值为9.04 gC•m-2•yr-1。在此期间, 伏牛山和宝天曼保护区的NPP变化率均值分别为7.85 gC•m-2•yr-1和6.57 gC•m-2•yr-1, 均低于区域均值; 南阳保护区的NPP变化率均值为9.49 gC•m-2•yr-1, 略高于区域均值。由此可见, 不同时段伏牛山地区NPP变化趋势存在较大差异, 由2000-2010年的增长状态转变为2011-2020年的稳定状态。
图2
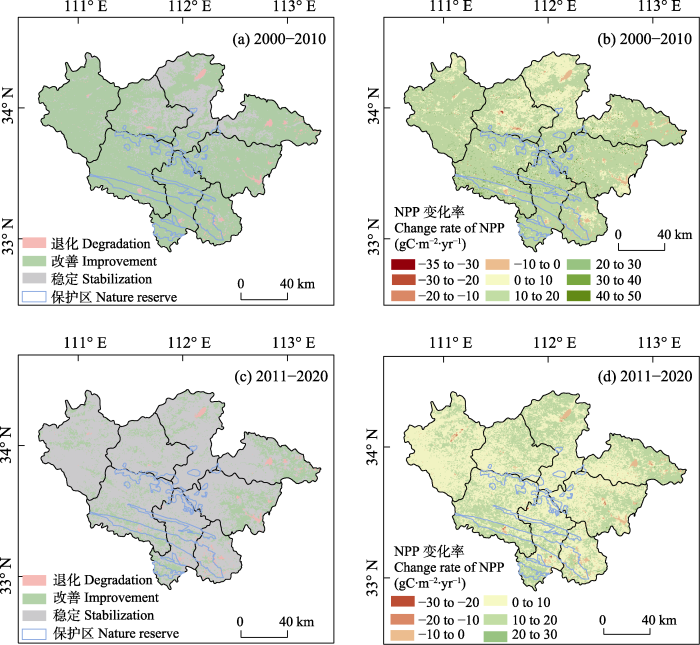
图2
伏牛山地区NPP变化趋势空间分布。伏牛山地区2000-2010年NPP变化类别(a)与变化率(b); 2011-2020年NPP变化类别(c)与变化率(d)。
Fig. 2
Spatial distribution of NPP variation trend in Funiu Mountain area. The change categories (a) and change rate (b) of NPP in the Funiu Mountain area from 2000 to 2010; the change categories (c) and change rate (d) of NPP from 2011 to 2020.
2.2 NPP保护成效及溢出/泄漏效应
倾向得分匹配均衡性检验结果显示: 保护区内外环境变量的标准化偏差在匹配前差异悬殊, 匹配后大幅降低(附录2)。对数据进行倾向得分匹配后, 删除环境条件差异较大的样本, 筛选出环境条件最接近的样本进行后续分析。2000-2010年, 区域尺度上保护区NPP增长率显著高于非保护区域(外围缓冲区域和对照区域), 在保护区尺度上(图3a), 伏牛山和南阳保护区的NPP增长率显著高于对照区域(ATT > 0, P < 0.01), 宝天曼保护区的NPP增长率则与对照区域无显著差异(P > 0.05), 外围缓冲区域与3处保护区的差异均不明显(P > 0.05)。2011-2020年, 区域尺度上保护区NPP增长率显著低于对照区域, 但与外围缓冲区域差异不大。对单个保护区而言, 伏牛山(ATT < 0, P < 0.05)和宝天曼保护区(ATT < 0, P < 0.01)的NPP增长率显著低于对照区域, 南阳保护区的NPP增长率与对照区域接近(P > 0.05), 3处保护区与外围缓冲区域的差异均不明显(P > 0.05)。因此, 伏牛山地区保护区群的NPP保护成效存在阶段性差异, 2000-2010年间保护区的存在明显提升了NPP的增长率, 起到了良好的保护成效, 但2011-2020年间保护成效较差。NPP的溢出/泄漏效应也存在阶段性差异: 外围缓冲区域的NPP增长率在2000-2010年总体高于对照区域, 出现溢出效应, 其中伏牛山保护区出现泄漏效应(ATT < 0, P < 0.01), 南阳保护区出现溢出效应(ATT > 0, P < 0.01); 2011-2020年NPP总体出现泄漏效应, 保护区尺度上表现为伏牛山和宝天曼保护区的泄漏(ATT < 0, P < 0.01) (图3a)。
图3
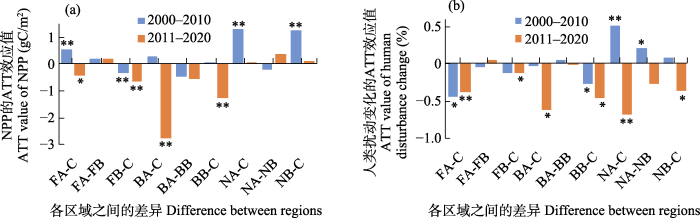
图3
NPP (a)与抵御人类扰动(b)保护成效与溢出/泄漏效应评估。FA: 伏牛山国家级自然保护区; FB: 伏牛山国家级自然保护区的外围缓冲区域; BA: 宝天曼国家级自然保护区; BB: 宝天曼国家级自然保护区的外围缓冲区域; NA: 南阳恐龙蛋化石群国家级自然保护区; NB: 南阳恐龙蛋化石群国家级自然保护区的外围缓冲区域; C: 对照区域; ATT: 平均处理效应。** P < 0.01, * P < 0.05。
Fig. 3
Assessment of protection effectiveness and spillover/leakage effects for NPP (a) and human disturbance resistance (b). FA, Funiu Mountain NNR; FB, Peripheral buffer of Funiu Mountain National Nature Reserve (NNR); BA, Baotianman NNR; BB, Peripheral buffer of Baotianman NNR; NA, Nanyang Dinosaur Eggs Fossil Cluster NNR; NB, Peripheral buffer of Nanyang Dinosaur Eggs Fossil Cluster NNR; C, Control zone; ATT, Average treatment effects. ** P < 0.01, * P < 0.05.
单因素方差分析结果显示, NPP本底值、气温和降水显著影响着保护区的NPP保护成效与溢出/泄漏效应(图4a, b)。NPP本底值在保护成效好与溢出效应发生时最低(分别为480.9 gC/m2和490.1 gC/m2),其次是成效不明显与无溢出/无泄漏时(分别为499.8 gC/m2和525.6 gC/m2), 在保护成效差与泄漏效应发生时最高(分别为546.1 gC/m2和539.9 gC/m2); 气温和降水在保护成效好与溢出效应发生时显著高于保护成效差与泄漏效应发生时(P < 0.01)。
图4
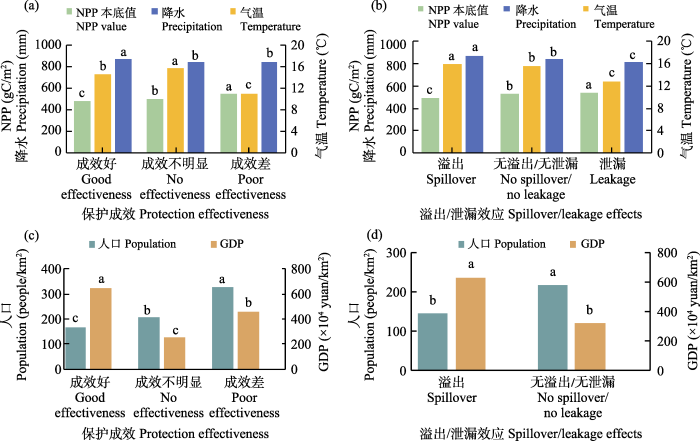
图4
NPP与抵御人类扰动保护成效与溢出/泄漏效应影响因素。NPP保护成效(a)与溢出/泄漏效应(b)影响因素, 抵御人类扰动保护成效(c)与溢出/泄漏效应(d)影响因素。图中不同的小写字母表示在P < 0.01水平上差异显著, 相同字母则表示无显著性差异。
Fig. 4
Influencing factors of protection effectiveness and spillover/leakage effects for NPP and human disturbance resistance. Influencing factors of protection effectiveness (a) and spillover/leakage effects (b) for NPP, influencing factors of protection effectiveness (c) and spillover/leakage effects (d) for human disturbance resistance. Different lowercase letters indicate significant differences at the P < 0.01 level, while the same letter indicates no significant difference.
2.3 伏牛山地区人类扰动变化空间格局
2000-2010年和2011-2020年伏牛山人类扰动均以基本持衡为主, 面积占比分别为54.41%和57.53% (图5)。2000-2010年人类扰动程度上升面积(27.85%)大于下降面积(17.74%), 人类扰动上升地区在伏牛山全域均有分布, 其中嵩县北部、鲁山县东部及南阳保护区上升最为明显。2011-2020年人类扰动程度上升面积(26.06%)大于下降面积(16.41%), 人类扰动上升地区集中在南召县、鲁山县和南阳保护区。因此, 2000-2020年伏牛山人类扰动程度变化面积为持衡 > 上升 > 下降。
图5
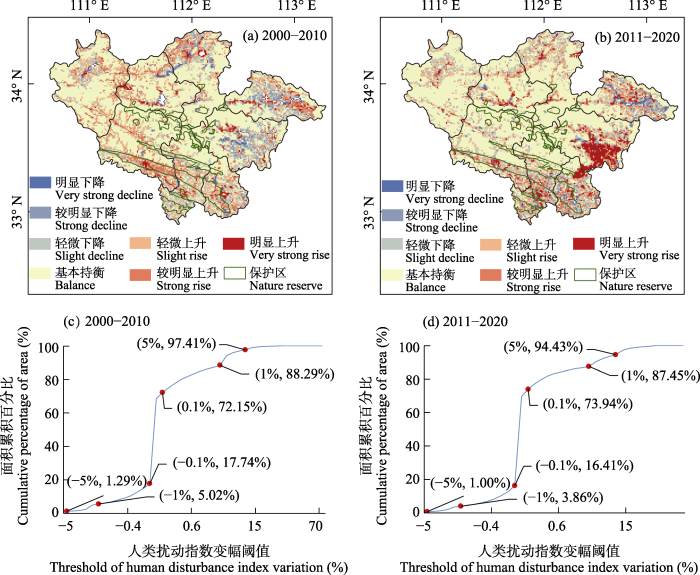
图5
伏牛山地区人类扰动指数变化的空间与数值分布
Fig. 5
Spatial and numerical distribution of human disturbance index variations in Funiu Mountain area
2.4 抵御人类扰动成效及溢出/泄漏效应
倾向得分匹配均衡性检验结果表明, 匹配后保护区内外环境因素的标准化偏差大幅降低(附录3)。2000-2010年, 区域尺度上保护区的人类扰动增幅显著高于非保护区域, 但不同保护区存在差异(图3b): 伏牛山保护区的人类扰动增幅显著低于对照区域(ATT < 0, P < 0.05), 但与外围缓冲区域差异不大(P > 0.05), 南阳保护区增幅显著高于非保护区域(对照区域: ATT > 0, P < 0.01, 外围缓冲区域: ATT > 0, P < 0.05), 宝天曼保护区则与非保护区域无显著差异(P > 0.05)。2011-2020年, 无论是区域尺度或是保护区尺度, 3处保护区的人类扰动增幅均显著低于对照区域(ATT < 0), 但与外围缓冲区域的差异不显著(P > 0.05)。因此, 2011-2020年保护区在抵御人类扰动方面的成效优于2000-2010年。对于溢出/泄漏效应而言, 2000-2010年区域尺度上外围缓冲区域的人类扰动增幅与对照区域差异不大, 仅宝天曼保护区出现溢出效应(ATT < 0, P < 0.05); 2011- 2020年3处保护区均出现溢出效应(ATT < 0, P < 0.05), 并导致了区域尺度上的溢出。因此, 保护区在抵御人类扰动方面以溢出效应为主, 未出现泄漏效应, 且2011-2020年的溢出效应较2000-2010年更为明显。
在影响因素方面(图4c, d), 保护成效好与溢出效应发生时的人口密度显著低于成效差与无溢出/无泄漏效应时(P < 0.01), GDP情况则相反, 在保护成效好与溢出效应发生时最高(P < 0.01)。因此, 保护区抵御人类扰动成效较好的情景或溢出效应往往发生在人口稀疏和经济发展水平较高的情况下。
3 讨论
3.1 倾向得分匹配法的作用
保护区内外对比法在以往的保护成效评估中被广泛应用(Liu & Commes, 2016; Jiang & Yu, 2019), 但保护区的选址需考虑物种栖息地、景观美学价值和人类影响等诸多因素(Sutherland et al, 2009), 这导致了其内外环境差异。在本研究中, 与非保护区域相比, 伏牛山与宝天曼保护区位于海拔较高、坡度较大、人口较少以及离道路较远的地区(附录2, 附录3), 该差异会导致相当一部分被描述为保护成效的贡献可能来自于保护区的选址, 而非保护政策本身(Li et al, 2022)。南阳保护区的选址主要取决于恐龙蛋化石的空间分布, 虽不能为NPP和抵御人类扰动保护成效做出贡献, 但也造成了与保护区外的环境差异。
忽视保护地内外的环境差异往往导致保护成效被高估: 如苏门答腊岛的保护地减少了27%的森林砍伐, 但使用倾向得分匹配后该值下降至7.4% (Gaveau et al, 2009); Feng等(2021)评估了全球范围内保护地的保护成效, 发现倾向得分匹配的结果比保护地-外围缓冲区域对比法的结果更保守。本文使用不匹配的方法重新计算了保护区的保护成效, 结果表明: 与倾向得分匹配法的评估结果相比, 不匹配时83%情景下NPP的平均处理效应值偏高, 67%情景下人类扰动平均处理效应值偏低, 即保护成效被高估, 这与以往研究结果一致(Gaveau et al, 2009; Feng et al, 2021)。为得到更加真实的评估结果, 使用倾向得分匹配法消除环境变量干扰十分必要。
3.2 保护成效与溢出/泄漏效应评估
越来越多的学者意识到溢出/泄漏效应在保护成效评估中的重要性, 但与之相关的定量化研究仍相对缺乏(Ford et al, 2020; Li et al, 2022)。本文对伏牛山地区保护区群溢出/泄漏效应的初步探索表明: 外围缓冲区域在42%的情景下发生NPP或抵御人类扰动的溢出效应; 在25%的情景下发生泄漏效应; 其余33%的情景下未发生溢出或泄漏效应(图3)。虽然溢出/泄漏效应与保护区的保护成效无直接对应关系(Ewers & Rodrigues, 2008; 陈冰等, 2017), 但分别会对其产生正向和负向影响。尤其是泄漏效应会导致保护区与周围生态系统的隔离, 限制物质流和基因流, 破坏栖息地的完整性(Fuller et al, 2020), 还会削弱保护区的净保护成效, 如Ford等(2020)的研究表明, 泄漏效应发生时, 78.2%的保护地减少森林砍伐的成效被抵消。虽然保护地的建立并非为了保护其边界范围以外的生态系统, 但周边地区的环境质量对于保护目标的实现至关重要(Ford et al, 2020)。因此, 不仅需要保护地在生态、经济和政治上可持续发展(Cumming & Allen, 2017), 还应确保其保护成效不会被泄漏效应所抵消。鉴于此, 我们建议今后的保护成效评估工作应当在一个同时包含保护区域与外围缓冲区域的更大范围内进行。
3.3 保护成效与溢出/泄漏效应的影响因素
保护区NPP保护成效及溢出/泄漏效应与NPP本底值、气温和降水密切相关(图4a, b)。NPP本底值高时保护成效反而较差且往往发生泄漏效应, 这与植被饱和效应所导致的低增长率有关(Gu et al, 2013); 当气温和降水量较高时, 可增强光合作用与CO2吸收, 促进植被生长(高振翔等, 2022), 有利于NPP保护成效的提高与溢出效应的出现。保护区抵御人类扰动的成效及溢出/泄漏效应主要受到人口和GDP限制(图4c, d)。人口密度低的保护区耕地和人造地表等人为扰动程度高的土地利用形式较少, 保护成效往往较高并易于发生溢出效应; 而高GDP的地区一方面意味着经济活动较强, 另一方面有利于保护资金的投入, 且居民的生态保护意识往往较强, GDP对人类扰动的总体影响取决于两者之间的博弈。
3.4 评估指标的选择
根据保护对象建立指标体系可实现保护区保护成效的系统评估, 然而由于长期观测数据的缺乏, 许多学者使用单个或少数指标实现保护成效的快速评估(邓舒雨等, 2018; 祝萍等, 2018)。空间尺度也是指标选取的重要依据, 在单个保护区尺度上, 学者们更多关注保护目标的实现情况(刘方正等, 2016; 邓舒雨等, 2018); 而在保护区系统尺度上(包括区域、国家和全球尺度), 为便于统一评估, 往往选取适用性较广的指标(祝萍等, 2018; 邱成等, 2020)。NPP和人类扰动指数在保护区系统尺度上的保护成效评估中应用广泛(张镱锂等, 2015; 刘晓曼等, 2020; 张涵等, 2021), NPP是反映生态系统功能状况的重要指标(Crabtree et al, 2009), 减少人类扰动是保护区建立的目的之一(张涵等, 2021), 保护区的建立是否达到提高NPP与减少人类扰动的目的是评价保护工作成功与否的重要依据。在后续研究中, 应结合保护区的保护对象、功能、主要威胁等因素, 从生物多样性、生态系统服务及人类活动等方面建立指标体系(郑姚闽等, 2012; 王伟等, 2016), 对研究区保护区群的保护成效进行系统全面的评估。
3.5 基于评估结果的保护对策
基于保护成效与溢出/泄漏效应评估的结果, 对伏牛山地区国家级自然保护区群保护方案的优化提出相应建议。(1)应提高NPP保护水平。近10年(2011-2020年), 3处保护区抵御人类扰动的成效较好, 但NPP的保护成效较差。对此, 一方面应通过封山育林等措施进一步提高森林质量; 另一方面为增强过渡带植被应对气候变化的抵抗力, 需进一步增加投资与保护力度, 防范高温干旱等气象灾害对森林造成的负面影响。(2)应增强对外围缓冲区域的保护力度。泄漏效应在本研究区较为普遍, 未来应将保护区与外围缓冲区域作为一个整体进行综合保护, 以避免保护成效被泄漏效应削弱甚至抵消。(3)应加强对NPP和人类扰动的动态监测与评估。本研究发现NPP和抵御人类扰动的保护成效存在阶段性变化, 因此应加强对相关评估指标的长期动态监测, 以提高评估的准确性与科学性。
3.6 不足与展望
省级及以下级别的保护区往往存在覆盖面积小、边界范围不明确且不易获取以及与国家级保护区重叠等问题, 因此本文仅考虑了国家级自然保护区, 评估结果可能存在一定误差。此外, 起始时保护区内外所面临的压力不尽相同, 也会增加评估结果的不确定性, 本文参考相关研究(张镱锂等, 2015; 冷仙等, 2022; Zhang et al, 2022), 对比了保护区内外相关指标的变化率, 可降低初始背景差异对评估结果的干扰。由于自然遗迹类型保护区评估指标不易量化, 在区域尺度上, 不少学者选择适用范围较广的评估指标将自然遗迹类型与其他类型的保护区进行统一评估(Wei et al, 2015; 曹明等, 2021; Zhang et al, 2022)。因此可使用NPP对南阳保护区的保护成效进行间接评估, 但由于保护区类型差异, 不能将评估结果与其他保护区进行横向比较, 未来我们将探讨古生物遗迹类型保护区定量评估及权重确定方案, 对南阳保护区的化石保护成效进行评估。
附录 Supplementary Material
附录1 外围缓冲区域的构建与倾向得分匹配法的匹配网格
Appendix 1 The construction of the peripheral buffer and the matching grid of propensity score matching
附录2 净初级生产力(NPP)的倾向得分匹配均衡性检验结果
Appendix 2 Balance test results of propensity score matching for net primary productivity (NPP)
附录3 人类扰动的倾向得分匹配均衡性检验
Appendix 3 Balance test results of propensity score matching for human disturbance
参考文献
No evidence of local deforestation leakage from protected areas establishment in Brazil’s Amazon and Atlantic Forest
DOI:10.1016/j.biocon.2022.109695 URL [本文引用: 1]
Assessing the effectiveness of water retention ecosystem service in Qinling National Nature Reserve based on InVEST and propensity score matching model
DOI:10.17520/biods.2020271 URL [本文引用: 3]
基于InVEST与倾向评分匹配模型评估秦岭国家级自然保护区水源涵养服务保护成效
Assessment of forest conservation in the Cangshan Nature Reserve based on propensity score matching
DOI:10.17520/biods.2017086
[本文引用: 3]

The establishment of protected areas is one of the most common measures of biodiversity conservation. Regular assessment can help improve management and promote conservation in protected areas. According to administrative divisions, we divided the Cangshan Nature Reserve into three parts: Dali City, Eryuan County and Yangbi County, as sub-study areas. The evaluation was based on propensity score matching and paired-samples t-test. Elevation, slope, distance to the nearest settlement, and distance to the nearest road were four chosen covariates. Since the Cangshan Nature Reserve was upgraded to the national level in 1994, we compared forest changes between 1995 and 2015. Partial correlation analysis was carried out between each covariate and forest change to analyze the impact factors. Results indicated that in Dali City, the forest change value inside the Cangshan Nature Reserve was significantly higher than that found outside. Forest coverage inside the Cangshan Nature Reserve in Dali City was the highest among all regions. The forest change rates both inside and outside the Cangshan Nature Reserve in Eryuan County were higher than the other two counties. There was no significant difference in forest change value between areas inside and outside of the nature reserve in Eryuan County. In Yangbi County, the forest change rates both inside and outside of Cangshan Nature Reserve were the lowest among three counties, but the forest change value found within 10 km outside of the nature reserve was significantly higher than that found in areas beyond 10 km, which indicates that the existence of the Cangshan Nature Reserve performed positive neighborhood leakage in surrounding areas within 10 km. The four covariates all affected forest change in different areas in a variety of ways. The propensity score matching and sub-regional methodology for the assessment of the Cangshan Nature Reserve provided a new technical method and example for other conservation assessment studies.
基于倾向评分配比法评估苍山自然保护区的森林保护成效
DOI:10.17520/biods.2017086
[本文引用: 3]
对自然保护区的定期评估有助于提升其管理和保护水平。本研究以苍山自然保护区所在的大理市、洱源县、漾濞县3个市/县作为子研究区域, 构建了基于倾向评分配比(propensity score matching)和配对t检验(paired-samples t-test)的保护成效评估技术方案。选取海拔、坡度、与最近居民点的距离、与最近道路的距离4个因子作为环境变量, 通过对每个县单独进行分析, 分别对比了自然保护区晋升国家级时(1995年)与20年后(2015年)其森林覆盖面积的变化, 以此来评估苍山自然保护区的森林保护成效, 并对各环境变量与森林覆盖变化值的关系进行了偏相关分析(partial correlation analysis)。结果表明: 大理市境内苍山自然保护区内的森林覆盖变化值显著高于保护区外部, 且该区段的森林覆盖率最高。洱源县境内苍山自然保护区内、外的森林覆盖变化率均高于其他2个市/县, 且保护区内、外森林覆盖变化值差异不显著。漾濞县境内苍山自然保护区内、外森林覆盖变化率最低, 但其保护区外0-10 km区域的森林覆盖变化值显著高于10 km以外区域, 保护区的存在对其周边0-10 km区域产生了正面的溢出效应 (neighborhood leakage)。海拔、坡度、与最近居民点的距离、与最近道路的距离4个协变量在3个市/县的不同研究区段内均与森林覆盖变化值呈现出了不同程度的相关性。本研究所采用的倾向评分配比法和按照行政区划对自然保护区分区进行评估的方法, 为自然保护区整体保护成效的评价提供了新的技术思路。
A modeling and spatio- temporal analysis framework for monitoring environmental change using NPP as an ecosystem indicator
DOI:10.1016/j.rse.2008.12.014 URL [本文引用: 2]
Protected areas as social-ecological systems: Perspectives from resilience and social-ecological systems theory
DOI:10.1002/eap.2017.27.issue-6 URL [本文引用: 1]
Will climate change reduce the efficacy of protected areas for amphibian conservation in Italy?
DOI:10.1016/j.biocon.2010.11.004 URL [本文引用: 1]
Spatial-temporal variation of the vegetation coverage in Qinling Mountains and its dual response to climate change and human activities
秦岭植被覆盖时空变化及其对气候变化与人类活动的双重响应
DOI:10.11849/zrzyxb.20170139
[本文引用: 1]
论文基于MODIS-NDVI数据、DEM及气象数据,辅以趋势分析、多元回归残差法、偏最小二乘回归法,反演了秦岭地区2000—2015年植被覆盖度及分析了其“格局—过程—趋势”的变化特征,探究了其对气候变化与人类活动的双重响应机制。结果表明:1)秦岭地区近16 a来植被覆盖度呈显著上升趋势,增速为2.77%/10 a,呈“中间高、周边低,西部高、东部低,南坡高、北坡低”的空间格局,植被覆盖度随海拔的升高在2 200 m左右达到最大,700~3 200 m达0.7以上,1 300~2 700 m达0.9以上,3 400 m以上为0.5以下的低值区;2)秦岭地区的植被覆盖与气候因子的响应关系存在明显的空间差异,对气温的响应总体上没有明显的时滞效应,而与降水的响应存在以滞后1个月为主的时滞效应;3)人类活动对秦岭地区植被变化的作用日趋增强,且以正向作用为主,主要分布在东部地区,而负向作用则分布于中部和西部地区;4)秦岭地区植被变化是气候变化和人类活动共同作用的结果,影响因子对植被覆盖变化的解释能力依次为人类活动>降水>气温>潜在蒸散量。
Evaluating the effectiveness of Shennongjia National Nature Reserve based on the dynamics of forest carbon pools
DOI:10.17520/biods.2017240
[本文引用: 2]
Nature reserves are a cornerstone of global conservation strategies. However, the effectiveness of the reserve in conserving ecosystem function such as carbon storage is poorly understood. The Shennongjia National Nature Reserve is a conservation icon and has taken exceptional efforts to protect forests. It provides a unique case to address this question. Here, we quantified the carbon storage from aboveground carbon, belowground carbon, litter, coarse woody debris, and soil organic carbon inside and outside the Shennongjia National Nature Reserve between 1990 and 2010, based on inventory data and digitized historical land cover maps. The result showed that the woodland covered 92.76% of the reserve, most of which was coniferous forest (51.85%), deciduous broad-leaved forest (35.11%), and evergreen broad-leaved forest (4.47%). Between 1990 and 2010, the area of the woodland has increased 0.11%, while the area of shrubland and cropland has declined 8.85% and 6.06%, respectively. The Shennongjia National Natural Reserve has accumulated 24.24 Tg carbon (22.57-26.62 Tg C) until 2010, of which 90.68% was contributed by soil organic carbon and aboveground carbon. A total of 95% of the carbon storage in Shennongjia National Nature Reserve are contributed by evergreen broad-leaved forest, deciduous broad-leaved forest and coniferous forest. Between 1990 and 2010, the aboveground carbon pool and soil organic carbon pool has increased 14.50 kt C (11.81-18.31 kt C) and 6.84 kt C, respectively. The carbon density inside the reserve is 22.37 t C/ha higher than that outside the reserve. Our results indicated that the Shennongjia National Nature Reserve is efficiently conserving forest carbon.
基于森林碳库动态评估神农架国家级自然保护区的保护成效
DOI:10.17520/biods.2017240
[本文引用: 2]
保护区是维持生物多样性和生态系统功能的最有效方式, 但其保护成效有待提升, 土地利用变化是重要影响因素之一。本研究以神农架国家级自然保护区为对象, 基于神农架地区近20年的调查研究和数据积累, 通过异速生长模型、生物量方程、抽样加权等方法, 对比分析了土地利用方式转变格局下神农架国家级自然保护区森林生态系统地上、地下、凋落物、粗木质残体、土壤有机碳5个碳库动态, 分析论证了20年间(1990-2010)神农架保护区对森林生态系统碳库的保护成效。研究发现, 林地占神农架保护区总面积的92.76%, 其中针叶林(51.85%)、落叶阔叶林(35.11%)及常绿阔叶林(4.47%)3种森林类型合计占林地面积的98.56%。20年间神农架保护区林地面积增加了0.11%, 灌木林地和耕地面积分别减少了8.85%和6.06%。神农架保护区2010年碳储量为24.24 Tg C (22.57-26.62 Tg C), 土壤有机碳和地上碳合计占全部碳储量的90.68%。常绿阔叶林、落叶阔叶林和针叶林3种森林类型碳储量占神农架保护区碳储量的95%。20年间神农架保护区5个碳库碳储量均有所增加, 共固碳25.04 kt C (21.83-29.57 kt C), 固碳率为1.21 kt C/年(1.09-1.48 kt C/年), 其中地上生物量碳库和土壤有机碳库分别增加14.50 kt C (11.81-18.31 kt C)和6.84 kt C。保护区内总碳库碳密度高于保护区外22.37 t C/ha。研究结果表明, 神农架国家级自然保护区在保护森林固碳能力方面取得了一定的成效。
Summary and prospect of spatialization method of human activity intensity: Taking the Qinghai-Tibet Plateau as an example
人类活动强度空间化方法综述与展望——以青藏高原为例
DOI:10.7522/j.issn.1000-0240.2021.0039
[本文引用: 1]
地球系统受到气候变化和人类活动的双重影响,相比于气候变化研究相关的空间数据在数据采集、制备方法、制备速度、时空分辨率和数据质量等各方面的快速发展和提高,人类活动强度空间数据还处于探索发展阶段。人类活动强度空间数据有助于更好的理解人类活动影响的强度和范围,对于探究人类活动对地球系统各圈层及其变化的影响,以及促进全球和区域可持续发展具有重要意义。基于此,通过对人类活动强度空间数据相关研究进行梳理和分析,首先提出人类活动强度空间化的概念,然后归纳总结六类主要的空间化方法,并以青藏高原地区为例重点展示和分析四类应用较为广泛的方法,包括净初级生产力人类占用法、土地类型变化法、全球干扰指数法和人类足迹指数法等。最后讨论目前人类活动强度空间化研究中存在的问题,并对未来的发展提出建议。
Estimates of reserve effectiveness are confounded by leakage
DOI:10.1016/j.tree.2007.11.008
PMID:18280005
[本文引用: 1]
In situ conservation often requires the designation of sites where land-use is restricted, such as protected areas and no-fishing zones. Such areas are designed to reduce human impacts on the ecosystem, but the overall benefits of this approach might be compromised if 'leakage' takes place--that is, if impacts that would take place inside the restricted area are displaced to a nearby, unrestricted area. Recently, Oliveira and colleagues became the first group to measure leakage from newly created forest concessions. They showed that restricting land-use reduced deforestation within the concession areas, but dramatically increased it in the surrounding areas. We discuss these findings in the wider context of growing global interest in quantifying the effectiveness of nature reserves.
Assessing the effectiveness of global protected areas based on the difference in differences model
DOI:10.1016/j.ecolind.2021.108078 URL [本文引用: 3]
Deforestation leakage undermines conservation value of tropical and subtropical forest protected areas
DOI:10.1111/geb.v29.11 URL [本文引用: 4]
Protected-area planning in the Brazilian Amazon should prioritize additionality and permanence, not leakage mitigation
DOI:10.1016/j.biocon.2020.108673 URL [本文引用: 1]
Response of vegetation gross primary productivity to climate change in China
中国植被总初级生产力对气候变化的响应
Evaluating whether protected areas reduce tropical deforestation in Sumatra
DOI:10.1111/jbi.2009.36.issue-11 URL [本文引用: 2]
A global-level assessment of the effectiveness of protected areas at resisting anthropogenic pressures
NDVI saturation adjustment: A new approach for improving cropland performance estimates in the Greater Platte River Basin, USA
DOI:10.1016/j.ecolind.2013.01.041 URL [本文引用: 1]
Analyzing land use intensity changes within and outside protected areas using ESA CCI-LC datasets
DOI:10.1016/j.gecco.2019.e00789 URL [本文引用: 2]
One-third of global protected land is under intense human pressure
DOI:10.1126/science.aap9565
PMID:29773750
[本文引用: 1]
In an era of massive biodiversity loss, the greatest conservation success story has been the growth of protected land globally. Protected areas are the primary defense against biodiversity loss, but extensive human activity within their boundaries can undermine this. Using the most comprehensive global map of human pressure, we show that 6 million square kilometers (32.8%) of protected land is under intense human pressure. For protected areas designated before the Convention on Biological Diversity was ratified in 1992, 55% have since experienced human pressure increases. These increases were lowest in large, strict protected areas, showing that they are potentially effective, at least in some nations. Transparent reporting on human pressure within protected areas is now critical, as are global targets aimed at efforts required to halt biodiversity loss.Copyright © 2018 The Authors, some rights reserved; exclusive licensee American Association for the Advancement of Science. No claim to original U.S. Government Works.
Analysis on habitat protection effectiveness of nature reserves based on landscape fragmentation in Southwest China
基于景观破碎化的西南自然保护区生境保护成效分析
Does leakage exist in China’s typical protected areas? Evidence from 13 national nature reserves
DOI:10.1007/s11356-021-16068-7 [本文引用: 3]
Vegetation growth and conservation efficacy assessment in the Southern Part of the Gansu Anxi National Nature Reserve in Hyper-Arid Desert
甘肃安西极旱荒漠国家级自然保护区南片植被长势与保护成效
Tropical nature reserves are losing their buffer zones, but leakage is not to blame
DOI:10.1016/j.envres.2015.11.008
PMID:26632993
[本文引用: 2]
Tropical forests provide important ecosystem services to humanity, yet are threatened by habitat loss resulting from deforestation and land-use change. Although reserves are considered the cornerstones of conservation efforts in the tropics, their efficacy remains equivocal. One question that remains unresolved is whether leakage - the unanticipated displacement of deforestation from inside reserves into the unrestricted zones just beyond a reserve's administrative boundary - is common around tropical forest reserves, or whether the zones are acting as buffers between the protected area and the outside world. To resolve this question, we used the Landsat-derived Global Forest Change dataset to estimate deforestation rates between 2000 and 2012 inside and outside of 60 nature reserves spread across the tropics. Deforestation rates inside reserves (within 5km of the administrative boundary) were generally lower than those immediately outside the reserves (i.e. in buffer zones 0-10km from the boundary), suggesting that reserves are effective at protecting forests. We hypothesised that leakage would result in greater deforestation rates in reserve buffer zones than in the broader reserve landscapes, but such a pattern was observed in only five African sites, suggesting that leakage does not often occur on the edge of established reserves. However, roughly 80% of reserves experienced deforestation rates that increased gradually from their interiors to the outer periphery of their buffer zones. Thus, while leakage may not be a pervasive phenomenon around tropical reserves worldwide, tropical reserves are often losing their buffer zones, resulting in increased isolation that could have ramifications for ecosystem services provisioning and tropical conservation strategies.Crown Copyright © 2015. Published by Elsevier Inc. All rights reserved.
Quantitative evaluation of human activity intensity on the regional ecological impact studies
区域生态效应研究中人类活动强度定量化评价
Characteristics of human activities and the spatio-temporal changes of national nature reserves in China
DOI:10.11821/dlyj020200458
[本文引用: 1]
Nature reserves are the core area for biodiversity conservation. National nature reserves are the main body of nature reserves in China. According to characteristic of each type of human activity, the patches of different human activities of 446 national nature reserves in 2015 and their change from 2013 to 2015 were interpreted with the aid of GIS and RS. Status of the distribution of human activities and their change are generally analyzed in different functional zones and different regions in China. Also according to different types of human activities, the intensity and characteristics of dynamic change of human activities are evaluated from 2013 to 2015. The results showed that in 2015, there were different kinds of human activities in 446 national nature reserves. Human activities were widely distributed, and agricultural land and residential areas were dominant. The area of the two types covered more than 88.94% of the total of human activities. And the number exceeded 77.67% of the total. In China, 66.59% of national nature reserves had new or expanded human activities from 2013 to 2015, and the amount of human activities increased by 2.45%. Compared with agricultural land and residential areas, the increase trend is more pronounced of the development or construction activities. From 2013 to 2015, the number of national nature reserves where human activities had no change covered 33.41% of the total number of national nature reserves in China, those with little change covered 45.06%, and those with and significant change covered only 21.53%. From the perspective of spatial distribution, the overall human activity in the national nature reserves of eastern China is greater than that of central and western parts of the country. The intensity of human activities in coastal and riverside national nature reserves is relatively strong.
中国国家级自然保护区人类活动及变化特征
DOI:10.11821/dlyj020200458
[本文引用: 1]
自然保护区是中国自然保护地的基础,是生物多样性保护的核心区域,国家级自然保护区更是中国自然保护区的主体。基于高分辨率影像数据,提取了中国446个国家级自然保护区2015年的人类活动及2013—2015年人类活动变化信息,分不同功能区、不同人类活动、不同区域和不同类型国家级自然保护区分析了人类活动及变化情况,并评估了2013—2015年人类活动变化强度和规律,结果表明:2015年,446个国家级自然保护区人类活动普遍存在,以农业用地和居民点占绝对优势,这两种类型人类活动总面积占国家级自然保护区人类活动总面积的88.94%、总数量占77.67%。2013—2015年,有66.59%的国家级自然保护区存在新增或规模扩大人类活动,人类活动数量增幅达到2.45%,相较于农业用地和居民点,开发建设活动的新增或规模扩大趋势更为明显。2013—2015年,33.41%的国家级自然保护区人类活动无变化,45.06%的国家级自然保护区人类活动变化较小,仅有21.53%的国家级自然保护区人类活动变化明显和较明显。从空间分布看,总体上东部的国家级自然保护区比中西部的国家级自然保护区人类活动变化强度大,沿海、沿河国家级自然保护区人类活动变化强度相对较大。
Analysis of conservation effectiveness of nature reserves based on NDVI in Yunnan Province
基于NDVI的云南省自然保护区保护成效分析
Conservation outcomes assessment of Sanjiangyuan alpine grassland with MODIS-EVI approach
DOI:10.17520/biods.2017196
[本文引用: 2]
The Sanjiangyuan Region is a priority area for ecosystem conservation in China. Since 2005, the government has contributed significant funding to implement ecological conservation and restoration to protect and restore the grasslands. This study correlated aboveground biomass (AGB) data from 248 sites scattered across the Sanjiangyuan Region with MODIS Enhanced Vegetation Index (EVI) data from 2000 to 2016 and utilized four regression models to estimate AGB by EVI. Results showed that power-function model worked best for grasslands in the Sanjiangyuan Region. Trend analysis showed no significant trends in 62% of the area of Sanjiangyuan, with 22% of the area, mainly distributed in the western and northern regions, increasing significantly and 16% of the area, sporadically located in the central and southern regions, decreasing significantly from 2000 to 2016. In general, the AGB of the entire area showed no significant increases or decreases with high annual fluctuations since 2000. However, there have been significant decreases since 2012. The AGB inside of the Sanjiangyuan Nature Reserve was lower than that found outside, and didn’t increase significantly during first-stage projects between 2005 and 2012, based on results from matching methods.
基于MODIS-EVI评估三江源高寒草地的保护成效
DOI:10.17520/biods.2017196
[本文引用: 2]
三江源是我国生态保护的优先区域。自2005年以来, 国家投入大量资金在三江源实施了一系列生态保护措施和工程, 主要目的之一是保护和恢复草地生态系统。本文基于中分辨率成像光谱仪(MODIS)增强型植被指数(EVI)数据和野外实测样方, 从草地生物量的角度评估了三江源工程的保护成效, 以期为后续的保护措施提供参考。本文使用2000-2016年间在青藏高原248个样地的实测地上生物量数据和同期的EVI数据, 比较了通过EVI估算草地地上生物量的不同建模方法, 并从中选择表现最佳的乘幂模型反演了三江源高寒草地的地上生物量, 用趋势分析法得出了生物量的变化。结果显示, 2000-2016年间, 三江源高寒草地地上生物量没有发生显著变化的面积占62%, 显著增加的地方主要在西部和北部, 占22%, 显著减少的地方则主要在中部和南部, 占16%; 2000-2016年间, 草地地上生物量的年际波动较大, 但总趋势不显著; 在2012年后, 地上生物量表现出显著降低的趋势。三江源国家级自然保护区外部的草地地上生物量高于内部, 使用匹配法比较保护区内外草地地上生物量变化的情况, 结果发现在生态保护工程实施的2005-2012年间, 三江源保护区内的草地生物量没有显著增加。
One hundred questions of importance to the conservation of global biological diversity
DOI:10.1111/j.1523-1739.2009.01212.x
PMID:19438873
[本文引用: 1]
We identified 100 scientific questions that, if answered, would have the greatest impact on conservation practice and policy. Representatives from 21 international organizations, regional sections and working groups of the Society for Conservation Biology, and 12 academics, from all continents except Antarctica, compiled 2291 questions of relevance to conservation of biological diversity worldwide. The questions were gathered from 761 individuals through workshops, email requests, and discussions. Voting by email to short-list questions, followed by a 2-day workshop, was used to derive the final list of 100 questions. Most of the final questions were derived through a process of modification and combination as the workshop progressed. The questions are divided into 12 sections: ecosystem functions and services, climate change, technological change, protected areas, ecosystem management and restoration, terrestrial ecosystems, marine ecosystems, freshwater ecosystems, species management, organizational systems and processes, societal context and change, and impacts of conservation interventions. We anticipate that these questions will help identify new directions for researchers and assist funders in directing funds.©2009 Society for Conservation Biology.
Evaluating conservation effectiveness of protected areas: Advances and new perspectives
DOI:10.17520/biods.2016162
[本文引用: 2]
Conservation effectiveness of protected areas indicates the status of main protected objects, and achievements in maintaining biodiversity and ecosystem function. Evaluation of conservation effectiveness is becoming a popular issue surrounding protected areas. From multiple spatial scales, subjects, methods and indicators, we reviewed advances in evaluating conservation effectiveness of protected areas. Recent studies have represented global, regional, national, and individual scales. Evaluated projects include the most common ecosystems (forests, wetlands, grasslands, deserts) and wild species. Evaluation methods have been moving from traditional direct before-and-after or inside-outside comparisons to “matching” techniques, which allows one to control for known landscape or environmental biases when determining the impacts of protection. Some researchers have explored indicator systems to make systematic evaluations of the effectiveness of protected areas, meanwhile others have tested indicators using case studies. In China, nature reserve is the backbone of the country’s protected areas system. Different ministries and state-level authorities have initiated evaluation of conservation effectiveness of nature reserves. We suggest that future studies should explore the following issues to improve the quality of nature reserves: (1) conservation effectiveness of nature reserve networks; (2) conservation effectiveness of different types of reserves; (3) integration of conservation effectiveness and management evaluation; and (4) potential impacts on nature reserves.
自然保护地保护成效评估: 进展与展望
DOI:10.17520/biods.2016162
[本文引用: 2]
自然保护地(protected areas)保护成效是指自然保护地对主要保护对象的保护效果, 及其在维持生物多样性和保障生态系统服务功能等方面的综合成效。近年来自然保护地保护成效评估逐渐成为国内外的研究热点之一。 本文分别从不同空间尺度、评估对象、评估方法以及评估指标等方面综述了相关的研究进展。总体来看, 近年来的研究已基本覆盖了全球、区域、国家和单个自然保护地等不同尺度, 针对森林、湿地、草地和荒漠等代表性生态系统以及野生动植物等主要保护对象进行了评估, 发展了“matching”技术等更为有效的分析方法, 探索了系统的自然保护地保护成效评估指标体系, 并应用一些指标进行了保护成效的案例研究。自然保护区(nature reserve)是我国自然保护地的主体, 近年来我国自然保护区相关管理部门也相继开展了保护成效评估工作, 建议未来进一步加强自然保护区网络尺度和各类型自然保护区的保护成效评估研究, 将自然保护区保护成效评估与管理评估相结合, 研究自然保护区保护成效面临的新问题和潜在影响, 为提升我国自然保护区管理质量提供科学依据。
Assessing the effectiveness of protecting reserves for nature assets in China
DOI:10.1007/s11442-015-1177-8
[本文引用: 1]
Evaluating the effectiveness of protecting nature assets is a vital component of responsive, pro-active management of protected areas. It is important to protect reserves of geological (including fossils) assets as a means to also protect national and natural heritage. At the end of 2013, 2669 protected areas had been established in China and 123 of them are reserves for nature assets. This paper builds an evaluation framework for protection effectiveness of these assets. The current elements and characteristics for effective protection are analyzed, along with an analysis of existing problems so as to construct a scientific approach to protect these assets. The influencing elements and characteristics for effective protection of nature asset reserves are included in an index evaluation system for effective protection in such areas, which contains four parts-target layer, evaluation criteria, evaluation indexes, and evaluation parameters-based on related documents and files. For the target layer, it includes nature asset evaluation and management evaluation. In the end, it is discussed how to build a comprehensive evaluation model and achieve an effective quantitative evaluation.
Dynamic monitoring and analysis of ecosystem disturbances in major vegetation types based on MODIS time series data in Southwest China
DOI:10.11821/dlyj020200467
[本文引用: 1]
Under the disturbance of natural conditions or human activities, the normal function of the ecosystem is more or less affected. The acquisition of ecosystem disturbance information can provide an important reference for tracking the responses of climate change, exploring global carbon cycle paths and sustaining normal ecosystem functions. The rapid development of satellite technology provides new ideas for the acquisition of ecosystem disturbance information. The remote sensing images with high spatio-temporal resolutions can effectively monitor the time and location of disturbance events in time. With Southwest China as the study area (involving Yunnan Province, Guangxi Zhuang Autonomous Region, Guizhou Province, Chongqing Municipality, Sichuan Province, part of Qinghai Province, and part of Tibet Autonomous Region), this research first calculated the annual data on ecosystem disturbances from 2007 to 2016 by applying a disturbance index model of remote sensing based on the 2005-2016 MODIS datasets on Land Surface Temperature (LST) and Enhanced Vegetation Index (EVI). The spatio-temporal patterns of ecosystem disturbances within forests and grasslands/shrubs were then investigated, and the effectiveness of the disturbance index model was validated by field observation points of fire, remotely sensed burned area data, Google Earth images, and government work reports. Finally, the study clarified the distribution characteristics of different intensity levels of ecosystem disturbances within forests and grasslands/shrubs. The results show that: 1) the disturbance index model of remote sensing in this paper was sensitive to ecosystem disturbance events, and it was significantly better than using enhanced vegetation index or land surface temperature alone. 2) The forest ecosystem disturbance and grassland-shrubs ecosystem disturbance extracted in this paper were highly consistent with Google Earth imagery and meteorological data. 3) Forest and grassland-shrub disturbances were the predominant disturbances in the study area, accounting for ~90% of the total disturbance area per year. 4) The areas with the most serious forest disturbances were mainly located in the western Sichuan Plateau, and fire was the main type of disturbance. The areas with the strongest disturbance of grassland-shrubs were pastoral zones on the Qinghai-Tibet Plateau, where drought caused by weather was the main type of disturbance.
基于MODIS时序数据的中国西南地区主要植被生态系统干扰动态监测及分析
DOI:10.11821/dlyj020200467
[本文引用: 1]
在自然或人为活动的干扰下,生态系统的正常功能或多或少受到影响。生态系统干扰信息可为跟踪气候变化响应、探寻全球碳循环路径和维系生态系统功能提供重要参考。飞速发展的遥感技术为生态系统干扰信息的获取提供了新的思路,高时空分辨率的遥感影像能及时有效地监测干扰事件发生的时间和位置。本文以中国西南地区为例,选用2005—2016年MODIS影像的地表温度LST(Land Surface Temperature)和增强型植被指数EVI(Enhanced Vegetation Index)产品,首先应用遥感干扰指数模型提取2007—2016年的逐年生态系统干扰数据,然后研究了西南地区森林与草地灌丛生态系统干扰的时空分布,并通过地面着火点观测记录、遥感火烧迹地数据、Google Earth和政府报告等验证干扰指数模型的有效性,最后明晰中国西南地区森林与草地灌丛干扰强度的分布特征。结果表明:① 本文使用的遥感干扰指数模型对干扰事件十分敏感,明显优于单独使用EVI或LST。② 本文提取的森林生态系统干扰和草地灌丛生态系统干扰与Google Earth、气象数据等保持高度一致。③ 森林与草地灌丛干扰是研究区内最主要的生态系统干扰,约占每年总干扰面积的90%。④ 森林干扰最强烈区在川西高原地区,可能的干扰类型为森林火灾,草地灌丛干扰最强烈区为青藏高原农牧区,可能的干扰类型为气象干旱干扰。
Human activity intensity of land surface: Concept, method and application in China
DOI:10.11821/dlxb201507004
[本文引用: 1]
Human activity intensity is a synthesis index for describing the effect and influence of land surface. This paper presents the concepts of human activity intensity and construction land equivalent, builds an algorithm model for human activity intensity, and establishes a method for converting different land use/land cover types into construction land equivalent as well. An application in China based on the land use data from 1984 to 2008 is also included. The results are shown as follows: (1) Human activity intensity is defined as the degree of land use, transformation and exploitation by human beings. It is an effective way to determine the construction land equivalent coefficient of different land use/land cover types by taking construction land equivalent as a basic unit and identifying the alteration of land surface natural properties caused by human activities. The application in China and correlation analysis with population density indicated that it is feasible to take the ratio of the construction land equivalent area to the total area as an indicator of human activity intensity. (2) We adopted a two-level method of eight attribute labels to construct general standard of converting different land use types into construction land equivalent, and establish a method for calculating the coefficient of construction land equivalent. We also built a coefficient table for constructing land equivalent of 49 land use types based on the latest land use classification system. (3) The human activity intensity in China increased from 7.63% in 1984 to 8.54% in 2008. It could be generally divided into five levels: very high, high, medium, low and very low, according to the human activity intensity at county level in 2008, which is rated by over 27%, 16%-27%, 10%-16%, 6%-10% and below 6%. The human activity intensity in China was spatially split into eastern and western parts by the line of Helan Mountain-Longmen Mountain-Jinghong; the eastern part was characterized by the levels of very high, high and medium, while the western part was featured by the low and very low levels.
陆地表层人类活动强度: 概念、方法及应用
DOI:10.11821/dlxb201507004
[本文引用: 1]
人类活动强度是表征人类对陆地表层影响和作用程度的综合指标。在定义陆地表层人类活动强度、建设用地当量等概念的基础上,建立了人类活动强度算法模型和土地利用/覆被类型的建设用地当量系数折算方法,并利用1984-2008年期间6个年份的土地利用数据,对中国进行了实证应用研究。结果表明:中国的人类活动强度变化大致以2000年为界,前期增长相对缓慢,后期增长明显加快,1984年全国的人类活动强度为7.63%,到2008年上升为8.54%。2008年县级单元的人类活动强度按大于27%、16%~27%、10%~16%、6%~10%和小于6%划分为高、较高、中等、较低和低5个等级,其空间分布格局大致以贺兰山—龙门山—景洪线为界分为东、西两个部分。东部是高、较高和中等类型的集中分布区,低和较低类型呈条带状分布于山地、丘陵区;西部以低和较低类型为主体,在甘肃河西走廊、青海东部及新疆天山南北坡有零散的中等和较高类型分布。
An assessment of the effectiveness of China’s nature reserves for mitigating anthropogenic pressures based on propensity score matching
基于倾向得分匹配方法的中国自然保护区缓解人类活动压力评估
DOI:10.11821/dlxb202103013
[本文引用: 3]
科学地评估自然保护区缓解人类活动压力的效果,对于有效的自然保护至关重要。目前中国国家尺度下的这方面研究,仅将保护区内、外的人类活动压力进行对比,其缺陷是样本选择性偏差会导致评估结果的不合理。本文选择了倾向得分匹配(Propensity Score Matching)方法来克服保护区评价中的样本选择性偏差问题。首先耦合多源数据构建了2013年、2015年、2017年的人类活动压力指数,然后采用倾向得分匹配方法对自然保护区内、外的随机点进行匹配,使两个对比组的观测变量尽可能相似。最后通过相对有效性指标和面板模型从不同层面评估了中国680个自然保护区在2013—2017年间缓解人类活动压力的效果。研究结果表明:① 2013—2017年,全国86.72%的自然保护区内人类活动压力指数呈现上升趋势,其面积占保护区总面积的43.80%。② 69.85%的自然保护区在缓解人类活动压力方面的效果较好。其中,除了海洋海岸、野生植物、野生动物类的保护区以外,其余保护区类型都表现出较好的缓解人类活动压力的效果,且保护区级别越高,保护效果越好。③ 中国自然保护区建设在2013—2017年间能缓解22.90%的人类活动压力,且保护区缓解人类活动压力的能力存在区域性差别。本文研究结果可为中国自然保护区监测、评估和管理提供更科学的参考依据。
Multi-scale analysis of trade-off/synergy effects of forest ecosystem services in the Funiu Mountain Region
DOI:10.11821/dlxb202005007
[本文引用: 1]
Forest ecosystem service trade-offs and synergies are important research topics for several disciplines. The multi-scale analysis of service trade-offs and synergies assists in the implementation of more effective forest resource management. Based on multi-source data including forest distribution, topography, NDVI, meteorology and soil conditions, key forest ecosystem services, including total forest volume, carbon storage, water yield, soil retention and habitat quality were mapped and evaluated for the Funiu Mountain Region through integrated deployment of the CASA model, the InVEST3.2 model and the ArcGIS10.2 software. The characteristics of trade-offs and synergies among different ecosystem services were then mapped and considered across multiple spatial scales (i.e., by region, north and south slopes, vertical belt) using the spatial overlay analysis method. The main results are as follows: (1) Mean forest volume is 49.26 m 3/hm 2, carbon density is 156.94 t/hm 2, water supply depth is 494.46 mm, the unit amount of soil retention is 955.4 t/hm 2, and the habitat quality index is 0.79. (2) The area of forests with good synergy is 28.79%, and the area of forests with poor synergy is 10.15%, while about 61.06% of forests show severe trade-offs and weak trade-offs. The overall benefits of forest ecosystem services in the study area are still low. In the future, bad synergy and severe trade-off areas should be the focus of forest resource management and efficiency regulation. (3) Synergy between ecosystem services is better for forest on south slope than that on north slope. Deciduous broad-leaved forest belt at moderate elevations on south slope in the mountains (SIII) has the highest synergies, while that at low elevations on north slope (NI) exhibits the lowest synergy levels.
伏牛山地区森林生态系统服务权衡/协同效应多尺度分析
DOI:10.11821/dlxb202005007
[本文引用: 1]
森林生态系统服务权衡与协同研究已成为当前相关学科的研究热点和前沿,对服务权衡与协同关系的多尺度分析有助于更加有效地实施森林资源管理。综合森林类型图、NDVI、气象和土壤等多源数据,借助CASA模型、InVEST 3.2模型和ArcGIS 10.2软件,开展伏牛山地区森林生态系统服务评估,运用空间叠置方法从多个空间尺度(区域、南北坡、垂直带)探讨服务权衡与协同效应。结果表明:① 研究区森林生态系统平均蓄积量为49.26 m <sup>3</sup>/hm <sup>2</sup>,碳密度为156.94 t/hm <sup>2</sup>,供水深度为494.46 mm,土壤保持量为955.4 t/hm <sup>2</sup>,生境质量指数为0.79。② 区域尺度上,28.79%的森林服务之间存在高协同效应,10.15%的森林存在低协同效应,61.06%的森林存在强权衡和弱权衡效应。③ 南北坡尺度上,南坡服务之间的协同关系优于北坡。垂直带尺度上,南坡中山落叶阔叶林带(SIII)服务之间协同关系最好,北坡低山落叶阔叶林带(NI)协同关系最差。
Phenology of forest vegetation and its response to climate change in the Funiu Mountains
DOI:10.11821/dlxb201801004
[本文引用: 2]
The study on vegetation phenology is of great importance to understand the relationship between vegetation and climate. In areas where the vegetation is sensitive to climate change, a phenological study is helpful to reveal the response mechanism of vegetation to climate change. Based on Moderate Resolution Imaging Spectro radiometer (MODIS) Enhanced Vegetation Index (EVI) time-series images from 2000 to 2015, we utilized Savitzky-Golay (S-G) filter and dynamic threshold method to extract the phenological parameters of forest vegetation in the Funiu Mountains. Combining temperature and precipitation data, we used Mann-Kendall (M-K) trend test, Theil-Sen estimator, ANUSPLIN interpolation, and correlation analysis methods to analyze phenological changes of vegetation in response to climate factors (temperature/precipitation) in the Funiu Mountains. The results showed that: (1) The start and end of growing season ranged mainly from 105 d to 120 d and from 285 d to 315 d, respectively. The length of the growth season ranged mainly from 165 d to 195 d. There is an evident correlation between forest phenology and altitude. With increasing altitude, the start, end and length of the growing season presented a significantly delayed, advanced and shortened trend, respectively. (2) In terms of the interannual variations, both the start and end of the growing season mainly displayed a delayed trend in 76.57% and 83.81% of the total area, and the length of the growing season exhibited a lengthened trend of 61.21%. The start of forest growing season is mainly affected by the decrease of spring temperature in the region. (3) A significant correlation was found between the start of growing season and mean temperature in March. The negative correlation coefficient indicated that a delayed start of the growing season was primarily due to the temperature decrease in March. The end of growing season was mainly influenced by September precipitation, and their correlation was positive, that is, the increased precipitation in September can delay the end of the growing season. In addition, the length of the growing season was influenced by temperature and precipitation during the whole growing season, for most parts of the region, the mean temperature and precipitation in August were obviously correlated with the length of forest growing season.
伏牛山地森林植被物候及其对气候变化的响应
DOI:10.11821/dlxb201801004
[本文引用: 2]
研究植被物候是理解植被与气候关系的重要途径。在植被对气候变化响应的敏感地区,开展植被物候研究有助于揭示气候变化对植被的影响机制。基于2000-2015年MODIS EVI时间序列影像数据,利用Savitzky-Golay (S-G)滤波方法和动态阈值法提取伏牛山地2000-2015年森林植被物候参数,结合气温、降水数据,运用Man-Kendall趋势检验、Sen斜率、ANUSPLIN插值和相关性分析等方法,研究伏牛山地森林植被物候对气候要素(气温、降水)变化的响应。结果表明:① 伏牛山地森林植被生长季始期主要集中在第105~120 d,生长季末期主要集中在第285~315 d,生长季长度主要集中在165~195 d。从海拔梯度看,随海拔升高,生长季始期、末期和长度整体上分别呈显著推迟、提前及缩短趋势。② 生长季始期和生长季末期整体上呈推迟趋势,推迟的像元分别占森林植被的76.57%和83.81%。生长季长度整体呈延长趋势,延长的像元占比为61.21%。生长季始期变化特征主要是由该地区的春季气温降低所导致的。③ 研究区森林植被生长季始期与3月平均气温呈显著偏相关,且呈负相关的区域最多,即3月平均气温降低,导致生长季始期推迟;生长季末期与9月降水呈显著偏相关区域最多,且两者主要呈正相关,即9月降水增加,使生长季末期推迟。植被生长季长度由整个生长期的气温和降水来共同作用,对大多数的区域而言,8月的平均气温和降水与生长季长度的关系最为密切。
Human appropriation of net primary production: A review
DOI:10.18306/dlkxjz.2022.02.013
[本文引用: 3]
Human activities are unprecedentedly transforming the ecosystems of planet Earth, and quantifying the impacts of human activities on ecosystems therefore becomes increasingly important in ecological and geographical research. Human appropriation of net primary production (HANPP) is an indicator to quantify the extent of human activities impacting on the energy flows of ecosystems. The research of HANPP is developing, from the discussion on theories and methodology and case studies, toward the application of HANPP as an indicator in many research fields of ecology and geography. This review introduced the definition and estimating methods of HANPP; reviewed the previous works; then discussed the advantages and limitations, especially future issues and applications of HANPP concerning ecosystem structures, functions, services, biodiversity, sustainability, human well-being, and the mechanism of human activities impacting on ecosystems. We hope that this review will inspire more HANPP research and promote the quantification, systematization, and interdisciplinarity development of the human-environment relationship research.
净初级生产力的人类占用研究进展
DOI:10.18306/dlkxjz.2022.02.013
[本文引用: 3]
人类活动对生态系统的影响和改变已达到前所未有的程度,如何量化人类活动对生态系统的影响成为了生态学和地理学研究中的热点问题。净初级生产力的人类占用(HANPP)是量化人类活动对生态系统能量流的影响程度的指标。目前HANPP研究开始从理论和方法的讨论及案例研究,转向作为指标应用到生态学和地理学研究的诸多领域,其重要性日益凸显。因此,论文详细介绍了HANPP的概念和估算方法;综述了其主要研究进展;讨论了HANPP的优劣及其适用范围,并着重展望了其与生态系统结构、功能、服务、生物多样性、可持续发展和人类福祉等方面有关的未来具体研究方向和科学问题,以及如何运用其探讨人类活动对生态系统的影响机制。期望启发更多与HANPP有关的研究,推动人类活动对生态系统的影响研究向定量化、系统化及多学科交叉的方向发展。
Assessment of protection effectiveness of nature reserves on the Tibetan Plateau based on net primary production and the large-sample-comparison method
DOI:10.11821/dlxb201507001
[本文引用: 4]
A total of 21 typical coupled large samples were chosen from areas in the nature reserves and their surroundings on the Tibetan Plateau (TP) with large-sample-comparison method (LSCM). To evaluate the protection effectiveness of the nature reserves, we compared the alpine grassland net primary production (NPP) of these coupled samples and analyzed the differences between them before and after their establishment as protected areas. The results show that: (1) In view of alpine grassland NPP, the ecological and environmental conditions of most nature reserves were more fragile than those of their surrounding areas and also lower than the average values for the TP. (2) Of the 11 typical nature reserves selected, the positive trend of NPP in Manzetang is the most significant, while in Taxkorgan, the trend is not obvious. Moreover, with the exception of Selincuo, the annual NPP growth rate in nature reserves covered by meadow and herbaceous wetland is higher than that in nature reserves consisting of steppe and desert grassland. (3) Some notable findings existed in 21 typical coupled samples: (a) After the establishment of nature reserves, the annual NPP increase rate in 76% of samples inside nature reserves and 82% of samples inside national nature reserves are apparently higher than that of corresponding samples outside nature reserves. (b) The ecological protection effectiveness in Central Kunlun, Changshagongma, Zoige Wetland, and Siling Co nature reserves is significant; in most parts of the Three Rivers' Source and Qiangtang nature reserves, the protection effectiveness is relatively significant, while in south-east Manzetang and north Taxkorgan, the protection effectiveness is not obvious. (c) The ecological protection effectiveness is significant in nature reserves consisting of meadow; however, it is weak in nature reserves covered by steppe.
基于NPP数据和样区对比法的青藏高原自然保护区保护成效分析
DOI:10.11821/dlxb201507001
[本文引用: 4]
在青藏高原选择11个代表性自然保护区,基于高寒草地植被净初级生产力(Net Primary Production,简写NPP)变化过程数据,比较分析了自然保护区与其相邻等面积区域的NPP变化差异;采用样区对比法,在自然保护区内外选取21组对比样区,比较自然保护区建立前后及其内外的生态状况,评估了自然保护区的保护成效。研究表明:1. 1982-2009年间,82%的代表性自然保护区NPP比保护区周邻区域及青藏高原的平均水平低,反映了自然保护区的生态系统状况更为脆弱;2. 在代表性自然保护区中,曼则塘自然保护区的NPP增长趋势最为明显,塔什库尔干野生动物自然保护区的NPP增长趋势最弱;除色林错自然保护区外,以草甸和湿地为主的自然保护区NPP增速明显高于以草原与荒漠草地为主的自然保护区;3. 代表性样区的研究发现:① 自然保护区内76%以上的样区和国家级保护区内82%以上的样区NPP增加幅度明显高于保护区外对应样区的增幅;② 取得明显保护效果的有中昆仑、长沙贡玛、若尔盖和色林错等自然保护区;曼则塘自然保护区的东南部边缘地区和塔什库尔干野生动物自然保护区的北部边缘地区的效果不明显,可能与保护区及其周邻地区人类扰动增强密切相关;③ 高寒草甸类型自然保护区的保护效果最为显著,高寒草原类型自然保护区的保护效果较差。本研究展示了样区对比法在评估大区域生态变化中所具有的独特优势,其关键在于科学设计样区并进行合理的空间抽样。
Assessment of the ecological protection effectiveness of protected areas using propensity score matching: A case study in Sichuan, China
DOI:10.3390/ijerph19084920
URL
Protected areas constitute a global strategic resource for enhancing the effectiveness of ecological protection, which can alleviate the impact of unsustainable human production and living activities on the ecological environment. However, the spatiotemporal evolution of ecological protection effectiveness needs to be quantitatively revealed. The net primary productivity (NPP) of plants is an important measure of the effectiveness of ecological protection efforts. The main purpose of this study is to use the relative change in the annual average NPP to evaluate the ecological protection effectiveness of protected areas. We compared the historical changes in the annual average NPP of protected areas in Sichuan Province from 2000 to 2019. We added the spatial coordinates to the impact factor system and adopted propensity score matching (PSM) in a quasi-natural experimental method to determine the experimental group and the control group. The ecological protection effectiveness of the protected areas in the study area in 2000, 2005, 2010, 2015, and 2019 was measured and classified into three types of changes in protection effectiveness, namely effective, ineffective, or fluctuating. According to the administrative level, type, and spatial distribution, we determined the number and type of changes in the protection effectiveness of different protected areas. The results show that the annual average NPP of the protected areas in Sichuan Province generally fluctuated. The annual average NPP increased in 95.47% of the total protected area and decreased in 4.53%. The overall protection effectiveness of protected areas was positive and significant and gradually improved. Effective protected areas at the national, provincial, and county levels accounted for 40.27% of the total number of protected areas, and the other 14.77% of effective protected area was managed at other administrative levels. Among the different types of protected areas, the proportion of effective protected areas was highest in wild animal protected areas, followed by forest ecology protected areas, wild plant protected areas, and wetland ecology protected areas. The results of this study can provide an important reference for the verification and improvement of the ecological protection effectiveness of various protected areas.
Assessing the dividing line between warm temperate and subtropical zones based on the zonality discussion on multi-dimensional response of net primary productivity to climate change in the Qinling-Daba Mountains
DOI:10.1016/j.chnaes.2020.12.003 URL [本文引用: 2]
秦巴山地NPP及对气候变化响应的多维地带性与暖温带-亚热带界线
Disturbance impacts of land use change on biodiversity conservation priority areas across China during 1990-2010
DOI:10.11821/dlxb201411005
[本文引用: 1]
Considering the impacts of land use change on biodiversity conservation services of varied ecosystems, the Ecosystem Comprehensive Anthropogenic Disturbance Index (ECADI) is built to assess disturbance impacts of land use change during 1990-2010 on biodiversity conservation priority areas of China at national and regional scales. Four levels of biodiversity conservation areas are categorized: generally important areas, moderately important areas, important areas, and very important areas. Results showed that: In 2010, the ECADI value is higher in Central and Eastern China than that in Western China, and the values of the moderate important, important and very important regions are lower than the average value of the whole country at all levels. Notably, in recent 20 years, the change extent of ECADI in Central and Eastern China was much greater compared with that in Western China, and the change extent of ECADI in the moderately important, important and very important biodiversity conservation regions all showed slightly increasing trends, with the increasing degree lower than that of whole China at all levels. Due to human activities such as urbanization in Eastern China and cropland reclamation in Northeast China and Xinjiang, ECADI value in the moderately important, important and very important biodiversity conservation areas showed an increasing trend, which should be given more attention. However, ECADI value in the Loess Plateau presented a decreasing trend because of the obvious effectiveness of Green for Grain Project. Furthermore, the variation was negligible in the Tibetan Plateau.
1990-2010年中国土地利用变化对生物多样性保护重点区域的扰动
DOI:10.11821/dlxb201411005
[本文引用: 1]
基于人类土地利用活动对不同生态系统生物多样性保护服务的影响,构建生态系统综合人类扰动指数,结合不同级别的生物多样性保护区域 (一般重要、中等重要、重要、极重要四个级别) 从全国尺度及区域尺度分析了中国1990-2010年土地利用变化对生物多样性保护重点区域的扰动。结果表明:就2010年现状而言,我国中东部地区人类扰动程度较大,西部地区人类扰动程度较低,全国生物多样性保护中等重要、重要、极重要区域的人类扰动程度低于全国整体 (包括所有级别) 均值。就20年来人类扰动程度变化态势而言,全国中东部人类扰动程度变化幅度总体高于西部,生物多样性保护中等重要、重要、极重要区域人类扰动程度均呈轻微上升趋势,但增加幅度低于全国整体增加幅度。随着东部地区的快速城市化以及东北、新疆等地区的农田开垦等土地利用活动,生物多样性保护中等重要、重要、极重要区域等重点区域人类扰动程度呈现上升趋势,应引起重视;而随着黄土高原等地区退耕还林还草工程的实施,人类扰动程度整体则呈现一定的下降趋势。青藏高原区扰动变化幅度很小,几乎没有变化。总体而言,中国目前陆地国土开发利用的空间格局与生物多样性保护保护重要区域的空间分布是相互匹配的,这有利于国家生物多样性保护的整体布局。同时,20年来生态系统综合人类扰动指数变幅的区域分异也与生物多样性保护重要性空间格局相吻合,说明20年来针对生态保护的各项政策与措施在减少生物多样性保护重点区域人类扰动方面产生了积极的成效。
Protection efficacy of national wetland reserves in China
中国国家级湿地自然保护区保护成效初步评估
Dynamic changes of habitats in China’s typical nature reserves on spatial and temporal scales
中国典型自然保护区生境状况时空变化特征
DOI:10.11821/dlxb201801008
[本文引用: 3]
中国已建立各类自然保护区2740个,占全国陆地面积的14.8%。本文以典型国家级自然保护区为例,基于遥感反演、模型模拟、空间分析等方法,获得植被覆盖度、净初级生产力(NPP)和土地覆被时空数据集,分析2000-2015年中国不同区域、不同类型自然保护区生境状况时空变化及人类扰动的影响,进而评估自然保护区在栖息地及生物多样性保护方面的效果。结果表明:2000-2015年,国家级自然保护区植被覆盖度从36.3%提高到37.1%,各类型自然保护区均有不同程度提高,其中森林类保护区年增速0.11%,草原草甸类0.84%,内陆湿地类0.21%,荒漠生态类0.09%,野生动物类和野生植物类则分别为0.11%和0.08%。草原草甸类、内陆湿地类、荒漠生态类、野生动物类自然保护区植被NPP年增速分别为2.06 g·m<sup>-2</sup>、1.23 g·m<sup>-2</sup>、0.28 g·m<sup>-2</sup>、0.4 g·m<sup>-2</sup>,而森林类和野生植物类则分别以3.45 g·m<sup>-2</sup>和2.35 g·m<sup>-2</sup>的年速率减少。近15年,国家级自然保护区内人类扰动呈现微弱变化,除青藏高原区和南亚热带湿润区内保护区人类扰动略微下降以外,其他区域均有所增强,特别是北亚热带和温带湿润区,其保护区人类扰动由4.70%明显增至5.35%。
