


随着城市化的高速发展, 全球湿地遭到严重破坏, 生物多样性也随之锐减(Kale et al, 2018; 马硕等, 2021)。小微湿地以其面积小、数量多的独特优势, 提高了城市中湿地生境的连续性, 是城市复合生态系统的重要组成部分(马世骏和王如松, 1984; Murillo-Pacheco et al, 2018; 赵晖等, 2018; 崔丽娟等, 2021)。小微湿地在城市中广泛分布, 为城市生物提供丰富的食物、良好的生存场所和繁衍空间(Jasmani et al, 2017)。然而, 以往城市湿地生物多样性和生态系统功能的研究主要集中在大型湿地上(Strohbach et al, 2013)。随着城市化发展进程的加快, 生物多样性受到的威胁日趋严重, 小微湿地生物多样性的保护日益受到重视(Blackwell et al, 2011)。
鸟类作为生物多样性的重要组成部分, 对城市生态系统健康水平具有重要的指示作用(陈水华等, 2002; 杨刚, 2014)。城市小微湿地是城市鸟类的重要栖息地, 各小微湿地鸟类群落可视为若干局域群落, 这些群落构成了城市湿地鸟类的复合群落(崔丽娟等, 2021)。同时, 城市湿地鸟类多样性受多种环境因子的影响, 在不同的湿地环境具有不同的时空特征(Yang et al, 2020; Rico-Silva et al, 2021)。大量研究表明, 湿地面积是鸟类物种丰富度的关键影响因素, 面积较大的湿地可以容纳更多的鸟类物种, 同时物种的迁移率和灭绝率受湿地斑块的大小及湿地斑块间的距离的影响显著(Zhou & Chu, 2012; Chang & Lee, 2016; Dale, 2018; Meixler et al, 2019; Rico-Silva et al, 2021)。城市进程中土地利用方式的改变导致城市湿地丧失或人为干扰程度增大, 鸟类物种丰富度与城市化程度呈现显著的负相关(Chace & Walsh, 2006)。然而一些研究表明, 湿地鸟类多样性在不同的城市化梯度以不同的速度丧失, 而鸟类物种丰富度在中度城市化地区的湿地中达到峰值(Marzluff, 2005; Batáry et al, 2018)。湿地内建筑面积比例的增高使得湿地内自然生境减少, 对鸟类物种产生负面影响(Leveau & Leveau, 2016)。形状复杂的湿地由于受边缘效应的影响更加显著, 鸟类物种也随之减少(Yang et al, 2020)。此外, 城市湿地的物种丰富度在很大程度上取决于物种的迁徙时间(LaSorte et al, 2014)。与低城市化的城市湿地相比, 高度城市化的城市湿地中鸟类群落组成的季节性变化较小(Leveau et al, 2015; Leveau & Leveau, 2016)。
目前, 鸟类群落多样性的研究主要集中在α多样性和β多样性两个尺度上(Anderson et al, 2011; Nielsen et al, 2014)。α多样性表示某个特定区域或群落的物种丰富度, β多样性则表示不同环境梯度或格局下群落组成变化的幅度。由于α多样性和β多样性分别度量了同一区域以及不同区域间物种组成的差异, 因此使用两种多样性共同分析能够在不同维度上更为直观地反映环境因子与鸟类多样性时空格局形成的相互作用(陈攀等, 2009; 谭珊珊等, 2013)。同时, β多样性可拆分为周转和嵌套两个组分(Baselga, 2010)。物种周转表示不同群落间的物种替换, 物种丧失会导致群落间物种丰富度产生差异; 而当物种丰富度差异沿着某一梯度呈现出有序排列时, 拥有较少物种的群落将是拥有较多物种的群落的子集, 从而构成嵌套格局(斯幸峰等, 2017)。物种周转和嵌套组分在空间维度上反映了不同栖息地的质量和复合鸟类群落的时空动态变化特征, 为深入理解城市湿地鸟类多样性维持机制提供了一个视角, 为加强城市生物多样性保护提供了理论依据。
本文以合肥市小微湿地及其鸟类作为研究对象, 探讨小微湿地面积、湿地形状、建筑面积比例、植被面积比例、环境噪声、人为干扰和城市化指数等环境因子对小微湿地鸟类α多样性、β多样性及其空间周转和嵌套组分的影响程度, 旨在识别影响小微湿地鸟类多样性时空格局的关键环境因子, 提出促进城市鸟类保护及其栖息地建设的小微湿地建设和管理建议。
1 研究区域概况
合肥市位于安徽中部, 长江与淮河之间(116°41′-117°58′ E, 30°57′-32°32′ N), 地势平坦, 属亚热带季风性湿润气候, 年际降水量变化较大, 年均降水量近1,000 mm, 主要集中在夏季①( 徐素云 (2017) 合肥市土地资源承载力综合评价研究. 硕士学位论文, 安徽农业大学, 合肥.)。区域内水系发达, 境内巢湖是中国五大淡水湖之一, 同时包含淝河、沛河、派河、丰乐河等多条河流和董铺水库、高王水库等水库②(②刘伟 (2018) 基于生态风险性评价的合肥市主城区生态网络构建. 硕士学位论文, 南昌大学, 南昌)。多条河道纵横交织与各水库形成了相互连接的水系网络, 使得合肥市生物资源丰富且小微湿地数量众多, 是研究小微湿地鸟类多样性的良好场所。
2 研究方法
2.1 小微湿地选择
利用Google Earth确定小微湿地的潜在位置, 同时通过实地调查确保小微湿地能够到达并进行观测。确定小微湿地样本的原则主要包括: (1)各小微湿地与合肥市中心的距离具有明显差异; (2)将湿地面积分为小(0-2 ha)、中(2-5 ha)、大(5-8 ha) 3个梯度, 每个梯度选取同等个数小微湿地; (3)小微湿地的形状、植被面积等环境因子均有较明显差异。根据上述原则, 本研究最终选取了合肥市的45个小微湿地作为具体研究区域(图1), 并根据小微湿地面积在研究区域内共设置210个样点进行鸟类监测。选取的研究区域代表了合肥市大多数小微湿地的普遍特征。
图1
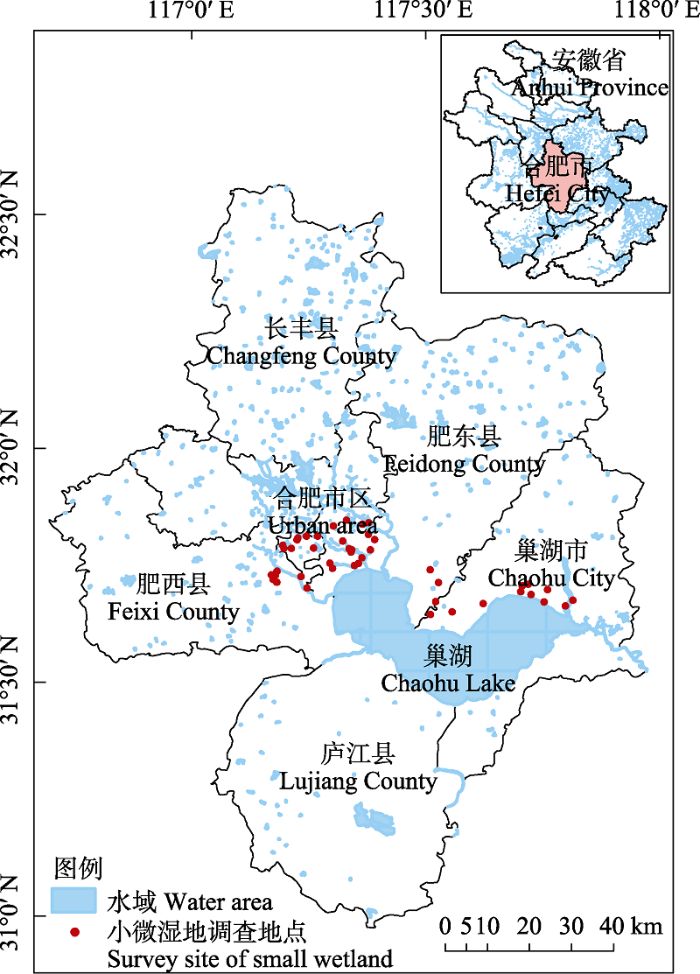
图1
安徽省合肥市小微湿地研究区域及调查地点分布图
Fig. 1
Distribution of study area and survey sites in Hefei City, Anhui Province
2.2 鸟类调查
2020年8月至2021年7月, 选择晴朗无风的天气, 采用样点法开展调查。沿小微湿地岸边设置半径为50 m的样点, 对面积小于样点半径范围的小微湿地进行全覆盖调查, 对于面积大于样点半径范围的小微湿地, 则根据小微湿地面积与样点面积之比, 确定最大样点个数, 确保样点覆盖的范围能体现各小微湿地的鸟类多样性状况。本研究共设置210个样点, 为防止观测重叠, 将样点之间的距离设置为至少100 m。借助双筒望远镜(Swarovski, 8.5 × 42, Austria), 观测和记录每个样点遇见的鸟类物种、数量, 对飞过样点但未停留的鸟类不做记录, 每个样点的观测时间为10 min。调查时间为鸟类活动高峰期(上午: 冬季7:00-10:00, 夏季5:00-9:00; 下午: 冬季15:00至日落, 夏季16:30至日落), 每月1次。为降低人员变化产生的误差, 每次调查人员固定。整理鸟类的种类和数量分布、居留型、地理型等(张荣祖, 1999; 郑光美, 2017)。
2.3 环境因子获取
(1)湿地面积: 使用Google Earth测量小微湿地面积(单位: ha)。
(2)湿地形状指数(SI): 使用Google Earth获取小微湿地的面积和周长。计算公式为: SI = G / [2(π × A)0.5]; G表示湿地周长(单位: m), A表示湿地面积(单位: ha) (Ewers & Didham, 2007)。
(3)建筑面积比例: 在Google Earth上勾勒出小微湿地边界并导入ArcGIS 10.8中。沿小微湿地边界向外延伸50 m缓冲区(Xie et al, 2020), 测量小微湿地及缓冲区内总的建筑面积(单位: ha)。计算公式为建筑面积比例 = 建筑面积/(小微湿地面积 + 缓冲区面积)。
(4)植被面积比例: 与建筑面积比例获取方式相同。在Google Earth上勾勒出小微湿地边界并导入ArcGIS 10.8中。采用与建筑面积比例相同的方法测量小微湿地及缓冲区内总的植被面积(单位: ha)。计算公式为植被面积比例 = 植被面积/(小微湿地面积 + 缓冲区面积)。
(5)环境噪声: 使用分贝仪在每个小微湿地内的鸟类监测样点进行环境噪声测量。每月分别在早中晚3个时段进行1次测量, 每个样点测量时长为10 分钟。最终对每个样点测得噪声值取平均数作为该小微湿地的环境噪声(单位: dB)。
(6)人为干扰程度: 该值为估测值, 每月与噪声测量同步进行, 在小微湿地内的鸟类监测样点观察并记录人流量, 每个样点监测时长为10分钟, 最终采用平均值。本研究依照人为活动情况分为5个等级, 1级表示样点内无人; 2级表示样点内人流量为1-2人/min; 3级表示样点内人流量为3-7人/min; 4级表示样点内人流量为8-17人/min; 5级表示样点内人流量为18人/min及以上(陈水华等, 2000)。
(7)城市化指数: 计算公式为城市化综合指数 = 100/至市中心距离 + 环境噪音 + 20 × 水污染程度 + 20 × 人为干扰程度 + 建筑指数/2。其中, 至市中心距离以位于合肥市中心且人流量最大的之心城购物中心为中点, 使用Google Earth测量各小微湿地中心点至市中心距离(单位: m)。水污染程度根据水的透明度和水生生物进行估测, 分为5个等级, 1级表示水透明度高且有鱼类; 2级表示轻度浑浊, 但仍能发现鱼类; 3级表示水透明度较低, 未发现鱼类但有底栖生物; 4级表示水透明度很低, 无鱼但有底栖生物; 5级表示水透明度很低, 未发现水生生物。建筑指数表示小微湿地周围建筑的比例, 建筑指数 = 小微湿地中心500 m范围内建筑的面积 + 0.5 × (小微湿地中心1,000 m范围内建筑的面积) + 0.25 × (小微湿地中心2,000 m范围内建筑的面积) + 0.125 × (小微湿地中心3,000 m范围内建筑的面积)。计算中将各参数值调整为0-100, 数值越高则城市化程度越高。其中, 至市中心距离实测值倒置后乘以100; 水污染程度和人为干扰程度的参数值分别乘以20; 平均噪声监测值在30-80, 不调整; 建筑指数的实测值在0-200, 除以2 (陈水华等, 2000)。
2.4 多样性指数的计算
2.4.1 α多样性指数
式中, D为某个小微湿地鸟类的密度(ind./ha); N为某个小微湿地记录到的鸟类的总数量; S为小微湿地样点的总面积(ha)。
(2) Shannon-Wiener多样性指数:
式中, T为小微湿地鸟类的物种总数; Pi为小微湿地内第i个物种的数量占鸟类总数的比例。
2.4.2 β多样性指数
β多样性指数选用Sørensen成对相异性指数(βsor)计算, 同时使用Baselaga分解法将两两小微湿地间的成对相异性指数分解为空间周转组分(βsim)和嵌套组分(βsne) (Baselga, 2010)。
式中, a为2个小微湿地间共有的物种数; b为第1个小微湿地拥有而第2个小微湿地没有的物种数; c为第2个小微湿地拥有而第1个小微湿地没有的物种数。
选用Sørensen多点相异性指数对总体β多样性及其空间周转和嵌套组分进行计算。参考Sørensen成对相异性指数的分解方法, 将Sørensen多点相异性指数(βSOR)分解为空间周转组分(βSIM)和嵌套组分(βSNE) (Baselga, 2010)。
式中, bij为小微湿地i中的特有物种数; bji为小微湿地j中的特有物种数; Si为小微湿地i中的物种总数; ST为所有调查小微湿地中的总物种数。
使用物种空间周转组分和嵌套组分所占比例表示小微湿地鸟类β多样性由何种组分决定, 即βratio = βSNE/βSOR。当βratio < 0.5时, 表示β多样性主要由物种空间周转决定; 若βratio > 0.5, 则表示β多样性主要由嵌套组分贡献。
2.5 数据分析
在进行分析之前, 为避免因各环境因子之间的多重共线性关系而对分析结果造成干扰, 采用Pearson相关性检验了7个变量之间的两两相关性。其中, 人为干扰与城市化指数之间的相关系数|r| > 0.7 (附录2), 同时由于人为干扰与鸟类多样性的相关性较低, 因此在后续的分析中将人为干扰去除, 保留了其他的环境因子用于以下的分析。
(1) α多样性分析。选用基于信息论的模型选择和模型平均法来分析小微湿地环境因子对鸟类α多样性的影响。首先对保留下的环境因子进行所有可能的模型组合, 使用校正的赤池信息准则(AICc)进行组合的筛选和排序。ΔAICc < 2时的模型被认为是真实模型(Guthery et al, 2003)。然后, 我们通过计算ΔAICc得到每个模型的Akaike权重(wi), 据此可选择最佳模型(wi > 0.9) (Anderson et al, 2001; Guthery et al, 2003)。最后, 由于Akaike权重(wi)表明没有一个模型是明显最好的, 我们采用模型平均(model- average)的方法计算每个参数在95%置信区间内的相对重要性、模型估计值和标准误, 以排除模型选择中的不确定性(附录3)。
(2) β多样性分析。由于数据集具有高维的特征, 传统的多元回归难以适用。因此, 在分析β多样性及其组分与小微湿地环境因子的关系时, 使用基于相异度矩阵或距离矩阵的多重回归模型(multiple regression model, MRM)。即在两个或多个相异度矩阵或欧式距离矩阵的基础上进行回归分析, 以解释一组变量对另一组变量的整体效应。首先, 计算小微湿地间的成对相异性指数从而得到相异度矩阵, 然后, 计算环境因子的欧几里得距离矩阵, 最后, 使用MRM模型分别对环境因子距离矩阵进行回归获得回归方程以及相关系数和P值(附录3)。
以上所有统计分析均在R 4.1.0及相应的MuMIn包、ecodist包中完成。
3 结果
3.1 小微湿地鸟类群落组成
在合肥市小微湿地共记录鸟类13目39科102种(附录4), 以雀形目鸟类最多, 为60种, 占58.82%。水鸟31种, 以鸻形目最多, 为11种, 占10.78%。共有冬候鸟30种, 夏候鸟27种, 分别占29.41%和26.47%; 旅鸟8种, 占7.84%; 留鸟37种, 占36.27%。鸟类区系组成分析结果显示, 44种为古北界种, 33种为东洋界种, 25种为广布种。
各小微湿地分布的鸟类中, 有国家二级重点保护野生鸟类2种: 燕隼(Falco subbuteo)、小鸦鹃(Cuculus bengalensis); 安徽省一级重点保护野生鸟类10种, 包括噪鹃(Eudynamys scolopacea)、大鹰鹃(Cuculcs sparverioides)、四声杜鹃(Cuculus micropterus)、家燕(Hirundo rustica)、金腰燕(Cecropis daurica)、北红尾鸲(Pheonicurus auroreus)、黑卷尾(Dicrurus macrocercus)、灰喜鹊(Dendrocitta formosae)、红尾伯劳(Lanius cristatus)和棕背伯劳(L. schach); 安徽省二级重点保护野生鸟类7种, 包括红头潜鸭(Aythya ferina)、斑嘴鸭(Anas zonorhyncha)、绿翅鸭(A. crecca)、赤麻鸭(Tadorna ferruginea)、环颈雉(Phasianus colchicus)、黑枕黄鹂(Oriolus chinensis)和暗绿绣眼鸟(Zosterops japonicus)。IUCN濒危物种红色名录中的易危(VU)物种1种, 即红头潜鸭。
3.2 鸟类多样性季节分布格局
合肥市城市小微湿地鸟类多样性在不同季节呈现差异性分布(图2), 陆地鸟类多样性明显高于水鸟。从物种丰富度来看, 陆地鸟类和水鸟物种丰富度均在冬季最高, 其中陆地鸟类丰富度在秋季最低, 而水鸟物种丰富度在夏季最低。鸟类密度季节差距较为显著, 陆地鸟类和水鸟均呈现冬夏两季显著高于春秋两季的分布特征, 其中冬季最高而春季最低。从Shannon-Wiener多样性指数来看, 陆地鸟类在各季节中差距较小, 整体呈现春季 > 夏季 > 秋季 > 冬季的分布趋势。而水鸟Shannon-Wiener多样性指数在冬季最高, 春季最低。陆地鸟类Pielou均匀度指数在春秋季节明显高于冬夏两季, 而水鸟Pielou均匀度指数则表现为春秋两季明显低于冬夏两季。
图2
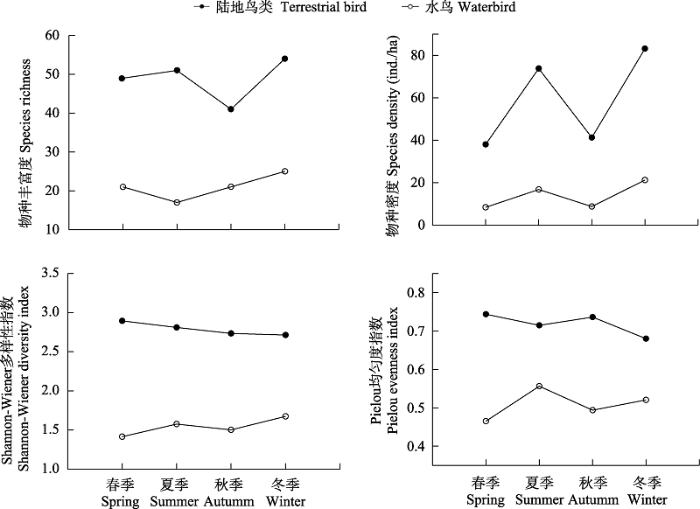
图2
合肥市小微湿地鸟类多样性季节变化特征
Fig. 2
Seasonal variation of bird diversity in small wetlands in Hefei City
3.3 α多样性与环境因子的关系
基于AICc模型选择标准, 包含湿地面积、城市化指数、建筑面积比例和噪声在内的多变量模型是预测小微湿地水鸟物种丰富度期望值的最佳模型(ΔAICc = 0, R2 = 0.645), 而包含面积、城市化指数、植被面积比例的模型是影响陆地鸟类物种丰富度的最佳模型(ΔAICc = 0, R2 = 0.723) (表1)。然而, 两个最佳模型的Akaike权重(wi)分别仅为0.2424和0.4607, 表明模型选择存在很大的不确定性。模型平均结果表明, 城市化指数(wi = 1, P < 0.01)、湿地面积(wi = 0.997, P < 0.001)和建筑面积比例(wi = 1, P = 0.0702)是影响水鸟物种丰富度的关键环境因子, 而湿地面积(wi = 1, P < 0.001)、城市化指数(wi = 0.959, P < 0.001)和植被面积比例(wi = 0.659, P < 0.001)是影响陆地鸟类物种丰富度的关键环境因子(表2)。模型选择结果表明影响小微湿地鸟类密度和Shannon-Wiener指数的最佳模型的Akaike权重(wi)均呈现较低值(表1), 模型平均结果表明城市化指数对水鸟Shannon-Wiener指数具有显著影响, 而湿地面积对陆地鸟类密度和Shannon-Wiener指数具有显著影响(表2)。此外, 鸟类Pielou均匀度指数与各环境因子无显著相关性。
表1 基于校正的赤池信息准则(AICc)的鸟类α多样性与环境因子模型选择结果
Table 1
| 生态类型 Ecological type | 多样性指数 Diversity index | 模型 Model | ΔAICc | 权重 Weight (wi) | 调整后的拟合值 Adjusted R2 |
|---|---|---|---|---|---|
| 水鸟 Waterbird | 物种丰富度 Species richness | 湿地面积 + 城市化指数 + 建筑面积比例 + 环境噪声 Wetland area + Urbanization index + PoC + EN | 0 | 0.2424 | 0.6450 |
| 湿地面积 + 城市化指数 + 环境噪声 Wetland area + Urbanization index + EN | 0.1706 | 0.2226 | 0.6030 | ||
| 湿地面积 + 城市化指数 + 建筑面积比例 + 环境噪声 + 植被面积 比例 Wetland area + Urbanization index + PoC + EN + PoV | 1.9774 | 0.0902 | 0.6420 | ||
| Shannon-Wiene指数 Shannon- Wiener index | 湿地面积 + 城市化指数 + 建筑面积比例 Wetland area + Urbanization index + PoC | 0 | 0.1560 | 0.4020 | |
| 湿地面积 + 城市化指数 Wetland area + Urbanization index | 0.2946 | 0.1346 | 0.4070 | ||
| 湿地面积 + 城市化指数 + 建筑面积比例 + 湿地形状 Wetland area + Urbanization index + PoC + Wetland shape | 1.6621 | 0.0679 | 0.4010 | ||
| 城市化指数 + 建筑面积比例 Urbanization index + PoC | 1.9055 | 0.0602 | 0.3560 | ||
| 陆地鸟类 Terrestrial bird | 物种丰富度 Species richness | 湿地面积 + 城市化指数 + 植被面积比例 Wetland area + Urbanization index + PoV | 0 | 0.4607 | 0.7230 |
| Shannon-Wiener指数 Shannon- Wiener index | 湿地面积 + 城市化指数 Wetland area + Urbanization index | 0 | 0.1834 | 0.2720 | |
| 湿地面积 + 城市化指数 + 植被面积比例 Wetland area + Urbanization index + PoV | 0.0460 | 0.1792 | 0.2940 | ||
| 物种密度 Species density | 湿地面积 + 城市化指数 + 建筑面积比例 + 植被面积比例 + 环境 噪声 + 湿地形状 Wetland area + Urbanization index + PoC + PoV + EN + Wetland shape | 0 | 0.0858 | 0.4970 | |
| 湿地面积 + 建筑面积比例 + 植被面积比例 + 湿地形状 Wetland area + PoC + PoV + Wetland shape | 0.1216 | 0.0807 | 0.4550 |
表中列出了ΔAICc < 2的模型。PoV: 植被面积比例; PoC: 建筑面积比例; EN: 环境噪声。
The table shows models with ΔAICc < 2. PoV, Proportion of vegetation area; PoC, Proportion of construction area; EN, Environmental noise.
表2 预测小微湿地鸟类α多样性95%置信区间内各参数的模型平均化估值(θ)、标准误(SE)和模型权重(wi)
Table 2
| 生态类型 Ecological type | 多样性指数 Diversity index | 环境因子 Environmental factors | 权重 Weight (wi) | 估计值 Estimate | 标准误 SE | P |
|---|---|---|---|---|---|---|
| 水鸟 Water bird | 物种丰富度 Species richness | 湿地面积 Wetland area | 0.9970 | 0.6582 | 0.1843 | <0.001 |
| 城市化指数 Urbanization index | 1.0000 | -0.0256 | 0.0079 | 0.001 | ||
| 建筑面积比例 Proportion of vegetation | 1.0000 | -8.8486 | 4.8863 | 0.0702 | ||
| Shannon-Wiener指数 Shannon-Wiener index | 城市化指数 Urbanization | 0.9990 | -0.0033 | 0.0015 | 0.0240 | |
| 陆地鸟类 Terrestrial bird | 物种丰富度 Species richness | 湿地面积 Wetland area | 1.0000 | 1.8941 | 0.2211 | <0.001 |
| 城市化指数 Urbanization index | 0.9590 | -0.0360 | 0.0084 | <0.001 | ||
| 植被面积比例 Proportion of vegetation | 0.6590 | 15.5060 | 4.1302 | <0.001 | ||
| Shannon-Wiener指数 Shannon-Wiener index | 湿地面积 Wetland area | 0.9770 | 0.0557 | 0.0181 | 0.0021 | |
| 物种密度 Species density | 湿地面积 Wetland area | 1.0000 | -72.7007 | 17.0724 | <0.001 |
选取与各关键环境因子拟合度较高的物种丰富度指数进行局部加权回归, 分析关键环境因子对小微湿地鸟类物种丰富度的影响趋势。结果显示(图3), 水鸟和陆地鸟类物种丰富度均与湿地面积呈正相关, 当面积在4 ha左右时, 水鸟的物种丰富度增加幅度较为缓慢。水鸟物种丰富度与城市化指数呈负相关, 而陆地鸟类物种丰富度随着城市化指数的增高呈现先上升后下降的趋势, 在中度城市化和低度城市化之间的小微湿地达到最高值。此外, 陆地鸟类物种丰富度与植被面积比例呈正相关, 而水鸟物种丰富度与建筑面积比例呈负相关。
图3
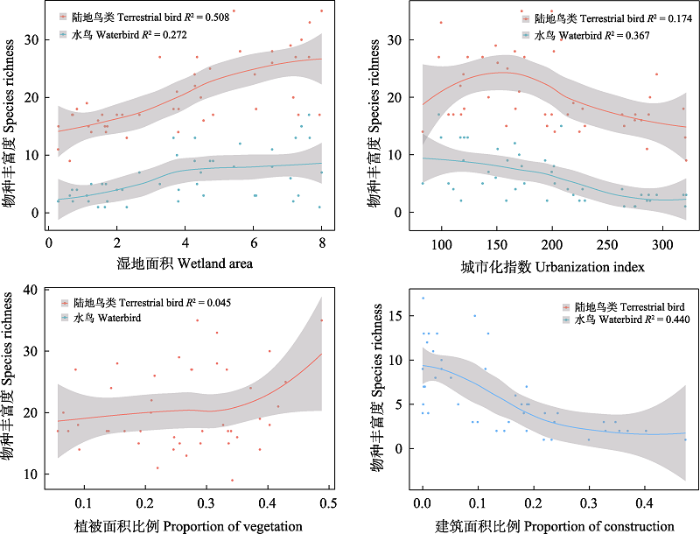
图3
物种丰富度与关键环境因子的非线性回归。灰色区域表示拟合线的置信区间。
Fig. 3
Non-linear regression between species richness and key environmental factors. The gray area stands for the confidential intervals for the fitted lines.
3.4 β多样性各组分占比及其与环境因子的关系
多点相异性指数计算结果显示, 小微湿地鸟类群落总体β多样性(βSOR)为0.960, 空间周转组分(βSIM)为0.950, 嵌套组分(βSNE)为0.010, 因此βratio < 0.5, 表示小微湿地鸟类群落的多样性主要由物种空间周转决定。
基于相异度矩阵或距离矩阵的多重回归模型结果显示(表3), 湿地面积差异、城市化指数差异和建筑面积比例差异是影响小微湿地鸟类群落β多样性及其组分的主要环境因子。其中, 水鸟β多样性(βsor)与湿地面积差异、城市化指数差异和建筑面积比例差异均呈显著正相关, 物种周转(βsim)与湿地面积差异呈负相关, 物种嵌套(βsne)与湿地面积差异和城市化指数差异呈正相关。陆地鸟类β多样性(βsor)与湿地面积差异、城市化指数差异均呈显著正相关, 物种周转(βsim)与湿地面积差异呈显著负相关, 物种嵌套(βsne)与湿地面积差异和城市化指数差异呈正相关。
表3 基于相异度矩阵或距离矩阵的多重回归模型的鸟类群落β多样性及组分与关键环境因子的关系
Table 3
| 生态类型 Ecological type | 环境因子 Environmental factors | 多样性指数 Diversity index | 斜率 Slope (a) | 截距 Intercept (b) | 相关系数 Correlation index (r) | P |
|---|---|---|---|---|---|---|
| 水鸟 Waterbird | 湿地面积差异 Difference in wetland area | βsor | 0.0130 | 0.5240 | 0.1386 | 0.0029 |
| βsim | -0.0132 | 0.2748 | 0.1044 | 0.0278 | ||
| βsne | 0.0261 | 0.2492 | 0.2100 | <0.001 | ||
| 城市化指数差异 Difference in urbanization index | βsor | 0.0008 | 0.4972 | 0.2392 | <0.001 | |
| βsne | 0.0013 | 0.2211 | 0.2897 | <0.001 | ||
| 建筑面积比例差异 Difference in PoC | βsor | 0.5555 | 0.4803 | 0.3239 | <0.001 | |
| βsne | 0.8189 | 0.2050 | 0.3590 | <0.001 | ||
| 陆地鸟类 Terrestrial bird | 湿地面积差异 Difference in wetland area | βsor | 0.0093 | 0.3429 | 0.2032 | <0.001 |
| βsim | -0.0143 | 0.2729 | 0.2581 | <0.001 | ||
| βsne | 0.0235 | 0.0700 | 0.4303 | <0.001 | ||
| 城市化指数差异 Difference in urbanization | βsor | 0.0002 | 0.3521 | 0.1349 | 0.0210 | |
| βsne | 0.0003 | 0.1156 | 0.1439 | 0.0068 | ||
| 建筑面积比例差异 Difference in PoC | βsne | 0.1586 | 0.1150 | 0.1584 | 0.0119 |
βsor: β多样性; βsim: 物种周转; βsne: 物种嵌套; PoC: 建筑面积比例。
βsor, β diversity; βsim, Species turnover; βsne, Species nestedness; PoC, Proportion of construction.
4 讨论
4.1 小微湿地鸟类群落季节动态变化特征
合肥市小微湿地鸟类群落季节差异程度较高。水鸟和陆地鸟类物种丰富度、密度均在冬季最高, 这是由于合肥市位于东亚-澳大利亚候鸟迁徙路沿线上, 有大量冬候鸟在此停歇。同时, 冬季湿地水位下降, 泥滩面积增大, 为鸟类提供了更多的食物资源, 从而导致冬季鸟类物种丰富度以及密度大幅提高(Zhou et al, 2020)。此外, 由于冬季有部分陆地鸟类如灰椋鸟(Sturnus cineraceus)、丝光椋鸟(S. sericeus)等大量集群, 因此陆地鸟类冬季Shannon- Wiener指数和均匀度指数较其他季节明显偏低。而冬季水鸟种类较多且分布均匀, 因此均匀度指数呈现较高水平。夏季陆地鸟类物种丰富度和密度同样处于较高水平。这是因为夏候鸟数量增加, 同时夏季小微湿地内树木冠层密度大, 可以为不同类群的陆地鸟类提供丰富的食物资源和繁殖场所(Alonso et al, 2009)。然而, 以冬候鸟为主的水鸟在夏季已完全迁离, 因此夏季水鸟物种丰富度较其他季节明显偏低。此外, 小微湿地内存在数量较大的灰翅浮鸥(Chlidonias hybrida)、池鹭(Ardeola bacchus)、黑水鸡(Gallinula chloropus)等鸟类, 使得夏季水鸟密度仅次于冬季。随着大部分候鸟的迁离, 小微湿地内鸟类物种数和个体数量在春季和秋季大幅下降。研究显示, 陆地鸟类均匀度指数在春秋两季明显高于冬夏两季, 而水鸟均匀度指数则表现为春秋季节明显低于冬夏两季。这是由于春秋季节鸟类种数较少, 同时陆地鸟类在该季节集群现象较低, 因此均匀度指数较高。而水鸟中黑水鸡、小䴙䴘(Tachybaptus ruficollis)等留鸟在其他水鸟数量明显降低的情况下仍旧保持较大数量, 使得均匀度指数明显偏低。
4.2 小微湿地鸟类多样性影响因素
4.2.1 湿地面积效应
尽管本研究中小微湿地面积整体较小, 但湿地面积仍是影响鸟类多样性的重要环境因子, 对小微湿地陆地鸟类和水鸟均具有重要影响。研究结果显示鸟类物种丰富度随小微湿地面积增大而增大, 这与早期的“物种-面积关系” (species-area relationship)理论相一致(Boecklen & Gotelli, 1984)。在城市环境下, 小微湿地面积与其生态承载力呈显著正相关, 面积较大的小微湿地可以为鸟类提供更多的栖息地类型和食物资源, 从而建立一个更为丰富而稳定的集合群落(Froneman et al, 2001; Yang et al, 2020)。因此在城市建设和规划过程中, 应充分利用城市破碎化的剩余可用空间建设较大面积的小微湿地。小微湿地的面积对于陆地和水鸟物种多样性的影响稍有不同, 虽然随着小微湿地面积的增加, 物种丰富度都呈现增加趋势, 但当面积接近4 ha时, 水鸟的物种丰富度增加幅度较为缓慢, 因此着眼于水鸟保护的小微湿地, 应尽量使其面积扩大到4 ha以上。此外, 人类活动的扩张导致生境连续性的湿地逐渐破碎化, 形成了众多栖息地岛屿化的小微湿地。部分对栖息地面积比较敏感的物种在面积较小的小微湿地中首先消失, 而在面积较大的小微湿地中仍保留了这些物种种群。因此当湿地面积差异增大时, 小微湿地间物种差异增大, β多样性指数也随之增加。本研究中部分国家级或省级保护物种如燕隼、小鸦鹃、红头潜鸭等, 仅在面积较大的小微湿地中出现, 而在面积较小的小微湿地中分布的鸟类物种如白头鹎(Pycnonotus sinensis)、喜鹊(Pica pica)、乌鸫(Turdus merula)等在面积较大的小微湿地中也均有出现。因此, 面积较小的小微湿地的物种组成表现为面积较大的小微湿地物种的子集, 从而形成嵌套格局。当小微湿地面积差异较小时, 各小微湿地内不同的生境配置可以吸引不同种类的鸟类群落, 使得面积相近的小微湿地拥有各自的特有物种, 因此物种空间周转组分随之增长。
4.2.2 城市化效应
在不同的城市化水平上, 城市化指数较低的小微湿地物种丰富度较高, 相比城市化指数较高的小微湿地吸引了更多水鸟在此停歇, 其中以鸻鹬类和雁鸭类为主。这是由于城市化指数较高的小微湿地生境单一且受干扰强度大, 加上食物资源匮乏导致大量难以适应城市环境的鸟类在城市中逐渐消失, 因此形成了低城市化指数小微湿地向高城市化指数小微湿地的物种嵌套。同时物种相异度随着城市化指数差异的增大而提高, 从而导致了β多样性指数的变化。值得注意的是, 中、低度城市化小微湿地尽管城市化水平相对较高, 但其陆地鸟类丰富度明显高于其他小微湿地, 且在区域内仍发现大量斑嘴鸭、白骨顶(Fulica atra)、苍鹭(Ardea cinerea)等水鸟存在。这可能是由于城区缺乏足够的栖息地, 大量鸟类向城市边缘分布, 使得城郊小微湿地鸟类物种丰富度增高(Pal et al, 2019), 因此中、低度城市化程度的小微湿地对城市鸟类具有重要的生态价值。此外, 城市化指数较高的小微湿地尽管鸟类丰富度较低, 但作为城市适应型鸟类的栖息地其利用率很高(Schütz & Schulze, 2015), 使得城市化指数高的小微湿地内陆地鸟类丰富度仍旧呈现较高水平。因此城市化指数较高的小微湿地同样具有重要的保护意义。
4.2.3 植被面积比例与建筑面积比例的影响
植被面积比例较高的小微湿地由于拥有更多的林地及灌木丛生境, 其丰富的垂直结构为陆地鸟类提供了更多的隐蔽空间, 吸引了包括大山雀(Parus major)、黄腹山雀(P. venustulus)、黑尾蜡嘴雀(Eophona migratoria)等在内的大量小型的雀形目鸟类。大面积林地中拥有更多样的植物组成, 提高了湿地的生境异质性, 可满足不同鸟类对于栖息环境的需求(Zhou & Chu, 2012; 赵伊琳等, 2021), 也为陆地鸟类提供了更加多样的栖息空间。此外, 水生植被较多的小微湿地可以吸引更多的水鸟, 使得即使面积仅为2 ha的小微湿地仍旧存在大量池鹭、黑水鸡、小䴙䴘等水鸟。小微湿地内建筑面积比例的增加减少了天然的微生境致使部分鸟类物种难以存活。同时具有较高的建筑面积比例的小微湿地带来了更高的客流量, 也会导致大量鸟类迁离。水鸟对建筑面积较多的小微湿地更为敏感, 在对研究区域进行全年调查后发现部分建筑面积比例较高的仅存在1种水鸟, 只有八哥(Acridotheres cristatellus)、喜鹊、灰喜鹊等杂食性鸟类更倾向于建筑面积比例更高的小微湿地。
5 结论
本研究结果显示, 湿地面积和城市化指数对小微湿地陆地鸟类和水鸟的α多样性和β多样性及组分均有显著影响, 陆地鸟类丰富度在中、低度城市化之间的小微湿地中达到最高值。而植被面积比例对陆地鸟类多样性具有较强的影响, 建筑面积比例对水鸟多样性具有显著影响。因此, 在城市建设和规划过程中应保留城市中面积较大的小微湿地, 着眼于水鸟保护的小微湿地, 尽量使其面积扩大到 4 ha以上。同时注意加强不同城市化梯度的小微湿地建设, 重点加强中、低度城市化之间的小微湿地的保护和建设。此外, 在小微湿地管理和建设过程中应保留和增加湿地内天然植被面积, 同时减少湿地内人工建筑物, 使得不同面积的小微湿地均可以拥有较高的鸟类多样性。最后, 本研究中各小微湿地间鸟类群落的组成差异主要由物种周转所导致, 因此各小微湿地均具有潜在的保护价值, 应对各小微湿地加强整体保护。
附录 Supplementary Material
附录1 合肥市小微湿地环境参数
Appendix 1 Environmental parameters of small wetlands in Hefei City
附录2 环境因子的Pearson相关性(r)分析结果
Appendix 2 Pearson correlations coefficients (r) among seven environmental factors
附录3 合肥市小微湿地鸟类多样性参数
Appendix 3 Parameters of bird diversity in small wetlands in Hefei City
附录4 合肥市小微湿地鸟类名录
Appendix 4 Bird list of small wetlands in Hefei City
参考文献
Post-breeding migration in male great bustards: Low tolerance of the heaviest Palaearctic bird to summer heat
DOI:10.1007/s00265-009-0783-9 URL [本文引用: 1]
Suggestions for presenting the results of data analyses
Navigating the multiple meanings of β diversity: A roadmap for the practicing ecologist
DOI:10.1111/j.1461-0248.2010.01552.x
PMID:21070562
[本文引用: 1]

A recent increase in studies of β diversity has yielded a confusing array of concepts, measures and methods. Here, we provide a roadmap of the most widely used and ecologically relevant approaches for analysis through a series of mission statements. We distinguish two types of β diversity: directional turnover along a gradient vs. non-directional variation. Different measures emphasize different properties of ecological data. Such properties include the degree of emphasis on presence/absence vs. relative abundance information and the inclusion vs. exclusion of joint absences. Judicious use of multiple measures in concert can uncover the underlying nature of patterns in β diversity for a given dataset. A case study of Indonesian coral assemblages shows the utility of a multi-faceted approach. We advocate careful consideration of relevant questions, matched by appropriate analyses. The rigorous application of null models will also help to reveal potential processes driving observed patterns in β diversity.© 2010 Blackwell Publishing Ltd/CNRS.
Partitioning the turnover and nestedness components of beta diversity
DOI:10.1111/j.1466-8238.2009.00490.x URL [本文引用: 3]
Non-linearities in bird responses across urbanization gradients: A meta-analysis
DOI:10.1111/gcb.13964
PMID:29080260
[本文引用: 1]
Urbanization is one of the most extreme forms of environmental alteration, posing a major threat to biodiversity. We studied the effects of urbanization on avian communities via a systematic review using hierarchical and categorical meta-analyses. Altogether, we found 42 observations from 37 case studies for species richness and 23 observations from 20 case studies for abundance. Urbanization had an overall strong negative effect on bird species richness, whereas abundance increased marginally with urbanization. There was no evidence that city size played a role in influencing the relationship between urbanization and either species richness or abundance. Studies that examined long gradients (i.e. from urban to rural) were more likely to detect negative urbanization effects on species richness than studies that considered short gradients (i.e. urban vs. suburban or urban vs. rural areas). In contrast, we found little evidence that the effect of urbanization on abundance was influenced by gradient length. Effects of urbanization on species richness were more negative for studies including public green spaces (parks and other amenity areas) in the sampled landscapes. In contrast, studies performed solely in the urban matrix (i.e. no green spaces) revealed a strong positive effect on bird abundance. When performing subset analyses on urban-suburban, suburban-rural and suburban-natural comparisons, species richness decreased from natural to urban areas, but with a stronger decrease at the urban-suburban interface, whereas bird abundance showed a clear intermediate peak along the urban-rural gradient although abundance in natural areas was comparable to that in suburban areas. This suggests that species loss happens especially at the urban-suburban interface, and that the highest abundances occur in suburban areas compared to urban or rural areas. Thus, our study shows the importance of suburban areas, where the majority of birds occur with fairly high species richness.© 2017 John Wiley & Sons Ltd.
Ecosystem services delivered by small-scale wetlands
DOI:10.1080/02626667.2011.630317 URL [本文引用: 1]
Island biogeographic theory and conservation practice: Species-area or specious-area relationships?
DOI:10.1016/0006-3207(84)90014-4 URL [本文引用: 1]
Birds biodiversity in urban and periurban forests: Environmental determinants at local and landscape scales
DOI:10.1007/s11252-018-0757-7 URL [本文引用: 1]
Urban effects on native avifauna: A review
DOI:10.1016/j.landurbplan.2004.08.007 URL [本文引用: 1]
Effects of area size, heterogeneity, isolation, and disturbances on urban park avifauna in a highly populated tropical city
DOI:10.1007/s11252-015-0481-5 URL [本文引用: 2]
Spatial distribution and beta diversity of forest communities in mountainous areas of the West Lake in Hangzhou, East China
西湖风景名胜区不同类型森林群落的空间分布及β多样性
Impacts of urbanization on the wetland waterbird communities in Hangzhou
城市化对杭州市湿地水鸟群落的影响研究
The richness of island habitat avian communities and their influencing factors
岛屿栖息地鸟类群落的丰富度及其影响因子
Review on small wetlands: Definition, typology and ecological services
小微湿地研究综述: 定义、类型及生态系统服务
Urban bird community composition influenced by size of urban green spaces, presence of native forest, and urbanization
DOI:10.1007/s11252-017-0706-x URL [本文引用: 1]
The effect of fragment shape and species’ sensitivity to habitat edges on animal population size
DOI:10.1111/j.1523-1739.2007.00720.x URL [本文引用: 1]
Waterbird assemblages and associated habitat characteristics of farm ponds in the Western Cape, South Africa
DOI:10.1023/A:1008904421948 URL [本文引用: 1]
Model selection and multimodel inference: A practical information- theoretic approach
The influence of small urban parks characteristics on bird diversity: A case study of Petaling Jaya, Malaysia
DOI:10.1007/s11252-016-0584-7 URL [本文引用: 1]
The effect of urbanization on the functional and scale-sensitive diversity of bird assemblages in Central India
DOI:10.1017/S0266467418000317 URL [本文引用: 1]
The role of urban and agricultural areas during avian migration: An assessment of within-year temporal turnover
DOI:10.1111/geb.12199 URL [本文引用: 1]
Urbanization and the temporal homogenization of bird communities: A case study in central Argentina
DOI:10.1007/s11252-015-0469-1 URL [本文引用: 1]
Does urbanization affect the seasonal dynamics of bird communities in urban parks
DOI:10.1007/s11252-016-0525-5 URL [本文引用: 2]
Influence of habitat characteristics of urban parks on bird community: A case study of Shanghai
城市公园栖息地特征对鸟类群落的影响: 以上海市为例
Social-economic-natural complex ecosystem
社会-经济-自然复合生态系统
Island biogeography for an urbanizing world: How extinction and colonization may determine biological diversity in human-dominated landscapes
DOI:10.1007/s11252-005-4378-6 URL [本文引用: 1]
Latitude- enhanced species-area relationships for conservation planning
DOI:10.1007/s10980-019-00863-2
[本文引用: 1]
Context Species-area relationship models are useful in conservation planning; however these models could be strengthened with the addition of a latitudinal factor. Objectives We built latitude-enhanced species-area relationship models to predict species richness for a variety of common taxa in the eastern United States at local to regional scales. Methods We used data from complete surveys of East Coast parks in the United States to build latitude-enhanced species-area relationship models for amphibians, birds, freshwater fish, mammals, marine fish, plants, and reptiles. We used data from the published literature and United States Fish and Wildlife Refuges to independently test the accuracy of the models. We demonstrated the utility of all modeled taxa within selected East Coast Protected Areas of the United States. Results Our models explained 35-91% of the variation in surveyed species richness, with marine fish, freshwater fish and reptile models exhibiting the strongest relationships (pseudo-R-2 = 0.91, 0.66, and 0.70, respectively). Latitude had the strongest influence in the amphibian model. During accuracy testing, all taxa exhibited significant agreement between observed and predicted species richness and explained 75-97% of the variation. Our demonstration showed that for two similarly sized US Protected Areas, the parcel l.25 degrees lower in latitude would likely have one more bird species, four more plant species, and an additional amphibian species. Conclusions The latitude term added value to the species-area relationship models for most taxa and proved useful for conservation and urban planning in local to regional sized areas of the East Coast of the United States.
The value of small, natural and man-made wetlands for bird diversity in the east Colombian Piedmont
DOI:10.1002/aqc.2835 URL [本文引用: 1]
Species richness in urban parks and its drivers: A review of empirical evidence
DOI:10.1007/s11252-013-0316-1 URL [本文引用: 1]
Diversity and structure of bird assemblages along urban-rural gradient in Kolkata, India
Influence of environmental factors on bird diversity in greenspaces in an Amazonian City
DOI:10.1007/s11252-020-01042-x URL [本文引用: 2]
Functional diversity of urban bird communities: Effects of landscape composition, green space area and vegetation cover
DOI:10.1002/ece3.1778 URL [本文引用: 1]
Beta-diversity partitioning: Methods, applications and perspectives
DOI:10.17520/biods.2017024 URL [本文引用: 1]
Beta多样性分解: 方法、应用与展望
DOI:10.17520/biods.2017024
[本文引用: 1]
Beta多样性是指不同群落间物种组成的差异, 由物种周转(或物种替换)和嵌套(或丰富度差异)这两种过程决定。Beta多样性分解是将这两种过程对总体beta多样性的作用进行拆分, 然后分别探讨这两种过程对群落间物种组成差异的影响。2010年之后, 人们提出了beta多样性分解的方法, 其中占据主导地位的是由Andrés Baselga于2010年提出的BAS法(总体beta多样性分解为物种周转和嵌套组分)和由János Podani和Dénes Schmera于2011年以及José C. Carvalho等于2012年提出的POD法(总体beta多样性分解为物种替换和丰富度差异组分)。这两种分解方法引起了持续的争论, 促进了该领域的快速发展。作者归纳分析了2010年后有关beta多样性分解的文献后发现, 使用BAS法的论文无论在发表量和引用次数上都多于POD法(75% vs. 20%)。Beta多样性分解的研究主要集中在欧洲(45%), 研究类群则以动物(64%)为主。本文在回顾beta多样性分解方法的提出及其发展过程的基础上, 从时空维度(纬度梯度、海拔梯度、生境片断化过程以及季节和年际动态)、多样性的不同方面(物种、功能和谱系多样性)和不同生物类群之间的比较等研究角度出发, 进一步阐述了beta多样性分解方法在探讨生物多样性分布格局以及形成机制中的应用。对于beta多样性分解的研究, 我们认为需要深入探讨的问题有: (1) beta多样性分解方法的比较分析和整合; (2)结合物种多度信息探讨beta多样性及其组分的分布格局; (3)对大尺度下beta多样性分解的结果进行普适性验证。
Are small greening areas enhancing bird diversity? Insights from community-driven greening projects in Boston
Beta diversity of plant communities in Baishanzu Nature Reserve
DOI:10.5846/stxb201207010920 URL [本文引用: 1]
百山祖自然保护区植物群落beta多样性
Factors responsible for forest and water bird distributions in rivers and lakes along an urban gradient in Beijing
DOI:10.1016/j.scitotenv.2020.139308 URL [本文引用: 1]
The influence of urban park characteristics on bird diversity in Nanjing, China
DOI:10.1186/s40657-020-00234-5 URL [本文引用: 3]
Conservation and management of small and micro wetlands
小微湿地的保护与管理
Changes of bird community under urbanization and its relationship with urban vegetation
DOI:10.1016/j.chnaes.2021.07.010 URL [本文引用: 1]
城市化鸟类群落变化及其与城市植被的关系
How would size, age, human disturbance, and vegetation structure affect bird communities of urban parks in different seasons
DOI:10.1007/s10336-012-0839-x URL [本文引用: 3]
Diversity of wintering waterbirds enhanced by restoring aquatic vegetation at Shengjin Lake, China
DOI:10.1016/j.scitotenv.2020.140190 URL [本文引用: 3]
