


海拔梯度综合了多种环境因子(如温度、降水、光照等)的梯度效应(Gaston, 2000; 唐志尧和方精云, 2004), 是影响物种组成、生物群落构建和多样性空间格局的重要因素(Sundqvist et al, 2013; 卢孟孟等, 2014)。物种多样性的海拔格局研究有助于揭示全球生物多样性现状及其维持和变化机制(李巧燕和王襄平, 2013; Laiolo et al, 2018)。作用于不同空间尺度(例如局部和区域)的多重生态学过程和空间距离等因素, 共同决定了物种沿海拔梯度的分布特征(Laiolo et al, 2017), 物种多样性海拔格局因此可能存在空间尺度依赖性(Rahbek, 2005)。分类多样性和功能多样性是物种多样性的重要组成: 分类多样性是基本组成, 描述群落物种组成、结构和多样性特征(宋普庆等, 2015); 功能多样性基于功能性状描述群落组成物种对生态过程的需求和响应及其生态功能等特征(Villéger et al, 2010)。已有研究对物种多样性海拔格局的空间尺度依赖性仍旧缺乏深入的认识; 同时探索分类多样性和功能多样性沿海拔梯度分布的空间尺度差异性, 对全面理解物种多样性的海拔格局具有重要价值。
水生昆虫是河流生态系统具有重要生态功能的组成类群(Covich et al, 1999; Mermillod-Blondin, 2011), 对自然环境和人类干扰梯度的响应敏感(Dohet et al, 2015), 可综合反映时空尺度环境作用下水生态系统的动态变化。已有研究发现, 水生昆虫分类多样性海拔格局在局部和区域尺度主要符合单峰模型(Füreder et al, 2006; Wang et al, 2011; de Mendoza et al, 2017)和单调递减(Jacobsen, 2004; Castro et al, 2019)分布, Jacobsen (2004)发现溪流无脊椎动物丰富度沿海拔降低的分布格局呈现局部和区域尺度差异性。目前仅有部分研究探索了水生昆虫功能多样性的海拔格局, 如Lafferty①(①Lafferty MH (2018) Changes in Taxonomic and Functional Diversity of Aquatic Macroinvertebrates Along a Gradient of Stream Size and Flow Stability in the Northeastern Colorado Rocky Mountains. Master thesis, Colorado State University, Colorado.)发现落基山脉水生昆虫功能丰富度与沿海拔梯度变化的溪流大小和流量稳定性呈正相关关系。当前依旧缺乏对水生昆虫分类多样性和功能多样性海拔格局的局部和区域尺度空间差异的探索研究。
1 材料与方法
1.1 研究区域概况
澜沧江流域云南段由北向南从迪庆藏族自治州至西双版纳勐腊县出境口, 全长910 km (冯建孟等, 2012), 海拔高差超过6,500 m (胡波等, 2006), 澜沧江河谷海拔1,200-2,000 m (杨阳等, 2016)。流域地表形态复杂且特殊, 相对高差显著, 生物多样性丰富(王川等, 2013)。该流域纵跨热带、亚热带和大陆性高寒气候带, 气温和降水随海拔升高均表现出下降趋势(何云玲和张一平, 2004)。流域由北至南土地利用垂直分带明显, 上游地区人口较少, 主要以林地灌木为主; 中下游人口密集, 主要以耕地和人工经济林为主(姜昀等, 2006)。
参照Jacobsen (2004)的方法, 沿海拔梯度在2-4级溪流分别采集56、53和40个样点, 共149个溪流样点(图1)。于2013年3月、2016年3月和10月、2018年10月雨季前后的水文平稳期共进行4次野外样品采集, 所有采样点位海拔范围介于500-3,900 m, 采样点位覆盖研究区域的典型气候特征和土地利用类型。方差分析结果表明, 除水温外, 不同溪流等级采样点位的海拔、土地利用、底质组成及其他环境变量均无显著性差异(表1)。
图1
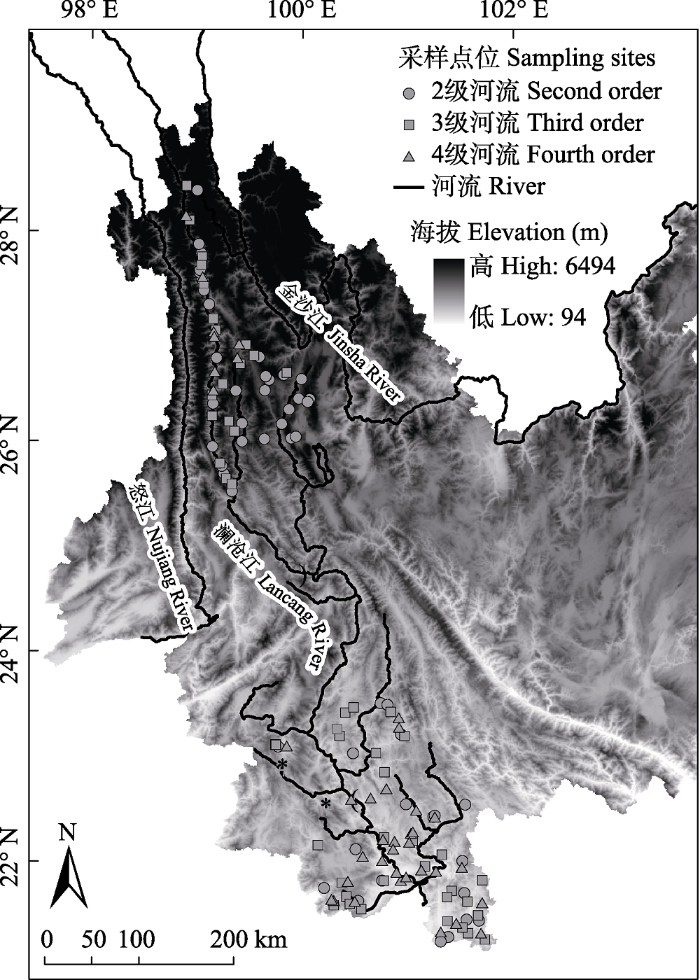
图1
澜沧江流域云南段溪流采样点位分布图
Fig. 1
Locations of sampling sites in the Lancang River in Yunnan Province, China
表1 不同溪流等级采样点位环境因子概况
Table 1
| 环境变量 Environmental variables | 2级 Second order | 3级 Third order | 4级 Fourth order | |||
|---|---|---|---|---|---|---|
| 平均值 ± 标准差 Mean ± SD | 范围 Range | 平均值 ± 标准差 Mean ± SD | 范围 Range | 平均值 ± 标准差 Mean ± SD | 范围 Range | |
| 海拔 Elevation (m) | 1,392 ± 719 | 528-3,146 | 1,451 ± 721 | 502-3,935 | 1,311 ± 569 | 595-2,899 |
| 水温 Water temperature (℃)* | 15.46 ± 4.69 | 1.10-26.10 | 16.63 ± 5.05 | 6.80-28.00 | 19.33 ± 4.30 | 10.30-26.00 |
| 泥沙含量百分比 Percent of sand (%) | 8.61 ± 16.20 | 0.00-100.00 | 7.62 ± 10.79 | 0.00-60.00 | 14.09 ± 16.69 | 0.00-70.00 |
| 碎石含量百分比 Percent of gravel (%) | 32.49 ± 24.41 | 0.00-100.00 | 30.15 ± 20.38 | 5.08-87.93 | 36.71 ± 18.25 | 2.78-85.00 |
| 鹅卵石含量百分比 Percent of cobbles (%) | 42.82 ± 21.40 | 0.00-81.82 | 45.52 ± 17.98 | 0.00-72.37 | 39.10 ± 19.30 | 0.00-68.06 |
| 大石块含量百分比 Percent of boulders (%) | 16.08 ± 14.53 | 0.00-55.00 | 16.71 ± 14.25 | 0.00-60.00 | 10.10 ± 11.17 | 0.00-45.71 |
| 农业用地占比 Percent of agricultural land (%) | 1.61 ± 4.73 | 0.00-32.01 | 0.91 ± 1.51 | 0.00-8.44 | 3.11 ± 3.49 | 0.02-15.90 |
| 森林用地占比 Percent of forest land (%) | 82.32 ± 17.73 | 21.58-100.00 | 85.89 ± 12.33 | 41.38-100.00 | 83.77 ± 11.27 | 54.20-96.86 |
* P < 0.05.
1.2 水生昆虫的采集与鉴定
根据多生境采样原则, 在100 m长的溪流河段内根据栖境类型的出现比例分配样方数, 使用D型网(直径30 cm、60目孔径)采集水生昆虫(Hughes & Peck, 2008)。每个样点共采集8-10个样方, 混合成为1个样点样本后, 使用60目分样筛筛洗, 加入分析纯乙醇溶液固定。实验室内挑拣、鉴定和计数水生昆虫所有个体, 根据已有可靠的形态学资料鉴定至可能的最低分类单元, 通常为属级; 其中, 仅鞘翅目、半翅目和双翅目的部分类群鉴定至科级。
1.3 数据分析
1.3.1 空间尺度
首先从中国科学院国际科学数据服务平台(
1.3.2 多样性指数计算
分别计算局部和区域尺度水生昆虫群落的分类多样性和功能多样性指数, 然后对多样性指数的海拔格局进行分析。点位多样性指数即为局部尺度多样性指数; 综合每个海拔段所有点位的水生昆虫组成为海拔段物种组成, 计算区域尺度多样性指数。
(1)分类多样性指数
分类多样性指数基于群落分类特征测定群落分类组成和结构。采用物种丰富度指数(S)、Simpson多样性指数(D)和物种均匀度指数(J)综合表征局部和区域尺度的群落分类多样性特征。物种丰富度指数即群落内记录的物种总数; Simpson多样性指数(Simpson, 1949)和物种均匀度指数(Pielou, 1966)计算公式如下:
式中, S为水生昆虫物种数, Ni为第i个物种的个体数, N为水生昆虫个体总数。
(2)功能多样性指数
选择外骨骼保护状况、体型、呼吸方式、营养习性、亲流性、生活习性和个体大小共7个对环境变化响应敏感的连续型和离散型生物性状(Ding et al, 2017; 李胜利等, 2018)。参照Colzani等(2013)使用离散数字1、2、3……对每个性状进行赋值, 将所有性状划分为共25个离散类别(表2), 用于功能多样性指数计算。所有生物学性状及其赋值主要从已发表文献资料获取(Morse et al, 1994; Usseglio-Polatera et al, 2000; Poff et al, 2006; Ding et al, 2017)。
表2 水生昆虫功能性状类别及其赋值
Table 2
| 性状类别 Trait state | 赋值 Score |
|---|---|
| 外骨骼保护状况 Exoskeleton or external protection | |
| 虫体柔软 Soft-bodied forms | 1 |
| 轻微骨化 Lightly sclerotized | 2 |
| 骨化良好 Heavily sclerotized | 3 |
| 体型 Body shape | |
| 流线型 Streamlined | 1 |
| 非流线型 Not streamlined | 2 |
| 呼吸方式 Respiration | |
| 体壁呼吸 Tegument | 1 |
| 鳃呼吸 Gills | 2 |
| 气氧呼吸(呼吸管、气泡、气盾) Air (spiracles, tracheae, plastrons) | 3 |
| 营养习性 Trophic habit | |
| 集食者 Collector-gatherer | 1 |
| 滤食者 Collector-filterer | 2 |
| 刮食者 Scraper | 3 |
| 捕食者 Predator | 4 |
| 撕食者 Shredder | 5 |
| 亲流性 Rheophily | |
| 沉积型 Only depositional | 1 |
| 沉积型和冲刷型 Depositional and erosional | 2 |
| 冲刷型 Erosional | 3 |
| 生活习性 Habit | |
| 掘穴者 Burrowers | 1 |
| 攀爬者 Climbers | 2 |
| 匍匐者 Sprawlers | 3 |
| 附着者 Clingers | 4 |
| 游泳者 Swimmers | 5 |
| 滑行者 Skaters | 6 |
| 个体大小 Body size | |
| 小 Small (< 9 mm) | 1 |
| 中等 Medium (9-16 mm) | 2 |
| 大 Large (> 16 mm) | 3 |
功能多样性指数表征群落物种功能性状组成和结构特征(Villéger et al, 2008), 本文选用以下3个指数: (1)树状图功能多样性指数(dendrogram-based functional diversity, dbFD)。根据功能性状矩阵构建群落性状树状图, 树状图所有分支长度的总和即为dbFD指数; 该指数结合了物种丰富度、群落组成和功能性状数量(Petchey & Gaston, 2002), 通过估算物种在性状空间的分布, 衡量物种性状的互补程度(Petchey & Gaston, 2002), 与物种多度无关(González- Maya et al, 2016)。(2) Rao二次熵指数(Rao’s Quadratic,RaoQ)。RaoQ指数结合了物种相对多度和物种间的成对功能差异性, 表达两个随机选择个体间的性状平均差异性(Laliberté & Legendre, 2010); RaoQ指数可视为Simpson多样性指数在功能多样性维度的扩展(Shimatani, 2001), 当所有物种间无共享性状时, Simpson多样性指数值即代表了RaoQ指数能达到的最大值(de Bello et al, 2006)。(3)功能均匀度指数(functional evenness, FEve)。FEve指数测量了物种性状在性状空间的分布规律, 值越高意味着物种性状的分布越均匀(Mason et al, 2005); FEve指数与物种均匀度指数相似, 两者分别从功能性状和分类维度描述了物种分布规律。
1.3.3 多样性海拔格局分析
应用线性模型和二次回归模型拟合局部和区域尺度多样性指数的海拔梯度格局; 局部尺度海拔格局即点位多样性指数对点位海拔的响应, 区域尺度海拔格局即区域尺度多样性指数对区域海拔段中点的响应。选择赤池系数(Akaike’s Information Criterion, AICc)较小且F检验显著(P < 0.1)的模型为最佳拟合模型(Yamaoka et al, 1978; Mayor et al, 2017)。分析前使用广义线性模型(generalized linear models, GLM)拟合区域尺度多样性指数对海拔段采样点位数量、平均空间距离和平均纬度的响应, 综合分析区域海拔段采样强度和纬度梯度对生物多样性海拔格局的影响。其中, 采样点位数量即每个海拔段的采样点位数, 点位平均空间距离为海拔段内所有点位欧几里得距离(Euclidean distance)的平均值, 平均纬度为海拔段内所有点位的纬度平均值。使用Poisson分布拟合分类多样性指数, 使用高斯分布拟合功能多样性指数(Jyväsjärvi et al, 2018)。当GLM呈显著水平(P < 0.05)时, 说明海拔段间的采样点位数量、平均空间距离和平均纬度对多样性指数影响显著, 进一步计算多样性指数残差用于后续分析; 当GLM呈现非显著水平(P > 0.05)时, 说明以上因素对多样性指数无显著影响, 则使用原始多样性指数用于海拔格局分析。
采用R 3.6.1软件vegan功能包的diversity函数计算分类多样性指数, 通过FD功能包的dbFD函数计算功能多样性指数, 使用MuMIn功能包计算AICc值, 应用ggplot2程序包绘图。
2 结果
2.1 水生昆虫物种组成
共鉴定水生昆虫277个分类单元, 隶属10目102科; 其中, 双翅目(23科51分类单元)、鞘翅目(16科50分类单元)、毛翅目(20科48分类单元)、蜉蝣目(13科46分类单元)和蜻蜓目(12科46分类单元)为丰富度较高的优势类群, 分别占总分类单元数的18.4%、18.1%、17.3%、16.6%和16.6%。所有2-4级溪流水生昆虫群落结构间无显著差异(附录1)。
2.2 分类多样性指数的海拔分布格局
区域尺度下, 仅物种丰富度指数对海拔段间的采样点位数量、平均空间距离和平均纬度的响应关系显著(附录2)。所有分类多样性指数中, 仅Simpson多样性指数同时在局部和部分区域尺度呈现显著海拔分布特征, 所有分类多样性指数在不同区域尺度下沿海拔梯度分布存在一致性(表3, 图2)。物种丰富度指数在所有空间尺度均无显著的海拔分布特征, 海拔格局从局部尺度的弱“U”型, 变化为区域尺度下不显著单调递减趋势。Simpson多样性指数在局部和区域(除250 m海拔段)尺度沿海拔梯度变化均表现出“U”型趋势, 在中海拔部分局部尺度的指数值较低, 最低值出现在1,500-2,500 m海拔范围内; 随着空间尺度增大, Simpson多样性指数与海拔间的显著关系逐渐降低。物种均匀度指数在局部尺度下随海拔梯度的变化表现出显著单调递减趋势, 而区域尺度下均未表现出显著的变化趋势。
表3 不同空间尺度下水生昆虫群落多样性指数与海拔的线性和二次回归模型
Table 3
| 空间尺度 Spatial scale | 多样性指数 Diversity index | 线性模型 Linear model (L) | 二次回归模型 Quadratic model (Q) | 选择模型 Model selection | ||||
|---|---|---|---|---|---|---|---|---|
| 解释量 Adjusted R² | P | 赤池系数 AICc | 解释量 Adjusted R² | P | 赤池系数 AICc | |||
| 局部尺度 Local scale | ||||||||
| 物种丰富度指数 Species richness index | <0.001 | 0.418 | 1,218.2 | 0.01 | 0.166 | 1,217.2 | NS | |
| Simpson多样性指数 Simpson diversity index | 0.04 | 0.010 | -136.6 | 0.05 | 0.001 | -137.4 | Q | |
| 物种均匀度指数 Species evenness index | 0.06 | 0.001 | -152.6 | 0.07 | 0.002 | -152.0 | L | |
| 树状图功能多样性指数 Dendrogram-based functional diversity index (dbFD) | <0.001 | 0.633 | 364.0 | <0.001 | 0.477 | 364.7 | NS | |
| Rao二次熵指数 Rao’s Quadratic index (RaoQ) | 0.02 | 0.057 | -516.4 | 0.02 | 0.074 | -516.0 | L | |
| 功能均匀度指数 Functional evenness index (FEve) | 0.01 | 0.079 | -284.8 | 0.01 | 0.136 | -283.7 | L | |
| 区域尺度 Regional scale | ||||||||
| 100 m | 物种丰富度指数 Species richness index | <0.001 | 0.68 | 218.7 | <0.001 | 0.50 | 219.3 | NS |
| Simpson多样性指数 Simpson diversity index | 0.20 | 0.015 | -56.6 | 0.28 | 0.011 | -58.3 | Q | |
| 物种均匀度指数 Species evenness index | <0.001 | 0.450 | -53.2 | 0.01 | 0.355 | -52.9 | NS | |
| 树状图功能多样性指数 Dendrogram-based functional diversity index (dbFD) | 0.52 | <0.001 | 70.6 | 0.57 | <0.001 | 68.7 | Q | |
| Rao二次熵指数 Rao’s Quadratic index (RaoQ) | 0.10 | 0.064 | -120.5 | 0.24 | 0.020 | -123.6 | Q | |
| 功能均匀度指数 Functional evenness index (FEve) | 0.19 | 0.017 | -73.6 | 0.17 | 0.048 | -72.2 | L | |
| 150 m | 物种丰富度指数 Species richness index | <0.001 | 0.33 | 143.4 | <0.001 | 0.53 | 145.0 | NS |
| Simpson多样性指数 Simpson diversity index | 0.10 | 0.116 | -35.9 | 0.29 | 0.035 | -39.1 | Q | |
| 物种均匀度指数 Species evenness index | <0.001 | 0.512 | -40.0 | 0.16 | 0.112 | -42.8 | NS | |
| 树状图功能多样性指数 Dendrogram-based functional diversity index (dbFD) | 0.76 | <0.001 | 27.9 | 0.82 | <0.001 | 23.8 | Q | |
| Rao二次熵指数 Rao’s Quadratic index (RaoQ) | <0.001 | 0.351 | -82.0 | 0.20 | 0.081 | -85.1 | Q | |
| 功能均匀度指数 Functional evenness index (FEve) | 0.18 | 0.052 | -55.2 | 0.12 | 0.153 | -53.2 | L | |
| 200 m | 物种丰富度指数 Species richness index | <0.001 | 0.77 | 116.1 | <0.001 | 0.92 | 118.0 | NS |
| Simpson多样性指数 Simpson diversity index | 0.22 | 0.059 | -27.8 | 0.34 | 0.051 | -29.1 | Q | |
| 物种均匀度指数 Species evenness index | 0.02 | 0.285 | -30.2 | 0.14 | 0.191 | -31.1 | NS | |
| 树状图功能多样性指数 Dendrogram-based functional diversity index (dbFD) | 0.75 | <0.001 | 26.4 | 0.80 | <0.001 | 24.2 | Q | |
| Rao二次熵指数 Rao’s Quadratic index (RaoQ) | 0.06 | 0.208 | -62.9 | 0.22 | 0.114 | -64.5 | NS | |
| 功能均匀度指数 Functional evenness index (FEve) | 0.31 | 0.027 | -42.4 | 0.25 | 0.099 | -40.4 | L | |
| 250 m | 物种丰富度指数 Species richness index | <0.001 | 0.66 | 86.4 | <0.001 | 0.91 | 88.4 | NS |
| Simpson多样性指数 Simpson diversity index | <0.001 | 0.455 | -18.0 | 0.07 | 0.311 | -18.5 | NS | |
| 物种均匀度指数 Species evenness index | <0.001 | 0.964 | -21.1 | 0.02 | 0.381 | -21.7 | NS | |
| 树状图功能多样性指数 Dendrogram-based functional diversity index (dbFD) | 0.82 | <0.001 | 20.1 | 0.82 | <0.001 | 20.6 | L | |
| Rao二次熵指数 Rao’s Quadratic index (RaoQ) | <0.001 | 0.773 | -49.9 | 0.04 | 0.351 | -50.7 | NS | |
| 功能均匀度指数 Functional evenness index (FEve) | 0.26 | 0.062 | -35.8 | 0.19 | 0.181 | -33.9 | L | |
NS indicates non-significant model selected.
NS表示无显著解释模型。
图2
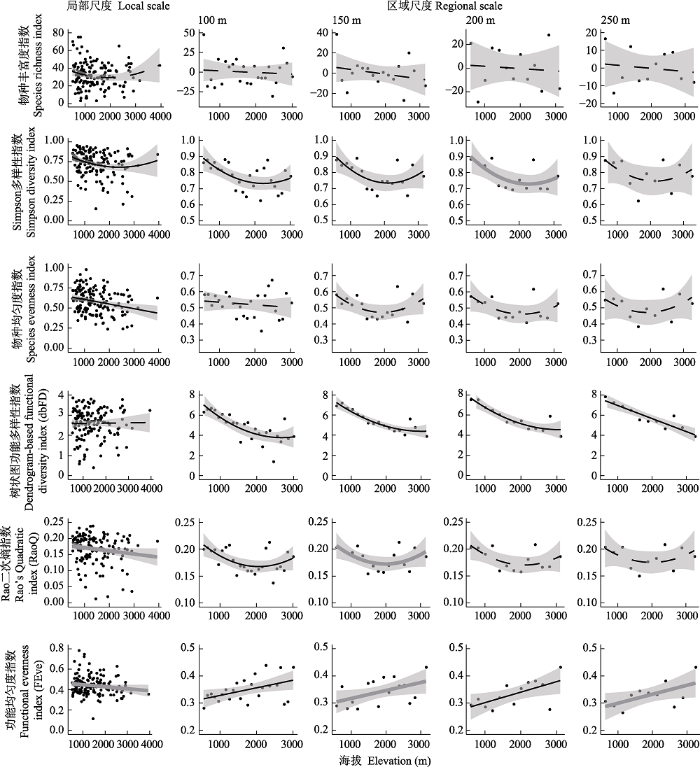
图2
局部尺度和区域尺度(100 m、150 m、200 m和250 m海拔段)水生昆虫群落分类多样性和功能多样性指数的海拔格局。黑色实线表示多样性指数对海拔梯度存在极显著(P < 0.01)和显著(P < 0.05)的线性或二次响应关系, 灰色实线表示轻微显著(P < 0.1)的线性或二次响应关系, 黑色虚线表示无显著(P > 0.1)的线性或二次响应关系。
Fig. 2
The relationship between taxonomic and functional diversity indices and elevation at local and regional (elevational band across 100 m, 150 m, 200 m, and 250 m) scales. Black solid line indicates highly significant (P < 0.01) and significant (P < 0.05) linear or quadratic relationships, grey solid line indicates marginally significant (P < 0.1) linear or quadratic relationships, and black dotted line indicates non-significant (P > 0.1) linear or quadratic relationships.
2.3 功能多样性指数海拔分布格局
区域尺度下, 所有功能多样性指数对海拔段采样点位数量、平均空间距离和平均纬度均无显著响应关系(附录2)。所有功能多样性指数的海拔格局在局部和区域尺度均存在差异性, 但所有功能多样性指数在区域尺度下沿海拔梯度分布存在一致性(表3, 图2)。局部尺度dbFD指数沿海拔梯度表现出不显著的单调递增趋势; 在区域尺度对海拔梯度变化存在显著响应关系, 随海拔带宽度的增加, 由近单调递减趋势的“U”型关系转变为单调递减的趋势。RaoQ指数沿海拔梯度由局部尺度的单调递减趋势, 变化为100 m和150 m海拔带区域尺度的显著“U”型趋势, 到200 m和250 m海拔带区域尺度的不显著“U”型趋势。FEve指数在所有空间尺度沿海拔梯度均呈现显著分布特征, 在局部尺度沿海拔梯度呈现单调递减趋势, 但在所有区域尺度下沿海拔梯度表现为单调递增趋势。
3 讨论
当前对水生昆虫群落多样性海拔格局的研究多集中在单一尺度的分类多样性(例如Wang et al, 2011; Castro et al, 2019)、或单个类群的个体大小性状分布(例如Vamosi et al, 2007; Cressa et al, 2008)等方面, 对群落分类多样性和功能多样性海拔分布格局的空间差异研究缺乏深入的认识。了解生物多样性对空间尺度的响应, 有助于更清晰地认识群落结构、格局、构建过程及其组织方式, 为探究物种共存或物种多样性的形成和维持机制提供重要基础(Rahbek, 2005)。本研究对云南澜沧江流域水生昆虫群落分类多样性和功能多样性海拔格局的空间差异研究表明, 水生昆虫群落多样性指数海拔格局对局部和区域尺度存在空间依赖性(Jacobsen, 2004; Rahbek, 2005); 在区域尺度下, 分类多样性和功能多样性指数的海拔格局存在一定程度的一致性。
局部尺度水生昆虫物种丰富度指数对海拔梯度无显著响应关系(Flowers, 1991), 但区域尺度物种丰富度指数沿海拔递减的格局特征在水生昆虫中较为普遍(Jacobsen, 2003; Cárcamo et al, 2019)。已有研究表明物种丰富度和功能丰富度存在一定程度的相关关系(例如Edie et al, 2018), 当物种丰富度和dbFD指数相关性较高时表明群落间物种功能冗余度较低(Natalia et al, 2019)。本研究发现物种丰富度指数和dbFD指数在局部尺度沿海拔梯度分别呈现弱“U”型和不显著的单调递增趋势, 但随区域尺度海拔带宽度的增加, 物种丰富度指数和dbFD指数的区域尺度海拔格局呈现递减趋势; 可能表明澜沧江流域区域尺度间溪流水生昆虫类群功能冗余度较低, 即区域尺度下不同物种扮演较为独立的生态功能(Mouchet et al, 2010)。物种组成通常反映了区域过程(物种扩散)和局部过程(竞争、生境异质性)相互作用的结果(Szava-Kovats et al, 2013)。沿海拔梯度升高, 区域尺度下水温(Vinson & Hawkins, 2003)和降水(张景华等, 2015)等因素急剧变化(Wang et al, 2011), 环境过滤作用导致适宜生态位减少, 群落生物性状组成逐渐同质化(Poff et al, 2006), 引起区域尺度丰富度和dbFD指数沿海拔梯度呈降低趋势。但局部尺度下, 溪流生态系统提供的生物栖境异质性(如底质、水文条件和水体理化性质等)(Li FQ et al, 2012; Li ZF et al, 2019), 可能在一定程度抵消了区域生态位减少的影响, 因此局部尺度物种丰富度和dbFD指数的海拔格局并没有呈现显著变化趋势。
尽管当前水生昆虫多样性海拔格局的研究较少涉及Simpson多样性和RaoQ指数, 但其他类群已有相关报道; 如Carvajal-Quintero等(2015)对安第斯山脉鱼类多样性研究发现, 250-500 m区域尺度Simpson多样性指数呈单调递减趋势。本研究发现Simpson多样性指数和RaoQ指数的区域尺度海拔格局呈现一定程度的一致性; 同时, 随区域尺度海拔带宽度增加, 海拔格局均转变为不显著, 这种一致性可能来源于Simpson多样性指数与RaoQ指数的高相关关系(Wong & Dowd, 2015)。然而, Simpson多样性指数在局部尺度的海拔格局最为显著, RaoQ指数则在100 m海拔带区域尺度呈现显著的海拔分布格局, 这种差异性可能源于分类多样性和功能多样性指数对环境因子过滤作用和空间距离的响应差异性(McConkey & O’Farrill, 2015)。如Tinoco等(2018)研究发现, 景观尺度下蜂鸟的RaoQ指数对土地利用变化的敏感程度高于Simpson多样性指数。对淡水大型底栖动物来说, Simpson多样性指数和RaoQ指数均对物理栖境(如底质组成)和水体理化环境(如溶解氧)呈显著的响应关系, 但空间距离同时也是影响RaoQ指数空间分布的重要因素(Wang et al, 2018; Li ZF et al, 2019)。
本文发现局部尺度物种均匀度指数沿海拔呈现单调递减趋势(Mejias, 2011), FEve指数也呈现单调递减的海拔格局, 可能是由于局部尺度FEve与物种均匀度指数呈显著正相关关系所致(陈静等, 2018); 但Wang等(2011)研究发现局部尺度下底栖动物物种均匀度指数沿海拔梯度呈现上升趋势。区域尺度下FEve指数表现出显著的单调递增趋势, 但物种均匀度指数未表现出显著的海拔分布格局, 表明水生昆虫群落组成在区域海拔段的分布均匀程度较为相似。FEve指数衡量物种性状在已占据生态位空间的分布均匀程度, 值越高表明物种对环境资源的利用越充分(Mason et al, 2005)。伴随着海拔梯度上升, 环境过滤作用持续增强, 导致适合物种生存的生态位减少, 因此在局部尺度的水生昆虫空间分布均匀度持续降低; 但区域尺度下物种性状对资源的利用更为充分, 因此区域尺度FEve指数沿海拔梯度呈现递增趋势。
本研究定量分析了多重空间尺度下水生昆虫物种多样性的海拔格局, 结果表明水生昆虫分类多样性和功能多样性海拔格局存在空间尺度依赖性。在不同空间尺度共同作用的多重生态学过程和环境因素(如环境过滤、扩散作用和物种相互作用等) (McGill, 2010; McGill et al, 2015), 是影响物种多样性海拔格局空间尺度依赖性的可能原因; 进一步分析不同空间尺度下分类多样性和功能多样性海拔格局的影响因素, 是理解区域多样性现状, 并制定生物多样性保护对策的重要基础。
附录 Supplementary Material
附录1 澜沧江不同溪流等级采样点位的水生昆虫非参数多维尺度分析
Appendix 1 Nonparametric multidimensional scaling (NMDS) ordination of sampling sites collected from different stream orders using aquatic insect assemblages
附录2 基于广义线性模型(GLM)的区域尺度水生昆虫多样性指数响应海拔段采样点位数量、平均空间距离和平均纬度的P值
Appendix 2 The P values of generalized linear models (GLMs) regressing taxonomic and functional diversity indices against sampling site numbers, average Euclidean distances, and average latitude across elevational bands at regional scales
参考文献
Altitudinal gradients in Magellanic sub-Antarctic lagoons: The effect of elevation on freshwater macroinvertebrate diversity and distribution
Variation in freshwater fish assemblages along a regional elevation gradient in the northern Andes, Colombia
DOI:10.1002/ece3.2015.5.issue-13 URL [本文引用: 2]
Beta diversity of aquatic invertebrates increases along an altitudinal gradient in a Neotropical mountain
DOI:10.1111/btp.2019.51.issue-3 URL [本文引用: 3]
Bacterioplankton community structure in the Lancang River Basin and analysis of driving environmental factors
澜沧江流域浮游细菌群落结构特征及驱动因子分析
Study of macroinvertebrate species and functional diversity in the New Xue River, Shandong Province, China
新薛河底栖动物物种多样性与功能多样性研究
Responses of aquatic insect functional diversity to landscape changes in Atlantic Forest
The role of benthic invertebrate species in freshwater ecosystems: Zoobenthic species influence energy flows and nutrient cycling
Size variation with elevation in adults and larvae of some Venezuelan stoneflies (Insecta: Plecoptera: Perlidae)
Variations in species and functional plant diversity along climatic and grazing gradients
DOI:10.1111/eco.2006.29.issue-6 URL [本文引用: 1]
Nematode distributions as spatial null models for macroinvertebrate species richness across environmental gradients: A case from mountain lakes
Different responses of functional traits and diversity of stream macroinvertebrates to environmental and spatial factors in the Xishuangbanna watershed of the upper Mekong River Basin, China
Influence of thermal regime and land use on benthic invertebrate communities inhabiting headwater streams exposed to contrasted shading
DOI:10.1016/j.scitotenv.2014.10.077 URL [本文引用: 1]
Contrasting responses of functional diversity to major losses in taxonomic diversity
Latitudinal patterns of floristic elements of seed plants in Lancang River in Yunnan, Southwest China
澜沧江流域(云南段)种子植物区系成分的纬度分布格局
Diversity of stream-living insects in northwestern Panamá
Macroinvertebrate diversity in Alpine lakes: Effects of altitude and catchment properties
DOI:10.1007/s10750-005-1808-7 URL [本文引用: 1]
Global patterns in biodiversity
DOI:10.1038/35012228 URL [本文引用: 1]
Morphological taxonomy, DNA barcoding, and species diversity in southern Rocky Mountain headwater streams
Spatial patterns of species richness and functional diversity in Costa Rican terrestrial mammals: Implications for conservation
The climate characteristics and change trends on basins of Lancangjiang valley in Yunnan Province
澜沧江干流河谷盆地气候特征及变化趋势
Calculation of ecological water requirements for in-stream in the Lancang River, Yunnan Province, China
澜沧江(云南段)河道生态需水量计算
Acquiring data for large aquatic resource surveys: The art of compromise among science, logistics, and reality
Altitudinal changes in diversity of macroinvertebrates from small streams in the Ecuadorian Andes
Contrasting patterns in local and zonal family richness of stream invertebrates along an Andean altitudinal gradient
DOI:10.1111/fwb.2004.49.issue-10 URL [本文引用: 3]
Change of land use pattern and analysis of environment impact of Lancang watershed in Yunnan
澜沧江流域云南段土地利用格局变化及环境影响分析
Identifying taxonomic and functional surrogates for spring biodiversity conservation
Ecological and evolutionary drivers of the elevational gradient of diversity
DOI:10.1111/ele.2018.21.issue-7 URL [本文引用: 2]
Ecological divergence among young lineages favours sympatry, but convergence among old ones allows coexistence in syntopy: The scale of limiting similarity
DOI:10.1111/geb.2017.26.issue-5 URL [本文引用: 1]
A distance-based framework for measuring functional diversity from multiple traits
Relationships between stream macroinvertebrates and environmental variables at multiple spatial scales
Elevational pattern of species richness in the Three Gorges region of the Yangtze River: Effect of climate, geometric constraints, area and topographical heterogeneity
长江三峡库区物种多样性的垂直分布格局: 气候、几何限制、面积及地形异质性的影响
Differences in responses of macroinvertebrate traits and functional diversity to environmental variables at different spatial scales between ecoregions in the Wei River basin, China
渭河底栖动物性状和功能对空间尺度环境变量响应的生态区差异性
Multiple facets of stream macroinvertebrate alpha diversity are driven by different ecological factors across an extensive altitudinal gradient
Phylogenetic community structure of subtropical forests along elevational gradients in Ailao Mountains of southwest China
沿海拔梯度变化的哀牢山亚热带森林群落系统发育结构
Functional richness, functional evenness and functional divergence: The primary components of functional diversity
DOI:10.1111/oik.2005.111.issue-1 URL [本文引用: 2]
Elevation alters ecosystem properties across temperate treelines globally
Cryptic function loss in animal populations
Fifteen forms of biodiversity trend in the Anthropocene
Benthic Macroinvertebrates of Temperate, Sub-Antarctic Streams: The Effects of Altitudinal Zoning and Temperature on the Phenology of Aquatic Insects Associated to the Robalo River, Navarino Island (55°S), Chile
The functional significance of bioturbation and biodeposition on biogeochemical processes at the water-sediment interface in freshwater and marine ecosystems
DOI:10.1899/10-121.1 URL [本文引用: 1]
Functional diversity measures: An overview of their redundancy and their ability to discriminate community assembly rules
DOI:10.1111/fec.2010.24.issue-4 URL [本文引用: 1]
Spatial incongruence in the species richness and functional diversity of cricetid rodents
Functional diversity (FD), species richness and community composition
DOI:10.1046/j.1461-0248.2002.00339.x URL [本文引用: 2]
The measurement of diversity in different types of biological collections
DOI:10.1016/0022-5193(66)90013-0 URL [本文引用: 1]
Functional trait niches of North American lotic insects: Traits-based ecological applications in light of phylogenetic relationships
The role of spatial scale and the perception of large-scale species-richness patterns
On the measurement of species diversity incorporating species differences
Species composition and stability of nekton community structure in Sandu Bay, Fujian Province
DOI:10.17520/biods.2014223
URL
[本文引用: 1]

In order to analyze the species composition and evaluate the stability of nekton community structure in Sandu Bay of Fujian Province, species diversity, an Abundance Biomass Comparison (ABC) curve and taxonomic diversity were described based on a net fishing survey conducted in Sandu Bay from October 2012 to September 2013. A total of 195 species belonging to 125 genera, 64 families and 17 orders were recorded including 143 fish species, 47 crustacean species and 5 cephalopod species. Larimichthys crocea was the most dominant species identified in all four surveys and most were escaped groups from fish farms. The other dominant species included Johnius belengerii, Argyrosomus argentatus, gobies, and several crustacean species, which were characteristized by small body size, short breeding period and seasonal or annual drastic fluctuations in biomass. The average Shannon-Wiener diversity index in Sandu Bay was 2.61, and higher in September and October than in January and May. ABC curve analysis showed that the community structure had obvious seasonal changes and the impacting factors may include internal factors and external factors such as the supplement of breeding groups, individual growth, fishery production, and summer fishing moratoriums. This study revealed that the biomass proportion of the large yellow croaker has a very significant negative correlation with Shannon-Wiener diversity index (P < 0.01, R = –0.890) and a significant negative correlation with species number (P < 0.05, R = –0.563). Combined with survey data from recent years, there were 224 fish species in Sandu Bay; based on this data, the average taxonomic distinctness (△+) and the variation in taxonomic distinctness (∧+) were tested. The result showed that the value of △+ in Sandu Bay was 59.5 and the value of ∧+ was 260.8. Compared with other coastal waters in China, the average taxonomic range in Sandu Bay was relatively narrow and the taxonomic status was extremely uneven, indicating the anti-interference ability of the fish community in Sandu Bay was poor.
福建三都澳游泳动物种类组成及群落结构稳定性
DOI:10.17520/biods.2014223
URL
[本文引用: 1]
In order to analyze the species composition and evaluate the stability of nekton community structure in Sandu Bay of Fujian Province, species diversity, an Abundance Biomass Comparison (ABC) curve and taxonomic diversity were described based on a net fishing survey conducted in Sandu Bay from October 2012 to September 2013. A total of 195 species belonging to 125 genera, 64 families and 17 orders were recorded including 143 fish species, 47 crustacean species and 5 cephalopod species. Larimichthys crocea was the most dominant species identified in all four surveys and most were escaped groups from fish farms. The other dominant species included Johnius belengerii, Argyrosomus argentatus, gobies, and several crustacean species, which were characteristized by small body size, short breeding period and seasonal or annual drastic fluctuations in biomass. The average Shannon-Wiener diversity index in Sandu Bay was 2.61, and higher in September and October than in January and May. ABC curve analysis showed that the community structure had obvious seasonal changes and the impacting factors may include internal factors and external factors such as the supplement of breeding groups, individual growth, fishery production, and summer fishing moratoriums. This study revealed that the biomass proportion of the large yellow croaker has a very significant negative correlation with Shannon-Wiener diversity index (P < 0.01, R = –0.890) and a significant negative correlation with species number (P < 0.05, R = –0.563). Combined with survey data from recent years, there were 224 fish species in Sandu Bay; based on this data, the average taxonomic distinctness (△+) and the variation in taxonomic distinctness (∧+) were tested. The result showed that the value of △+ in Sandu Bay was 59.5 and the value of ∧+ was 260.8. Compared with other coastal waters in China, the average taxonomic range in Sandu Bay was relatively narrow and the taxonomic status was extremely uneven, indicating the anti-interference ability of the fish community in Sandu Bay was poor.
Community and ecosystem responses to elevational gradients: Processes, mechanisms, and insights for global change
DOI:10.1146/annurev-ecolsys-110512-135750 URL [本文引用: 1]
Pattern without bias: Local-regional richness relationship revisited
DOI:10.1890/13-0244.1
URL
[本文引用: 1]
For decades, ecologists have been testing for species saturation by using regression analysis to determine the relationship between local and regional species richness. The cumulative result of scores of studies and meta-analyses has led to a general consensus that evidence of species saturation is relatively uncommon. However, the bias induced on the regression by the arbitrary choice of local and regional area has threatened to undermine this consensus and has even led to the proposal to abandon the regression method entirely. Nonetheless, the use of regression analysis to determine local-regional richness relationships continues. We performed a meta-analysis of almost 100 data sets using a log-ratio-based regression model that is free of the scale-induced bias inherent in more commonly used models. This reanalysis contradicts the general consensus: saturated relationships are at least as common as unsaturated patterns. However, a discouragingly large proportion of studies produce no discernable patterns at all. An explanation for such a plethora of species saturation patterns poses a challenge to our understanding of the processes that govern community assembly.
A review on the elevational patterns of plant species diversity
Patterns of biodiversity along environmental gradients is one of the basic issues in the biodiversity studies. The elevational gradient incorporates multiple resource gradients which vary continuously in different fashions. As patterns along environmental gradients are significantly scale dependent, we reviewed plant diversity patterns along the elevational gradient in different scales: α diversity, β diversity and γ diversity, as well the factors which maintain these patterns. At the local scale, there is no fixed elevational pattern for herb species richness. For woody plants, the monotonic decrease of species richness as elevation increases is thought to be a general pattern, yet other patterns exist. The decrease of β diversity with increasing elevation has been observed in different ecosystems. Species richness in different elevational bands exhibits two different patterns, monotonic decrease and humpshaped pattern along the elevational gradient.
植物物种多样性的垂直分布格局
Patterns of biodiversity along environmental gradients is one of the basic issues in the biodiversity studies. The elevational gradient incorporates multiple resource gradients which vary continuously in different fashions. As patterns along environmental gradients are significantly scale dependent, we reviewed plant diversity patterns along the elevational gradient in different scales: α diversity, β diversity and γ diversity, as well the factors which maintain these patterns. At the local scale, there is no fixed elevational pattern for herb species richness. For woody plants, the monotonic decrease of species richness as elevation increases is thought to be a general pattern, yet other patterns exist. The decrease of β diversity with increasing elevation has been observed in different ecosystems. Species richness in different elevational bands exhibits two different patterns, monotonic decrease and humpshaped pattern along the elevational gradient.
Land use change has stronger effects on functional diversity than taxonomic diversity in tropical Andean hummingbirds
Biological and ecological traits of benthic freshwater macroinvertebrates: Relationships and definition of groups with similar traits
Body size and species richness along geographical gradients in Albertan diving beetle (Coleoptera: Dytiscidae) communities
New multidimensional functional diversity indices for a multifaceted framework in functional ecology
Contrasting changes in taxonomic vs
Broad-scale geographical patterns in local stream insect genera richness
DOI:10.1111/eco.2003.26.issue-6 URL [本文引用: 1]
The macrobenthic communities and distribution of the Lancang River
澜沧江大型底栖动物群落结构及分布格局
Contrasting patterns in elevational diversity between microorganisms and macroorganisms
Changes in multiple facets of macroinvertebrate alpha diversity are linked to afforestation in a subtropical riverine natural reserve
Patterns in taxonomic and functional diversity of macrobenthic invertebrates across seagrass habitats: A case study in Atlantic Canada
Application of Akaike’s information criterion (AIC) in the evaluation of linear pharmacokinetic equations
DOI:10.1007/BF01117450 URL [本文引用: 1]
A comparison of the altitudinal patterns in plant species diversity within the dry valleys of the Three Parallel Rivers region, northwestern Yunnan
DOI:10.17520/biods.2015361
URL
[本文引用: 1]
In the typical dry valleys of the Three Parallel Rivers region, northwest Yunnan Province, we investigated vegetation using six sampling transects, each comprised of ten standard plots, along altitudinal gradients on the eastern and the western aspects of Nu River, Langcang River, and Jinsha River. With these data, we compared the elevation-related distribution of plant species richness and species turnover rates along the six transects, and explained the patterns using geography and vegetation variables. The dry-warm vegetation zone was dominated by shrubs and herbs and located below the altitude of 3,000 m a.s.l. At higher elevations, shrub and herbs were replaced with a forest zone. The spatial distribution of plant species richness increased with elevation and latitude, especially for herb and shrub species, and was also related to river, vegetation zones, and longitude. The species richness of shrubs also increased significantly across the region, from west to east. Species richness of herbs and shrubs in the Nu River were higher than those in the Lancang River and the Jinsha River, whereas the difference of species richness among three rivers was not significant for trees. Herb species richness in the forest zone was less than that in the shrub and herb zones. Species turnover rate of different zones presented inconsistent altitudinal gradient patterns, but all peak values appeared in the ecotones between shrub communities, in the lower altitudes of the transect, and forest communities, in the higher altitudes. The forest-shrub ecotone is located at an altitude range of 1,900–2,100 m in the Nu River valley, at an altitude range of 2,300–2,400 m in the Lancang River valley and at an altitude range of 2,700–2,900 m in the Jinsha River valley. The mean species turnover rates between shrub & herb section and forest section within each transect were less than the mean turnover rates of the same vegetation section between different transects within the same basin, and also less than the mean turnover rates for same vegetation section in all six transects. Spatial isolation could explain 34.2% of the variation in species turnover rate among the 12 vegetation sections of the six altitudinal transects, while vegetation differences explained less than 0.5% of the variation. These results show the primary role of environment difference in determining the species richness between vegetation types, whereas geographical isolation between the rivers as a dominant factor in the assembly (e.g. species composition) of plant communities.
三江并流地区干旱河谷植物物种多样性海拔梯度格局比较
DOI:10.17520/biods.2015361
URL
[本文引用: 1]
In the typical dry valleys of the Three Parallel Rivers region, northwest Yunnan Province, we investigated vegetation using six sampling transects, each comprised of ten standard plots, along altitudinal gradients on the eastern and the western aspects of Nu River, Langcang River, and Jinsha River. With these data, we compared the elevation-related distribution of plant species richness and species turnover rates along the six transects, and explained the patterns using geography and vegetation variables. The dry-warm vegetation zone was dominated by shrubs and herbs and located below the altitude of 3,000 m a.s.l. At higher elevations, shrub and herbs were replaced with a forest zone. The spatial distribution of plant species richness increased with elevation and latitude, especially for herb and shrub species, and was also related to river, vegetation zones, and longitude. The species richness of shrubs also increased significantly across the region, from west to east. Species richness of herbs and shrubs in the Nu River were higher than those in the Lancang River and the Jinsha River, whereas the difference of species richness among three rivers was not significant for trees. Herb species richness in the forest zone was less than that in the shrub and herb zones. Species turnover rate of different zones presented inconsistent altitudinal gradient patterns, but all peak values appeared in the ecotones between shrub communities, in the lower altitudes of the transect, and forest communities, in the higher altitudes. The forest-shrub ecotone is located at an altitude range of 1,900–2,100 m in the Nu River valley, at an altitude range of 2,300–2,400 m in the Lancang River valley and at an altitude range of 2,700–2,900 m in the Jinsha River valley. The mean species turnover rates between shrub & herb section and forest section within each transect were less than the mean turnover rates of the same vegetation section between different transects within the same basin, and also less than the mean turnover rates for same vegetation section in all six transects. Spatial isolation could explain 34.2% of the variation in species turnover rate among the 12 vegetation sections of the six altitudinal transects, while vegetation differences explained less than 0.5% of the variation. These results show the primary role of environment difference in determining the species richness between vegetation types, whereas geographical isolation between the rivers as a dominant factor in the assembly (e.g. species composition) of plant communities.
Analysis of the correlation between NDVI and climate factors in the Lancang River basin
澜沧江流域植被NDVI与气候因子的相关性分析
