生物多样性评估挑战的层级占有率模型解决路径
Hierarchical occupancy models as solutions to challenges in biodiversity assessment
生物多样性评估挑战的层级占有率模型解决路径 |
| 吴春莹, Viorel D. Popescu, 季吟秋 |
|
Hierarchical occupancy models as solutions to challenges in biodiversity assessment |
| Chunying Wu, Viorel D. Popescu, Yinqiu Ji |
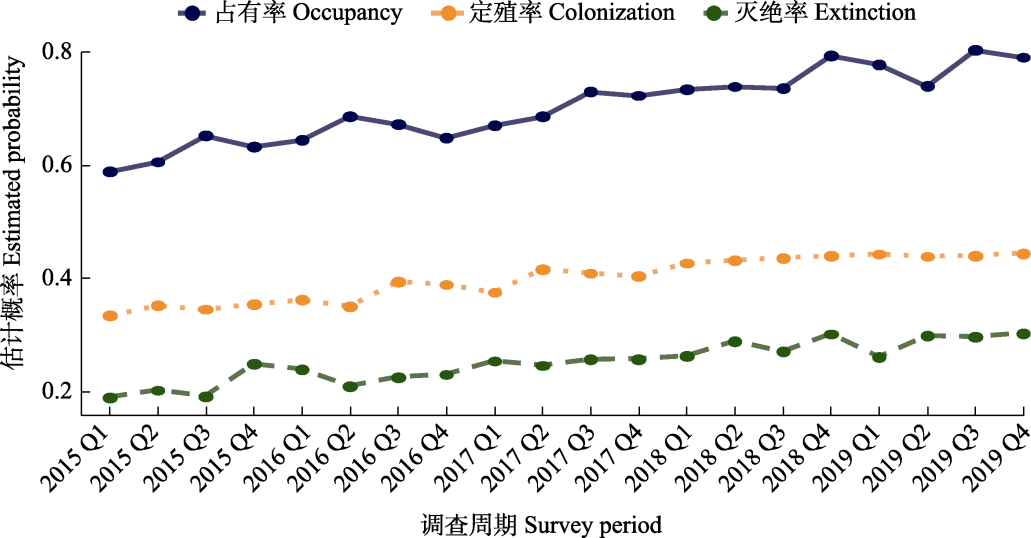
| 图4 物种多季节占有率动态与迁移趋势示意图。图中展示了基于模拟数据的某物种在2015-2019年间的季度动态(Q1-Q4分别代表第一至第四季度): 占有率ψ (蓝色实线)整体维持在0.6-0.8, 表明其在研究区域内持续保持较高存在率; 定殖概率γ (橙色点线)稳定在0.3-0.4, 略有上升, 反映其扩展能力较强; 灭绝概率ε (绿色虚线)维持在0.1-0.2, 提示可能存在栖息地干扰或环境压力。该图基于模拟数据绘制, 用于示意多季节层级占有率模型在揭示物种动态方面的应用。R代码见附录2。 |
| Fig. 4 Schematic diagram of multi-season occupancy dynamics and state transition trends. This diagram illustrates the quarterly dynamics (where Q1-Q4 represent the first to fourth quarters of each year, respectively) of a species based on simulated data between 2015 and 2019: The occupancy rate (ψ, blue solid line) is generally maintained between 0.6-0.8, indicating a high persistent probability of presence in the study area. The colonization probability (γ, orange dotted line) is stable at 0.3-0.4 with a slight upward trend, reflecting a relatively strong capacity for range expansion. The extinction probability (ε, green dashed line) is maintained at 0.1-0.2, suggesting potential habitat disturbance or environmental pressure. This figure is created using simulated data and serves to illustrate the application of the multi-season hierarchical occupancy model (MSOM) in revealing species dynamics. Please see Appendix 2 for the R code. |
|
|